Hatica vs Jellyfish
The future engineering leaders need credible analytics to drive alignment, velocity, and well-being within teams - not just some fishy solutions
Join the 600+ companies using the Hatica platform


Hatica
Jellyfish
What happens when you switch to Hatica?
>50%
2.1x
>40%
Hatica vs Jellyfish - Comparison at a Glance
| Features | Hatica | Jellyfish |
|---|---|---|
| Full SPACE metrics | ✅ | ❌ |
| DORA metrics | ✅ | ✅ |
| Sprint Metrics | ✅ | ❌ |
| Wellbeing metrics | ✅ | ❌ |
| Activity dashboards | ✅ | ❌ |
| Cost Capitalisation Reports | ✅ | ✅ |
| Surveys and Checkins | ✅ | ❌ |
| Automated stand-ups | ✅ | ❌ |
| Developer Automations | ✅ | ❌ |
| Continuous improvement tooling | ✅ | ❌ |
| Self hosted | ✅ | ❌ |
| Custom Dashboards | ✅ | ❌ |
| Connection support | 30+ Connectors | ❌ |
Experience the difference yourself
Book a DemoHatica outperforms Jellyfish in all aspects
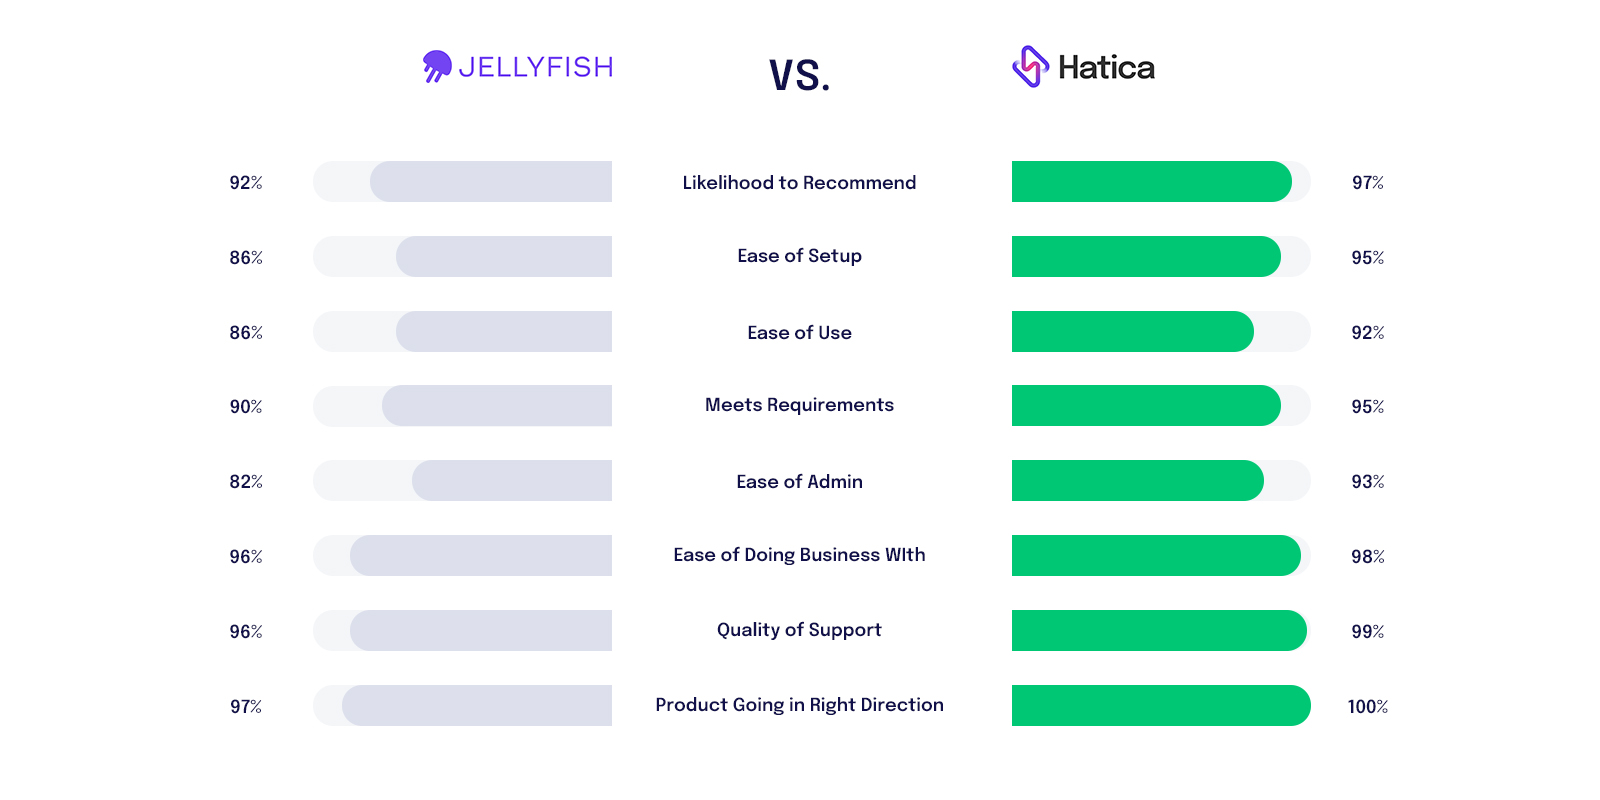
Engineering Teams Love Hatica
Rated #1 for Likelihood to Recommend and Best Meets ROI


What sets Hatica above the rest
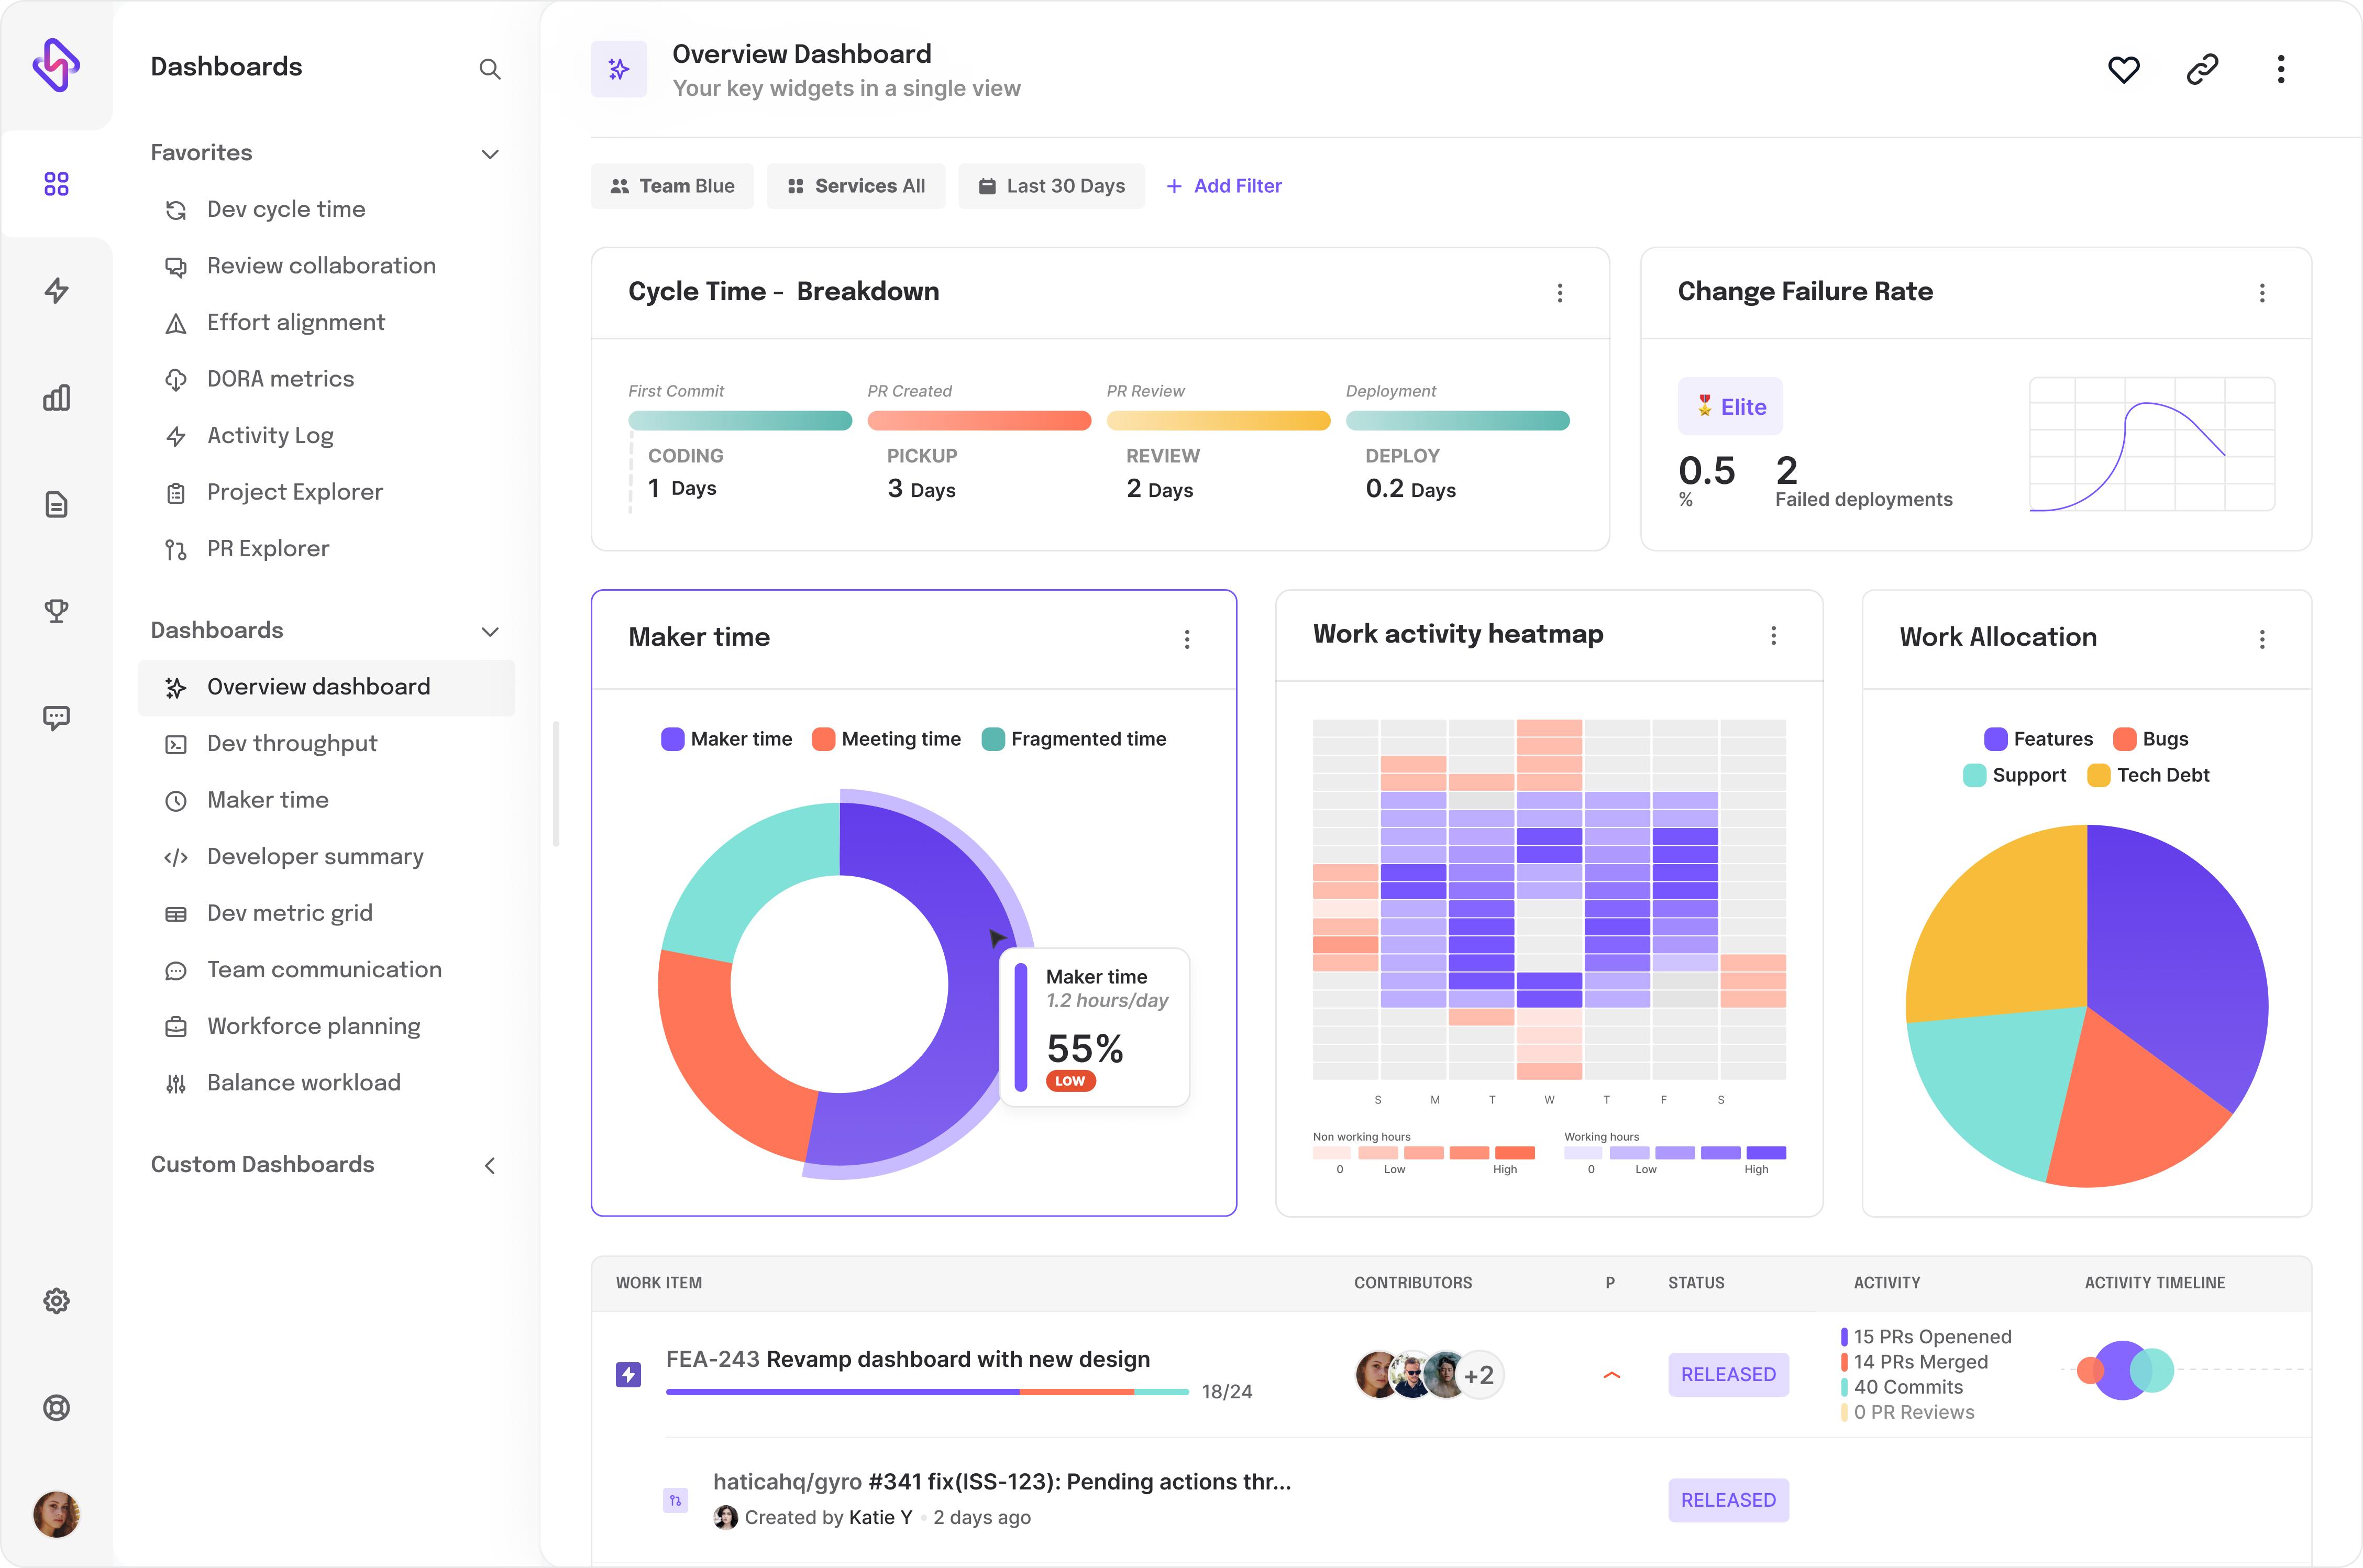
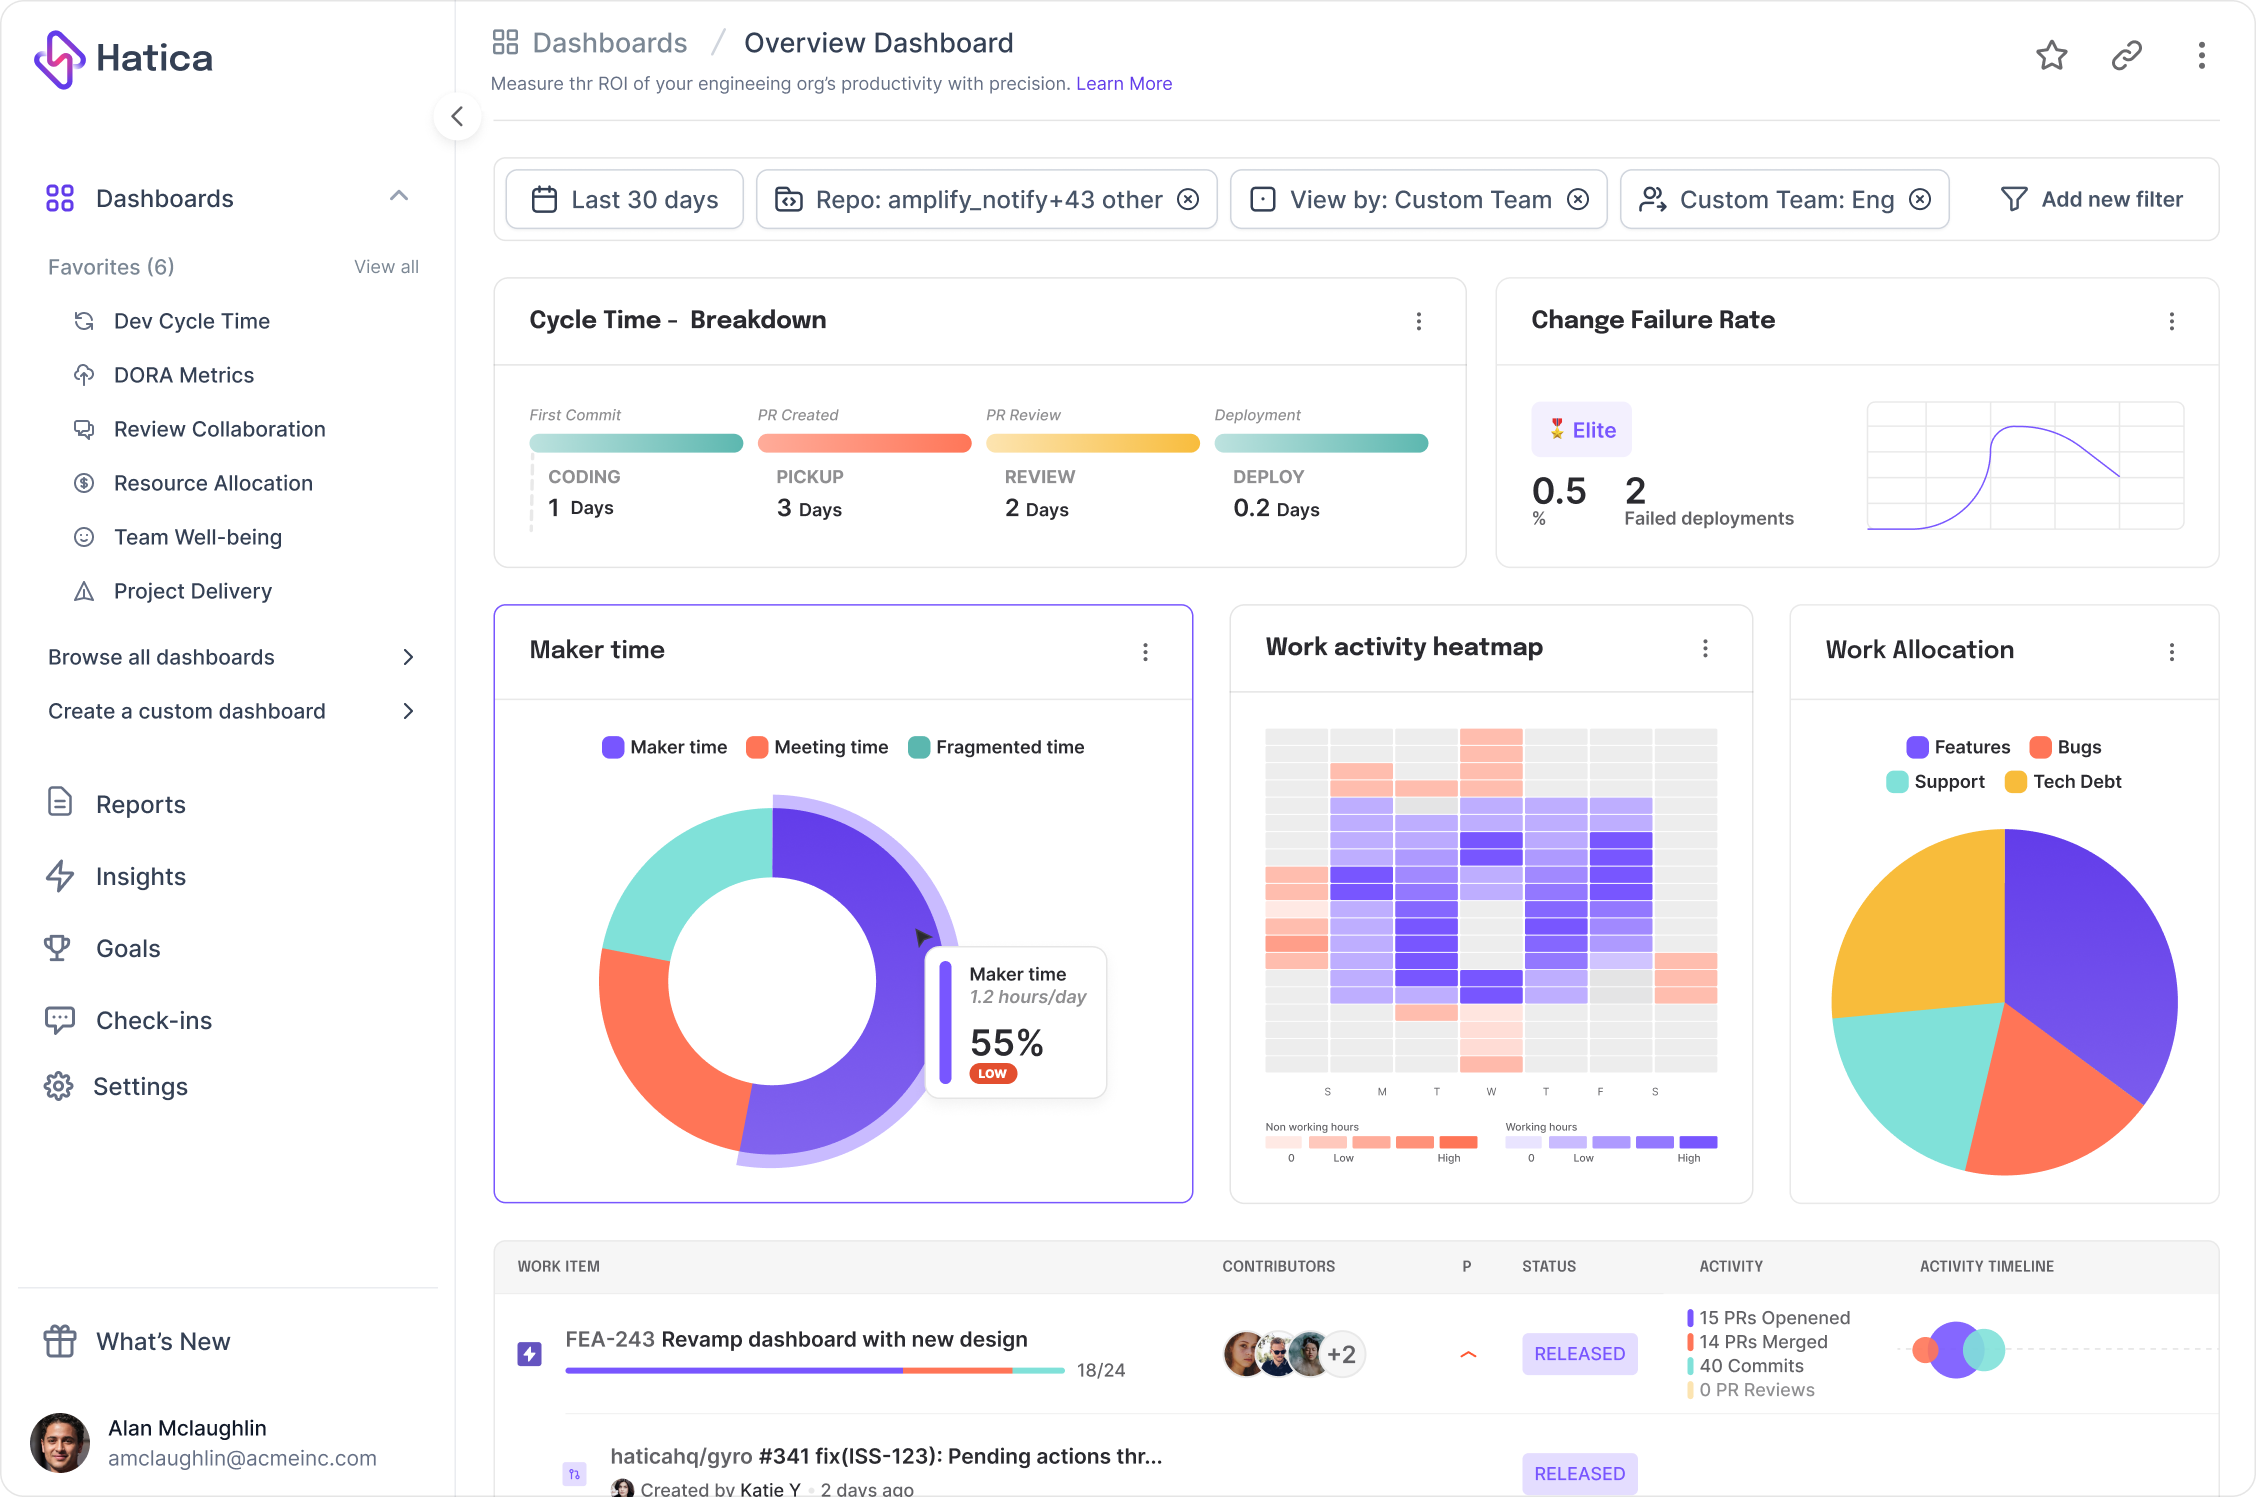
Hatica is purposely built to serve as a customizable platform for engineering teams ranging from 20 to 30,000+ engineers to drive alignment, velocity and well-being.
Fosters Team Alignment
Get a 360° view into how your developers are aligned across various projects in your engineering org and help them prioritize better for achieving business goals.

Accelerate Delivery Velocity
Identify blockers that prevent your team from delivering on time while maintaining the code quality using custom dashboards for various stages of SDLC.

Promotes Team Well-Being
Pre-empt any engineering burnout, uneven workload distribution, meetings outside office hours to foster a culture of well-being for higher productivity.

Map ROI to Engineering Effort
Stay on top of the bottomline for your engineering org by having a clear view into revenue generated out of all the engineering effort and dollar spent on each project.

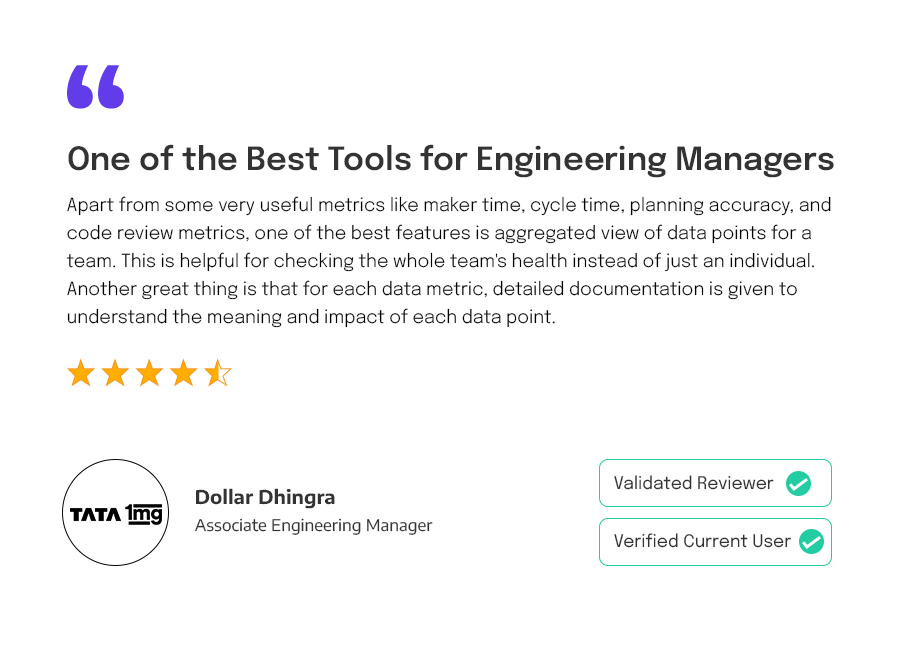
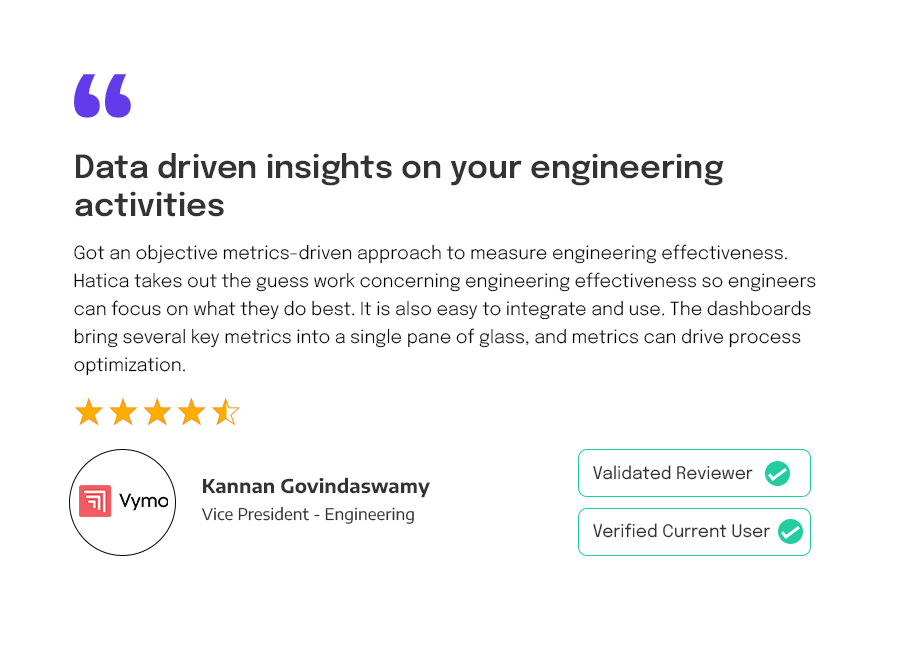
What Engineering Leaders have to say about Hatica?
Ready to dive in? Start your free trial today