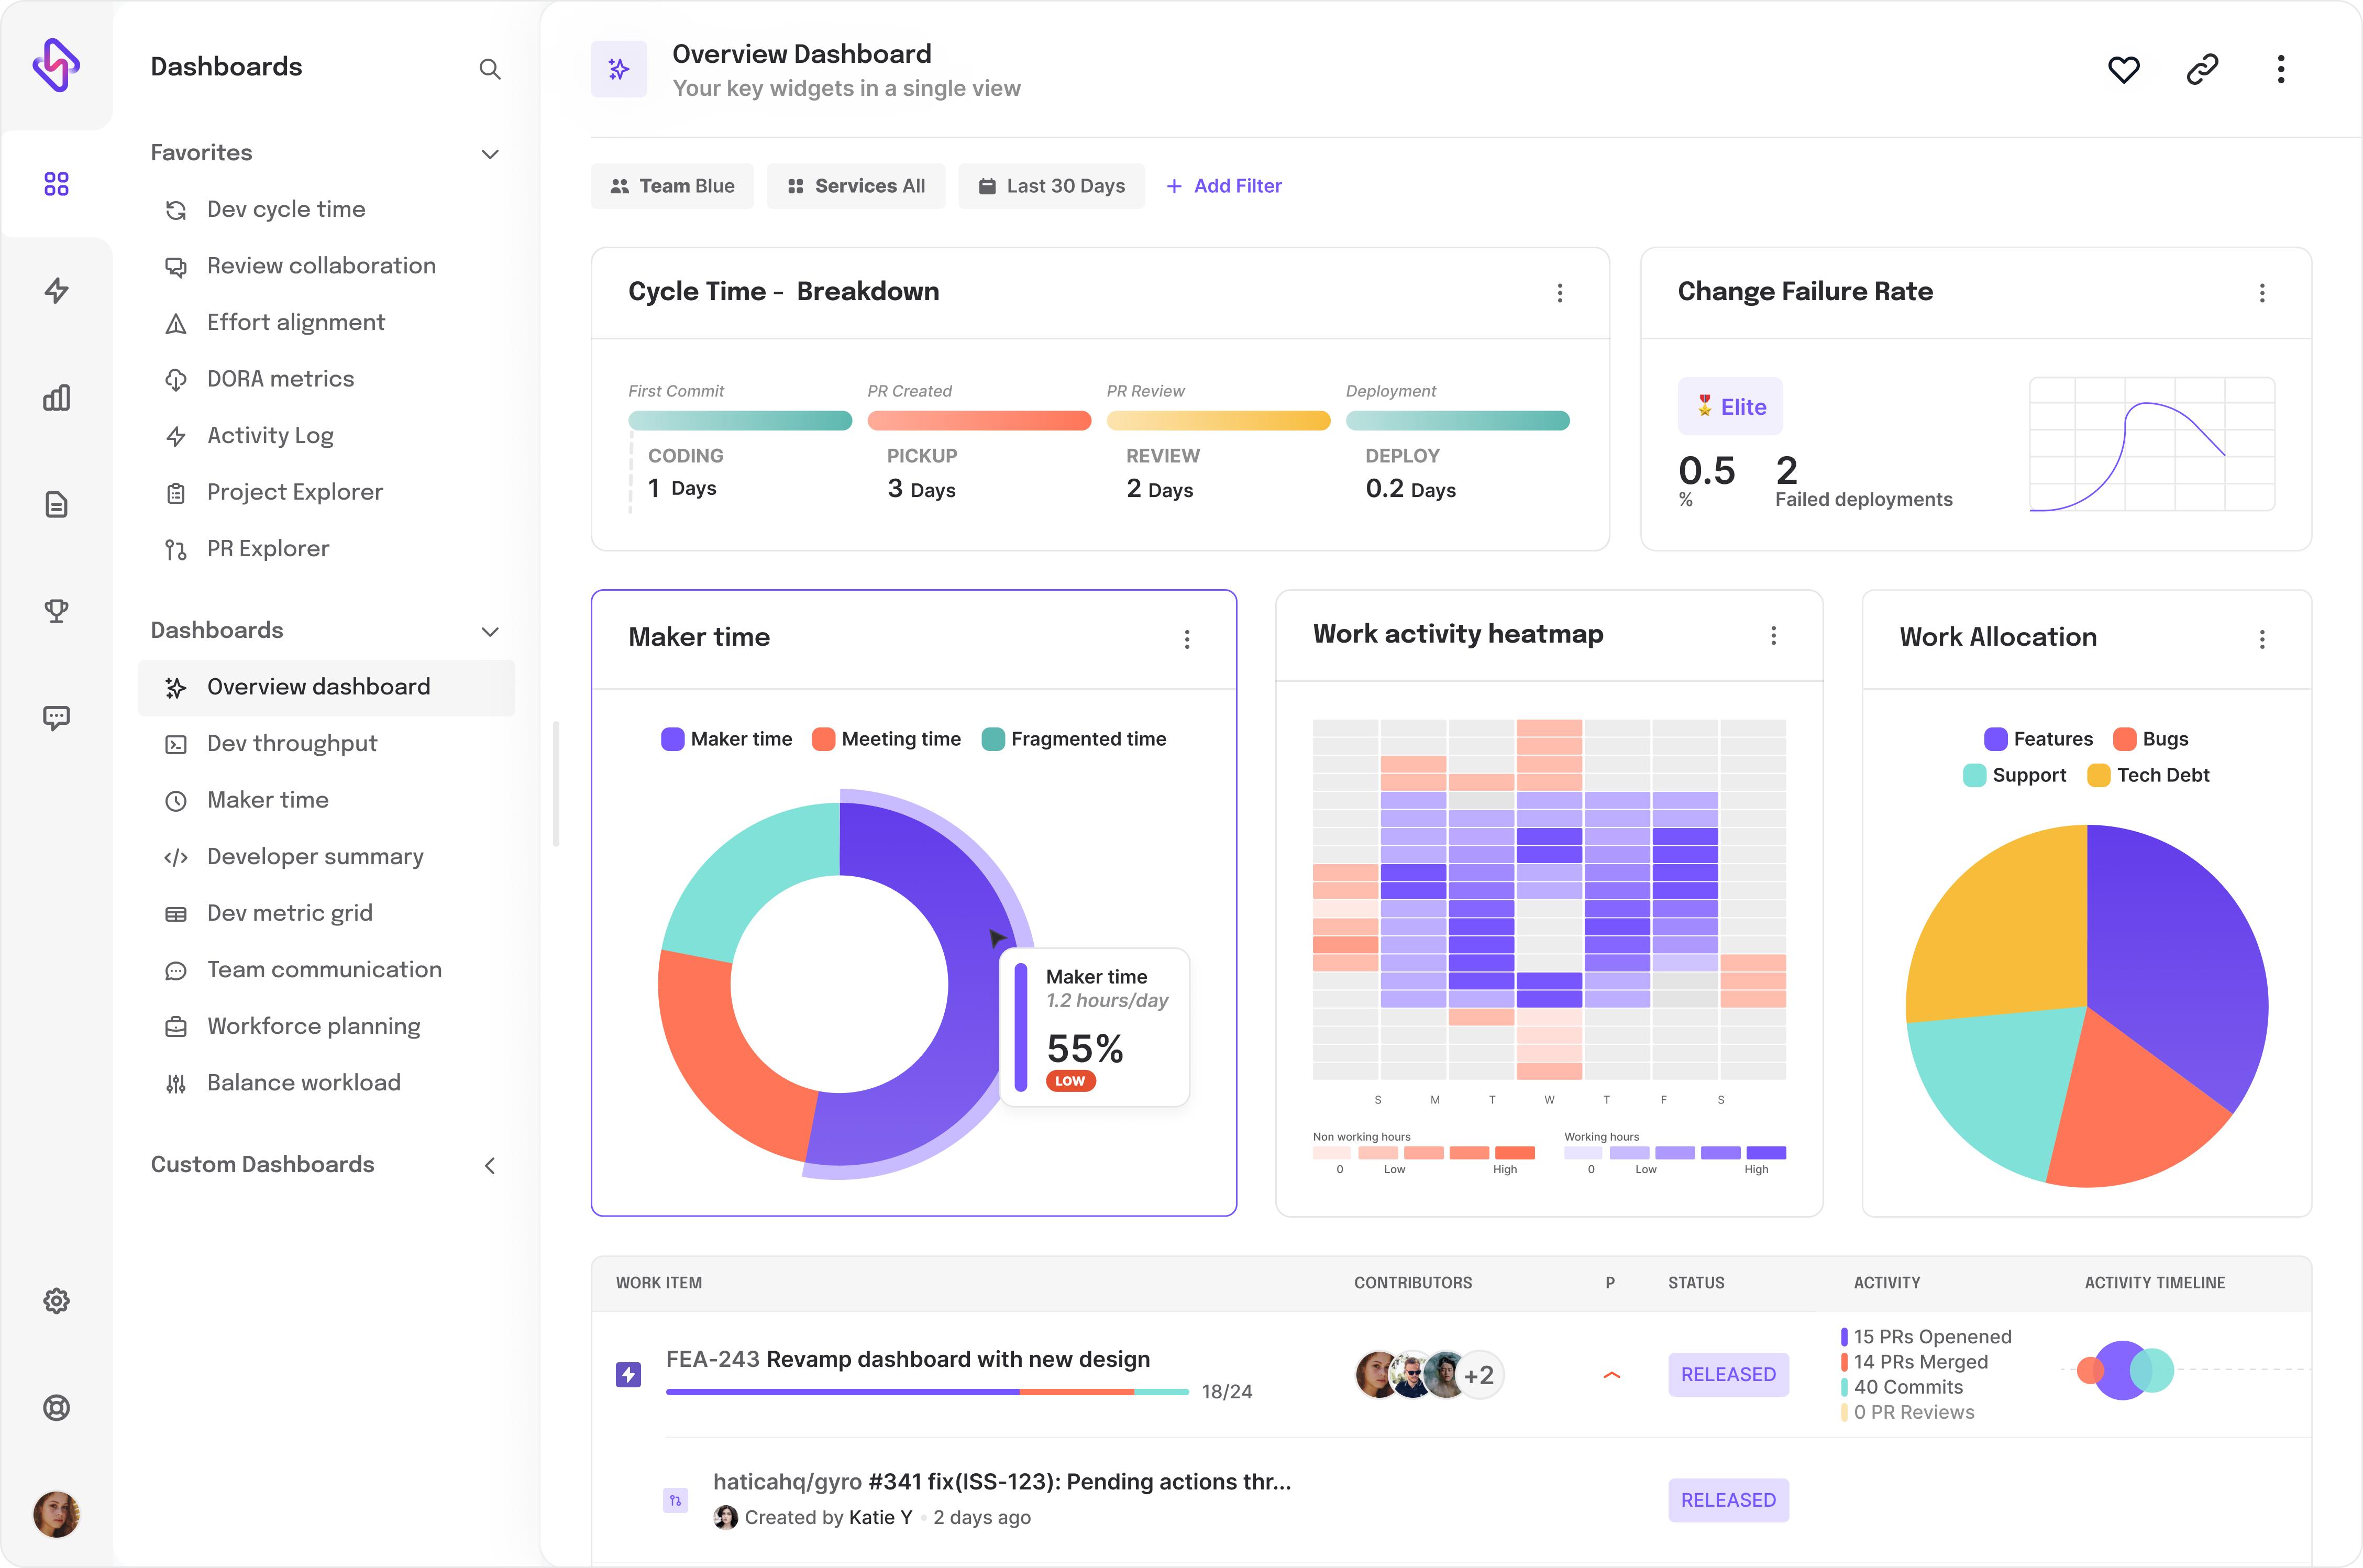
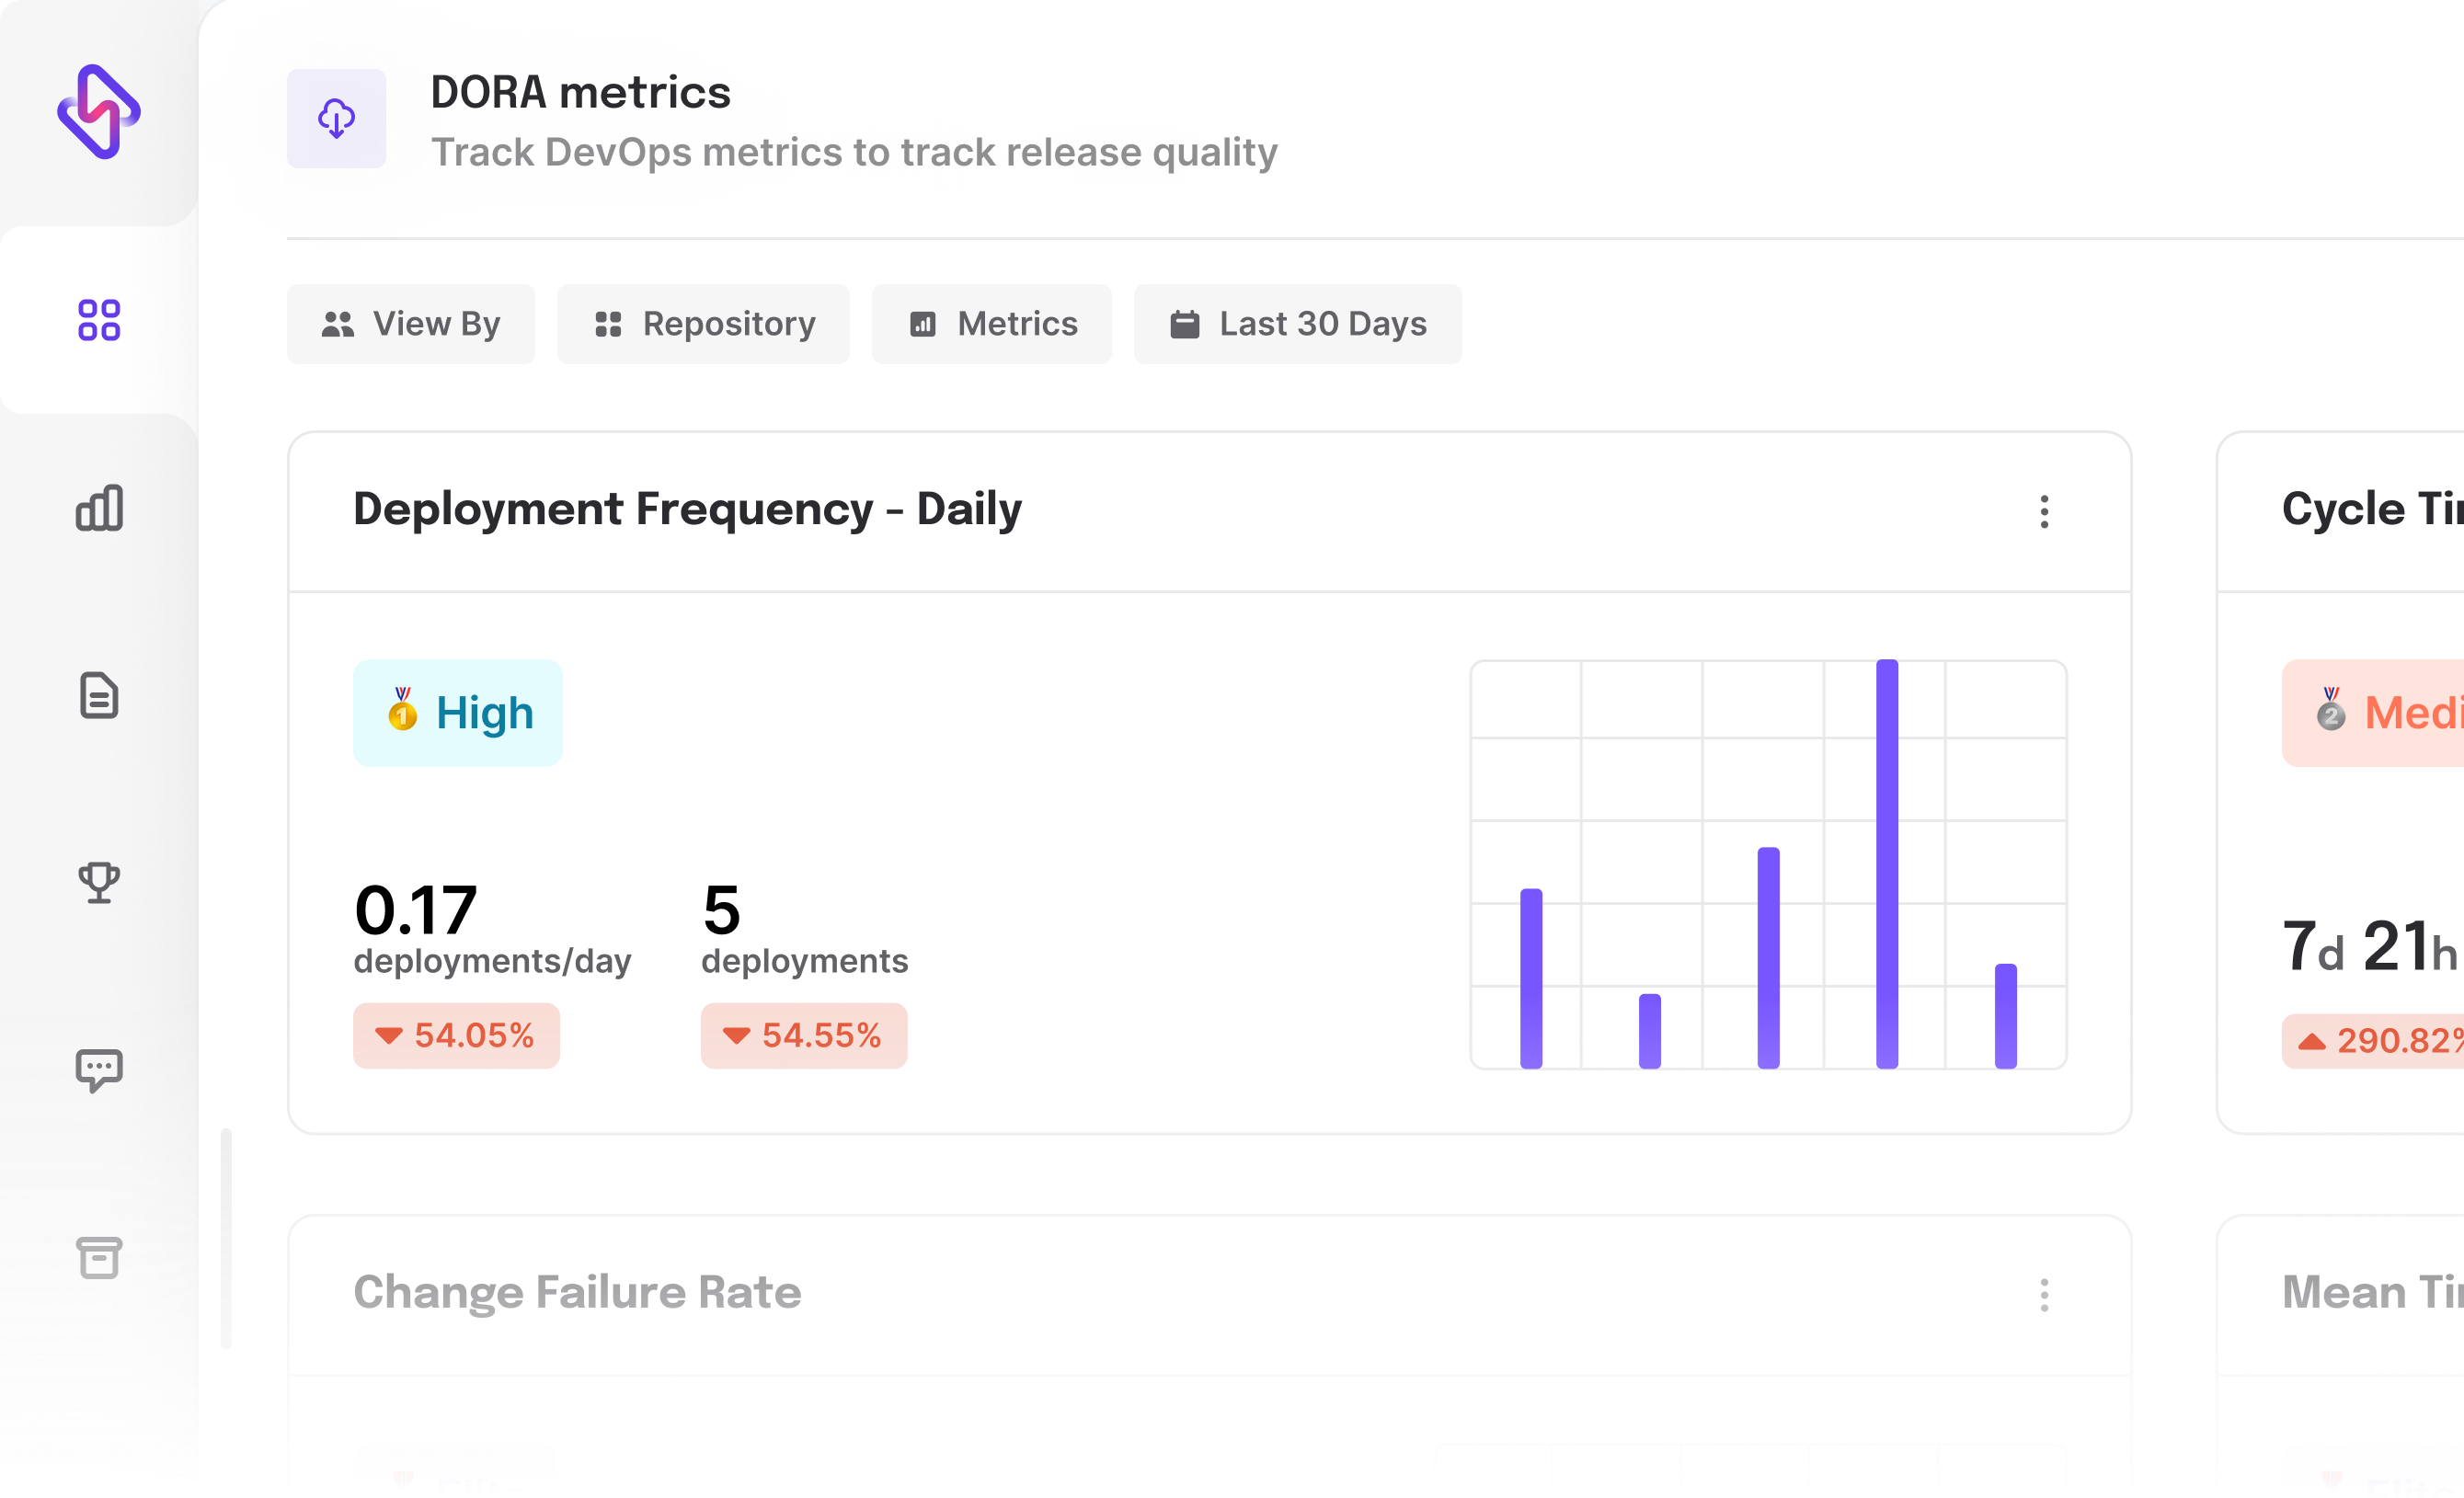
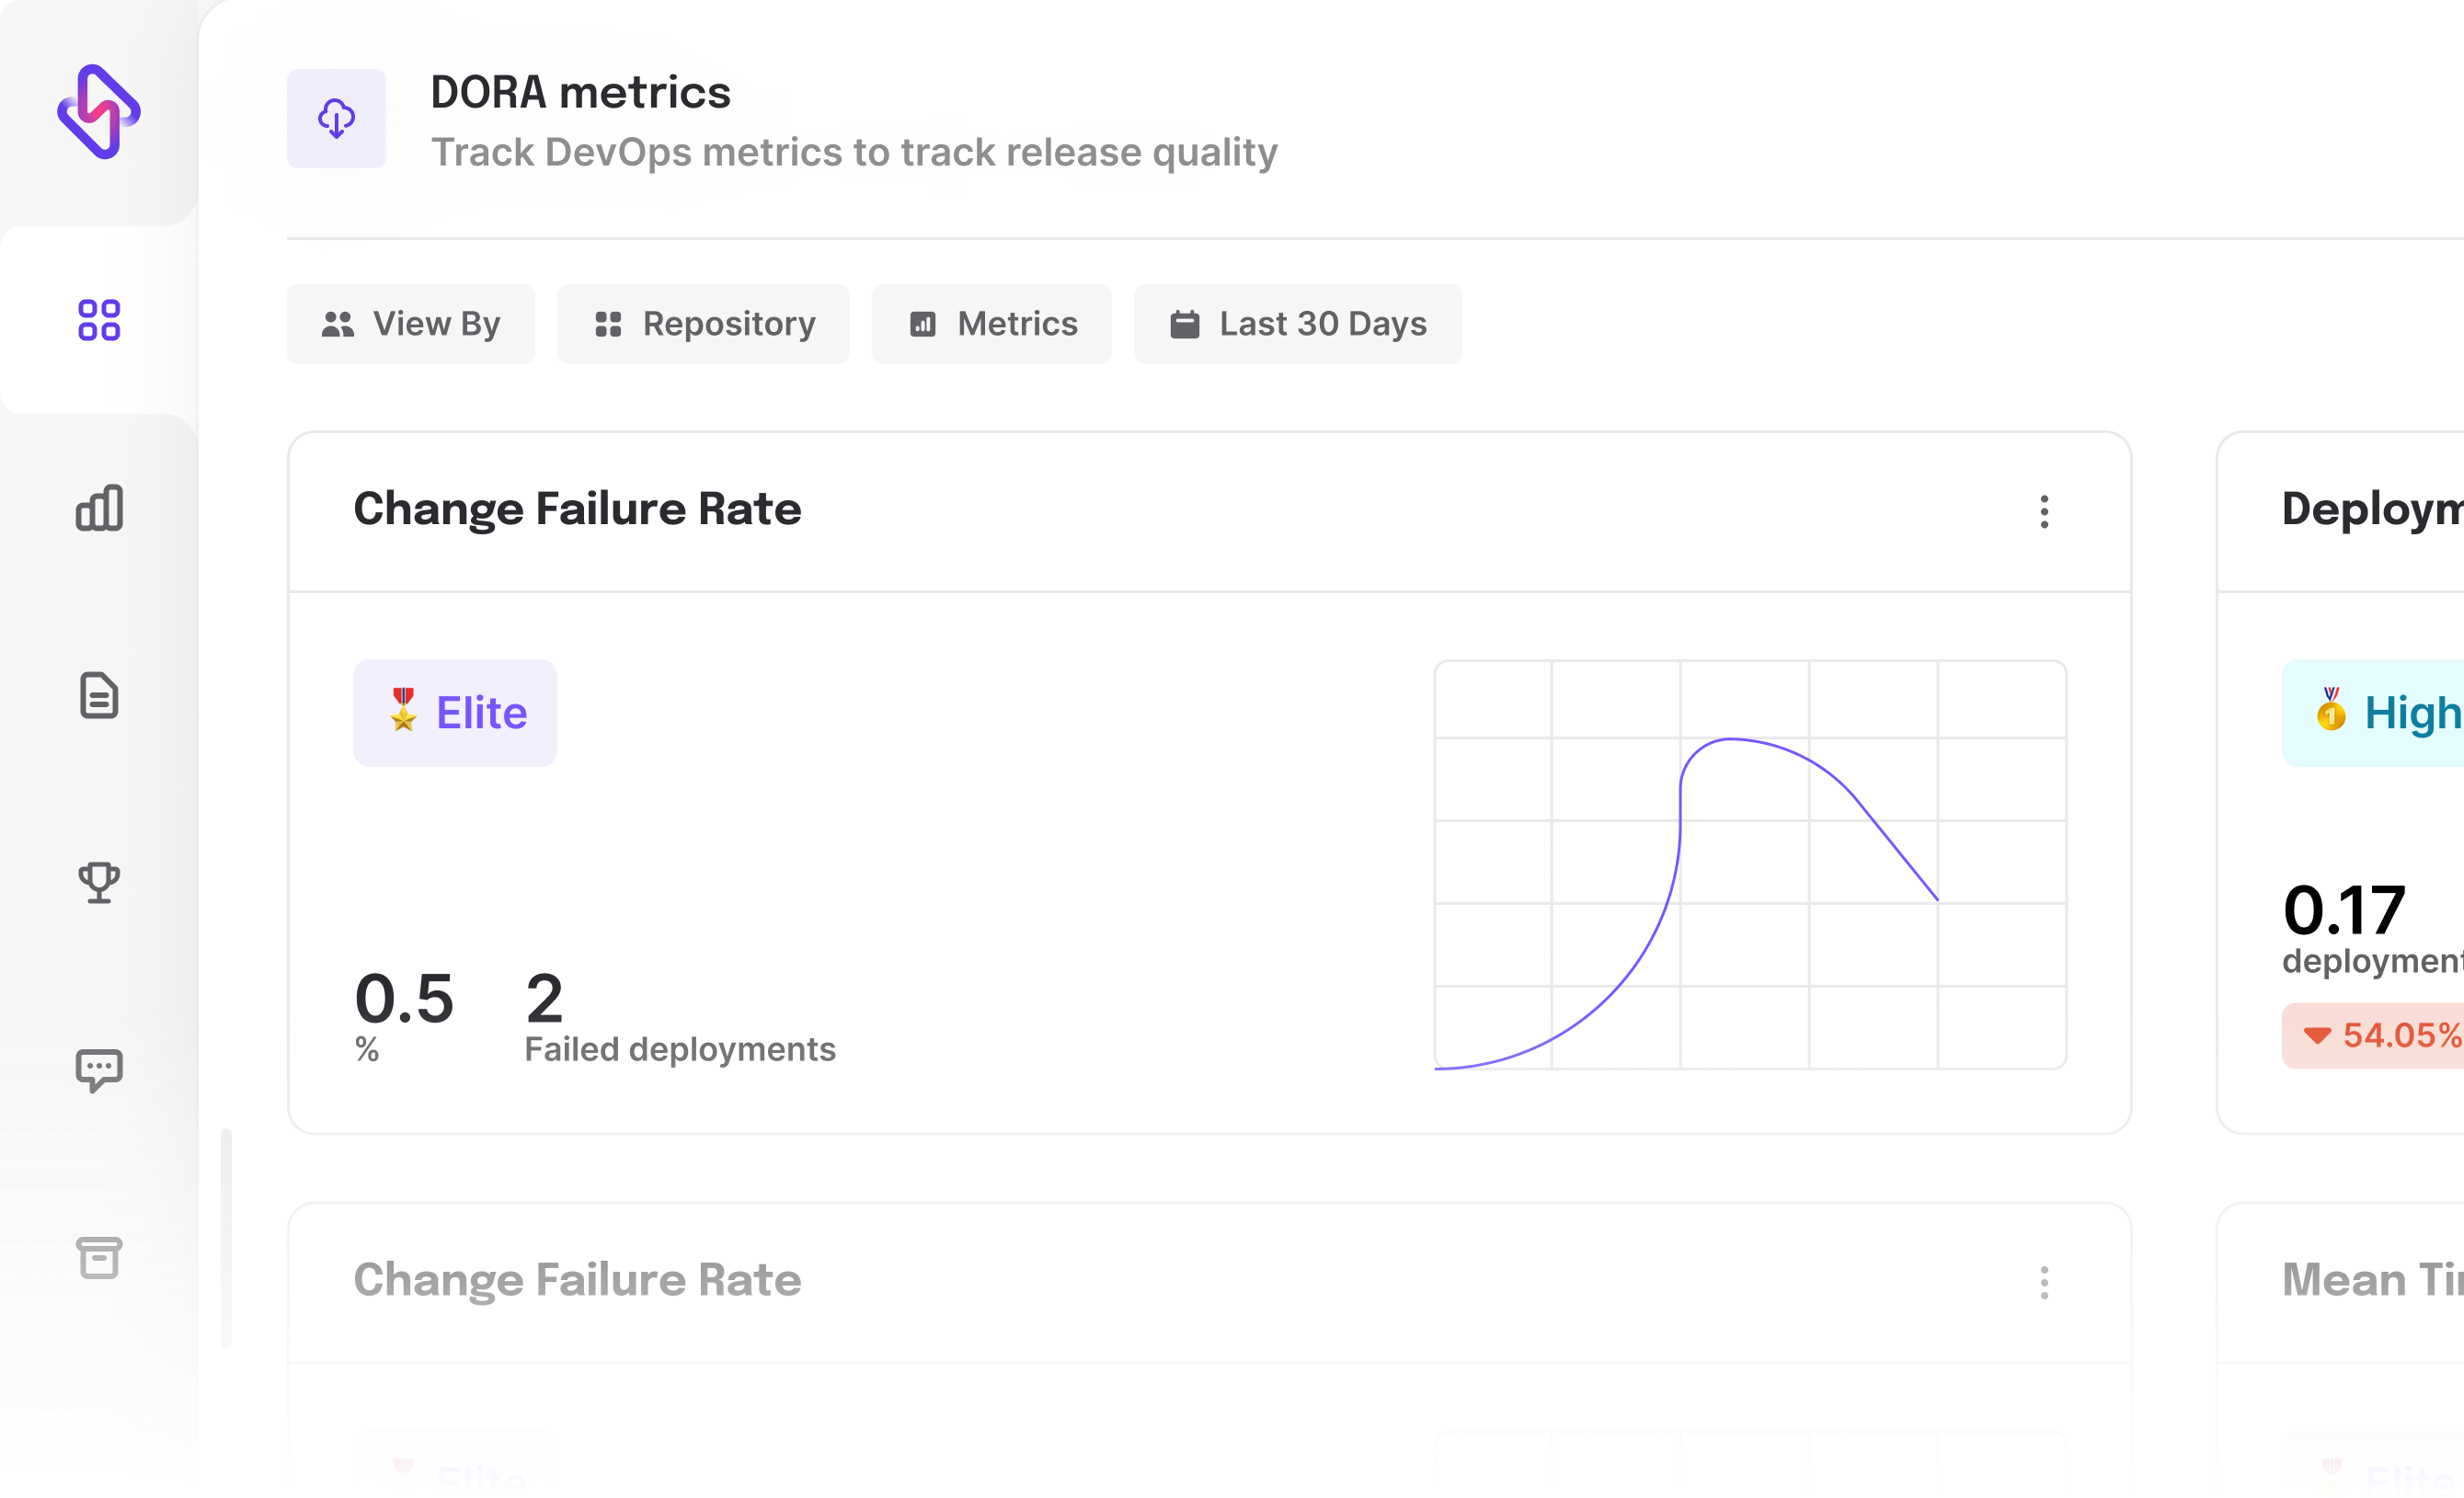
DORA metrics
Track DevOps performance with Hatica's research-backed DORA metrics dashboard
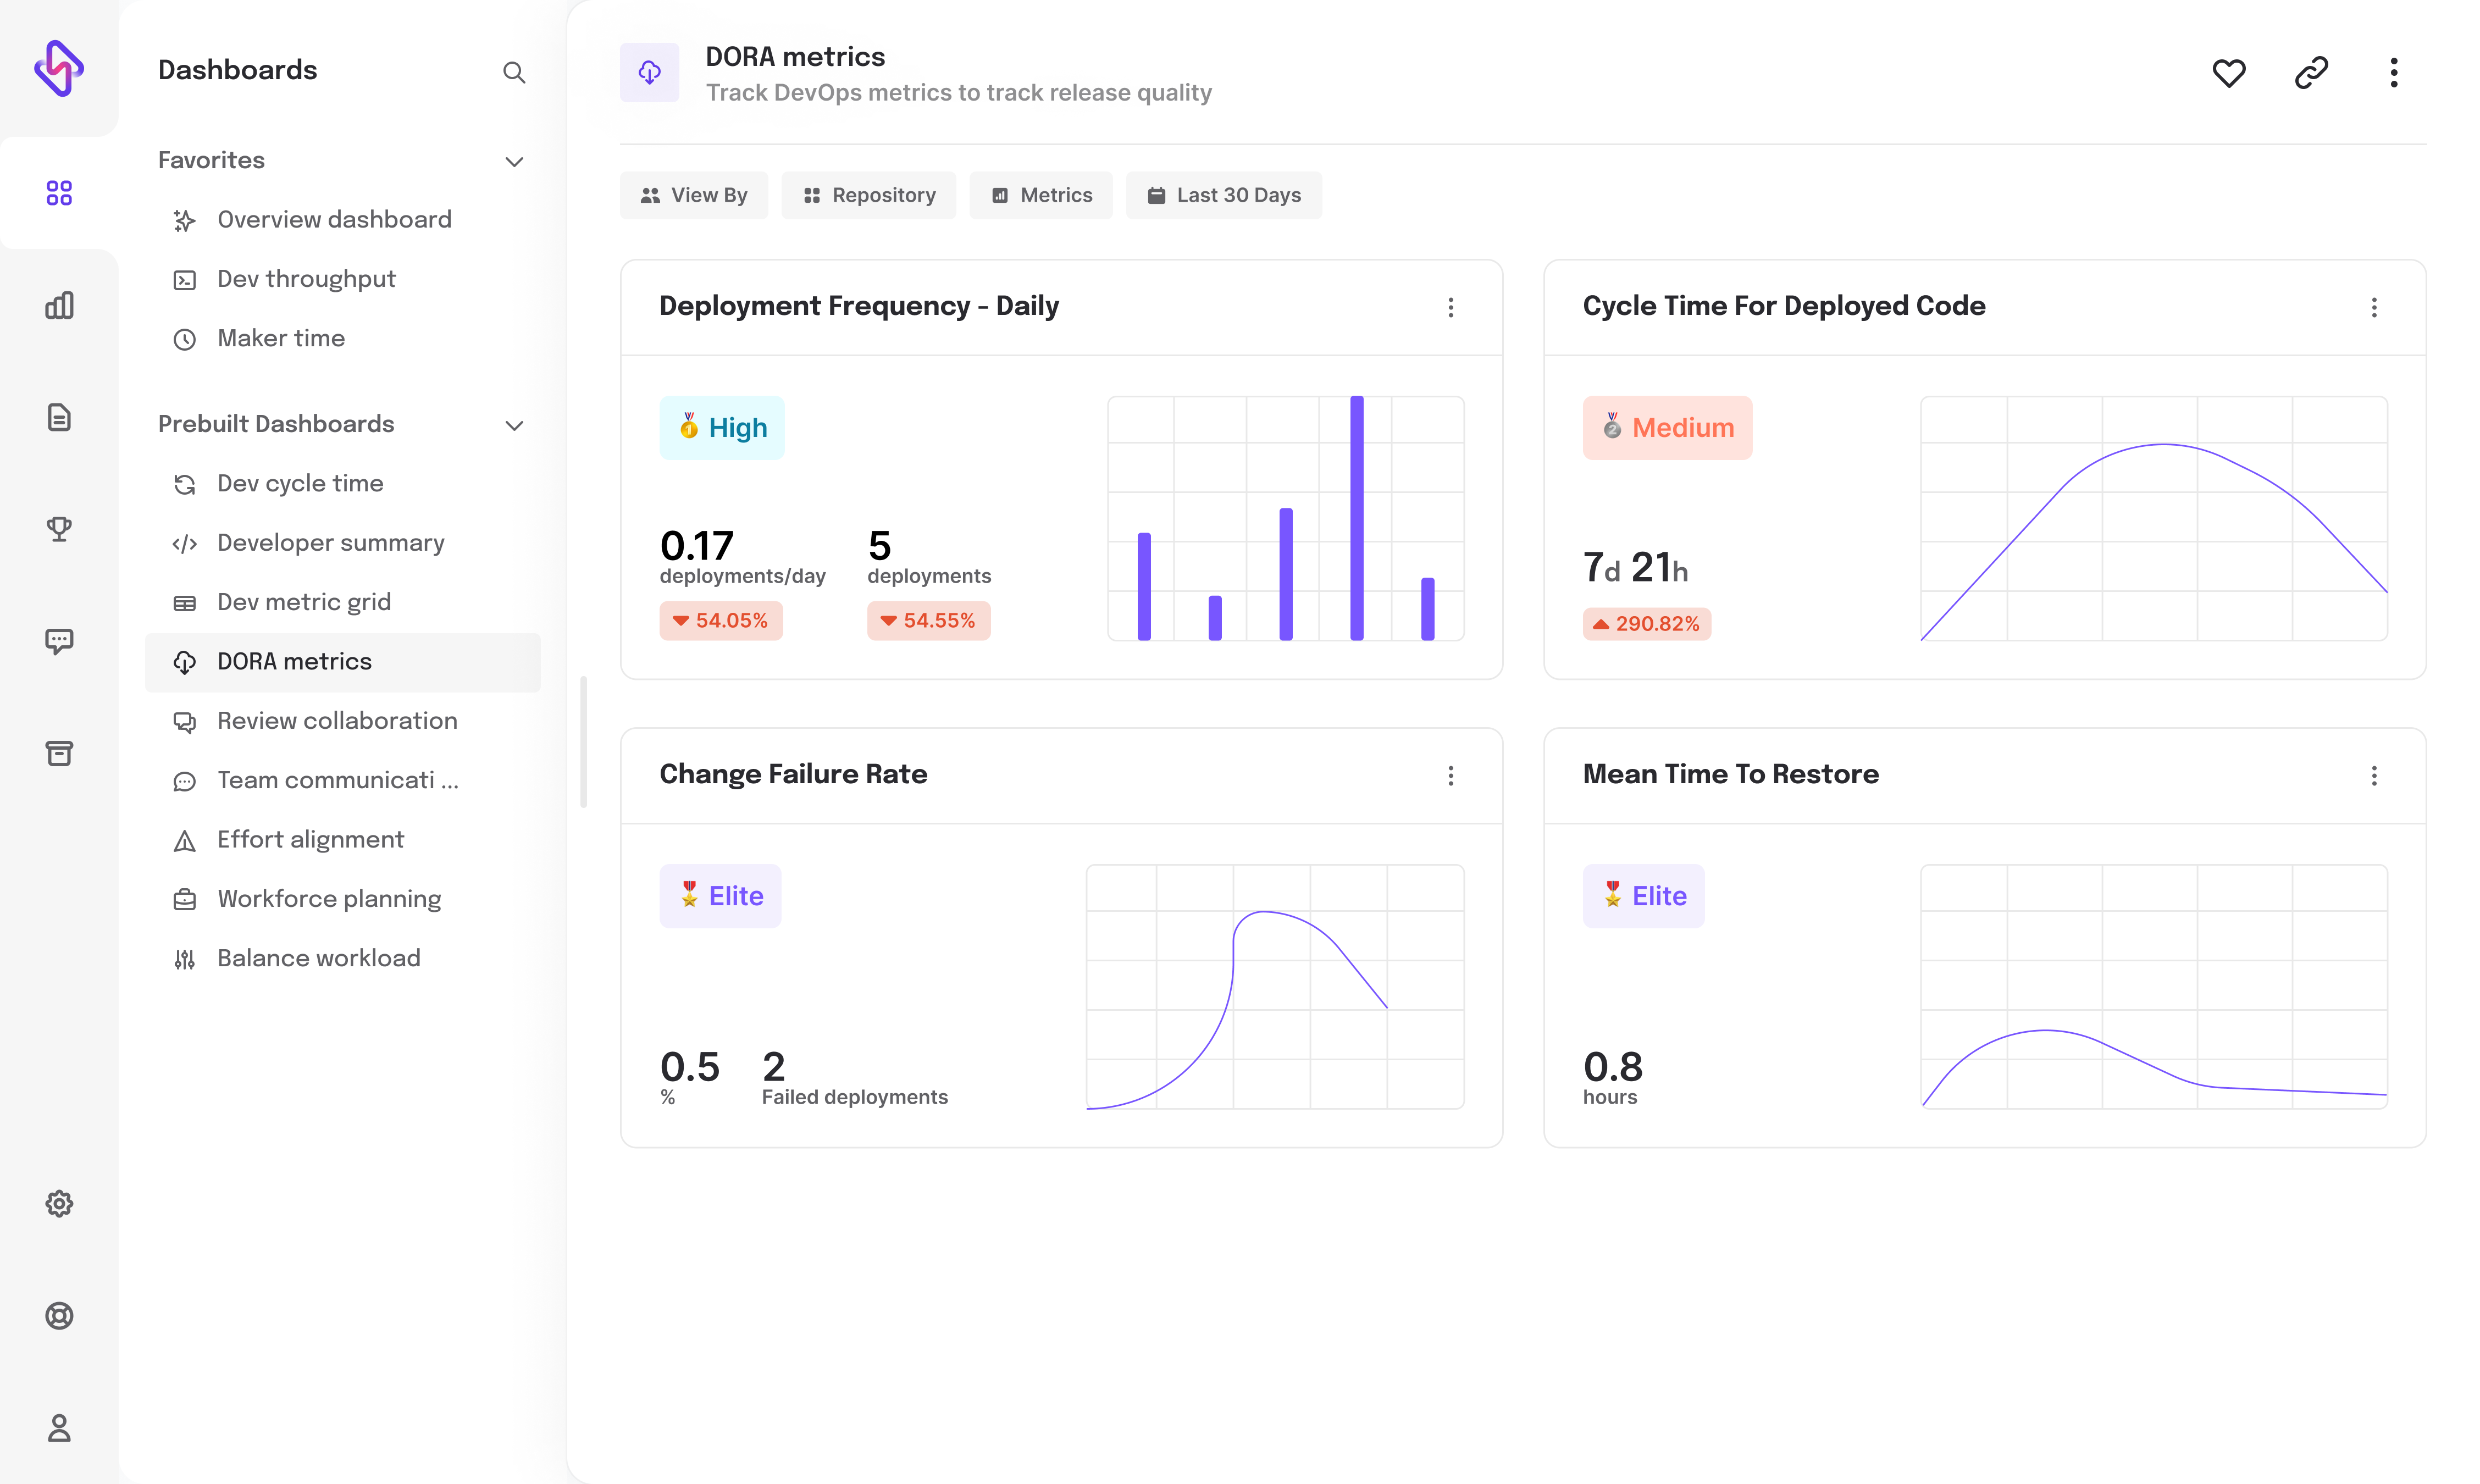
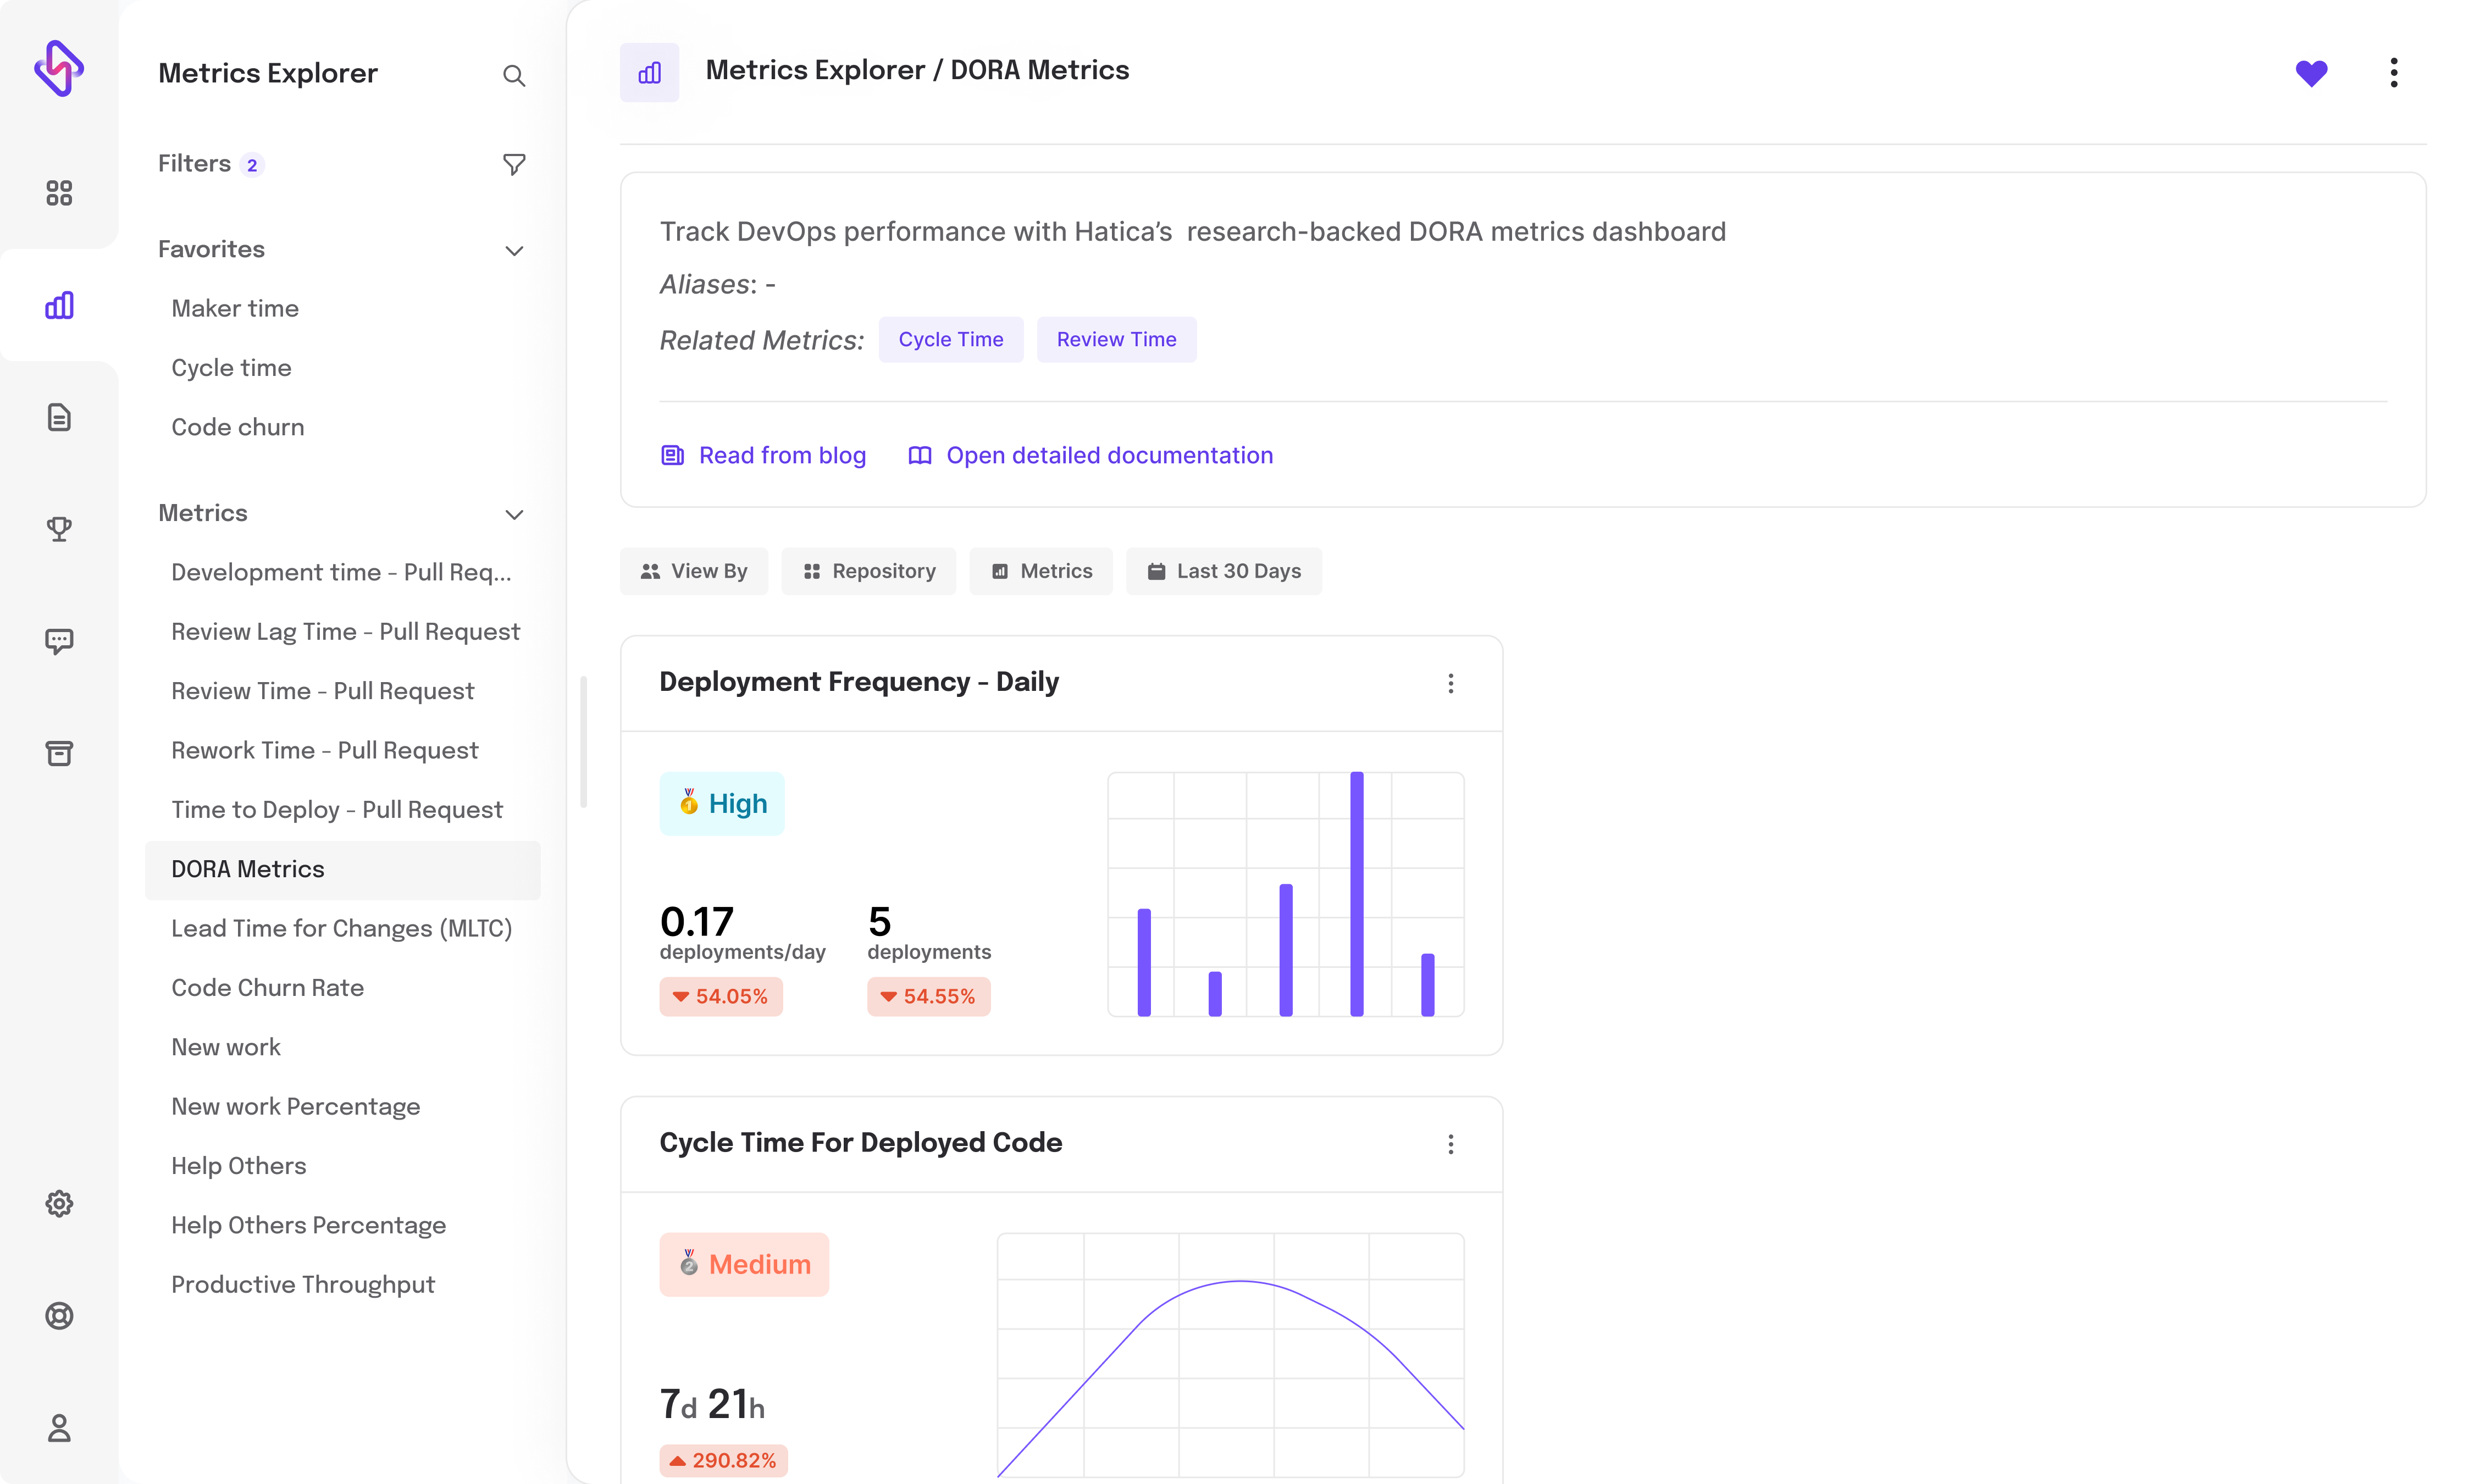
Deployment Frequency
Measure how frequently your engineering teams release a feature or fix.Benchmark the development frequency to get more actionable feedback.
Change Failure Rate
Keep track of how frequently deployments result in a drop in service quality, requiring patches or hotfixes as corrective actions.High Change failure rate is commonly identified among the top factors that degrades developer productivity.
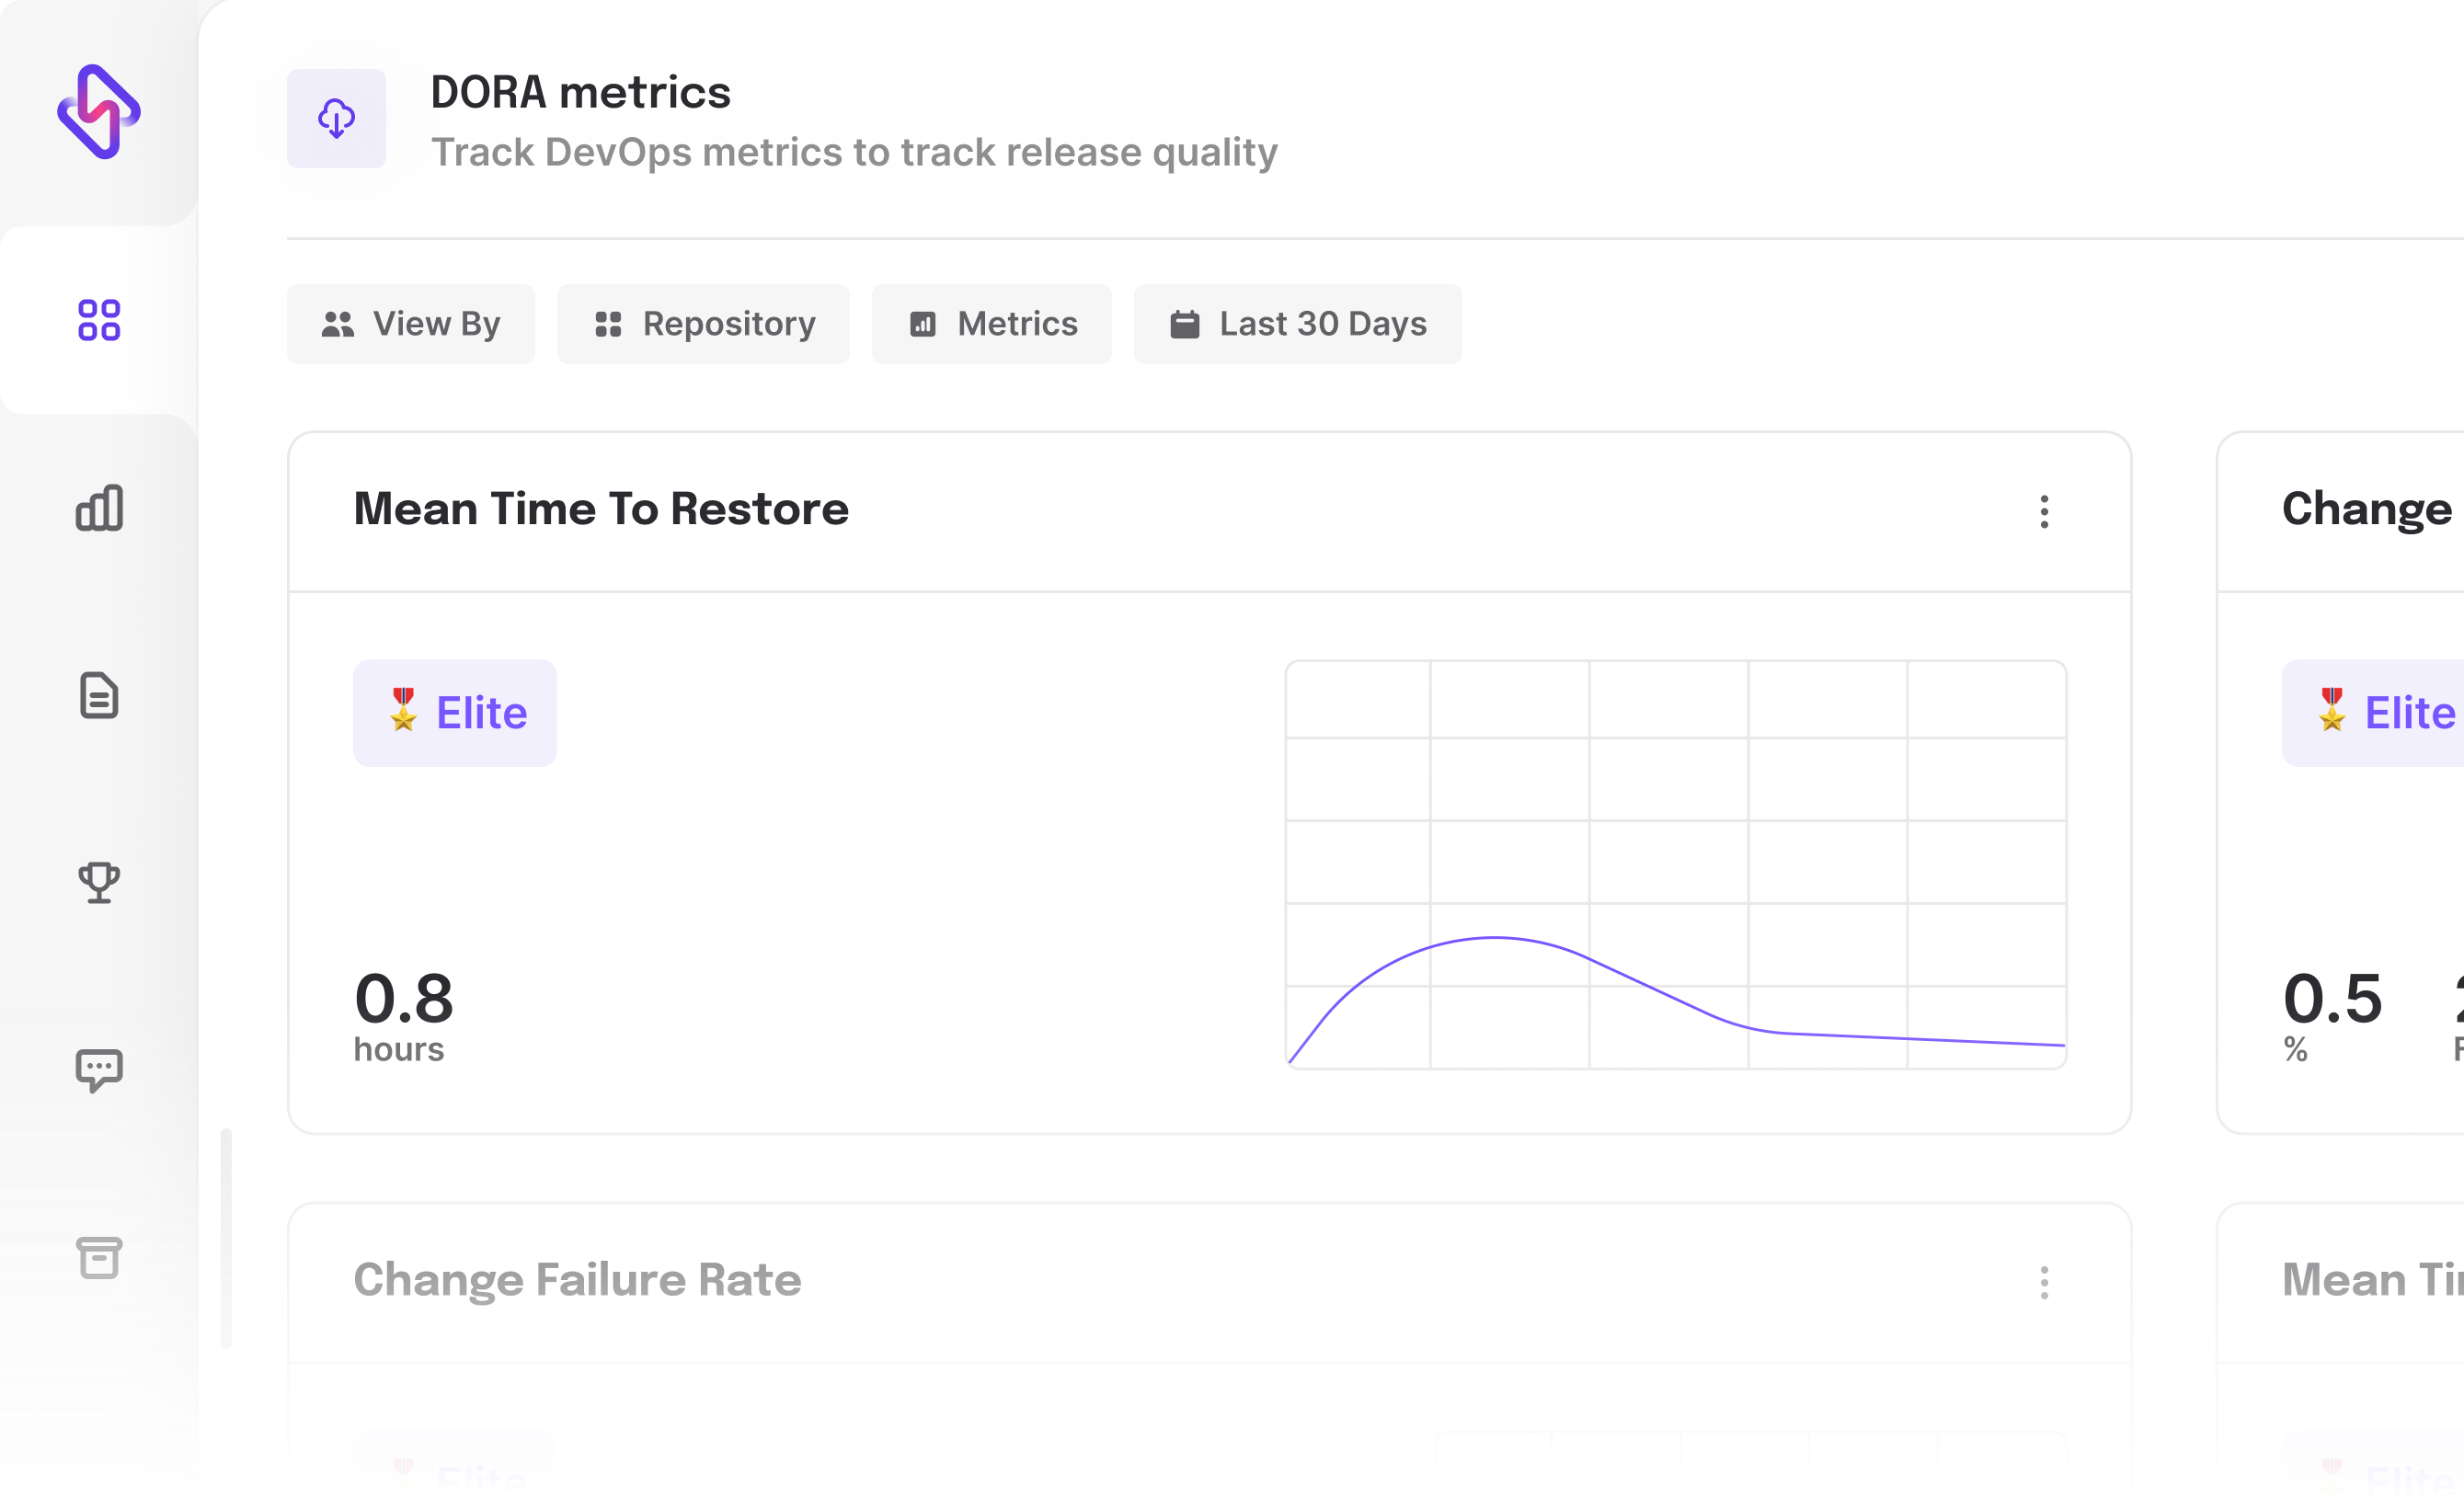
Mean Time To Restore or MTTR
The time taken to restore a service incident, a defect or a degraded service that impacts users is quantified into MTTR.
Its a key metric as it helps:
- Understand the risk taken with each release
- Gain clarity on the time taken to fix outages and defects
Comprehensive work visibility
so you can base your decisions on the whole picture
Complement cycle time with 70+ software engineering metrics to get the full picture of developer productivity and well-being to help your teams achieve excellence.
- Cycle time
- Effort allocation metrics
- Code quality metrics
- DORA metrics ...and more
Ready to dive in? Start your free trial today