Velocity Metrics is not an engineering KPI to help you analyze your engineering team’s performance or efficiency. In fact, anyone attempting to gauge engineering efficiency by looking at Velocity Metrics in isolation may end up with terrible conclusions.
To draw an analogy, analyzing Velocity Metrics for assessing a team's performance would be the same as assessing the quality of the rap lyrics of a rapper by analyzing how many words s/he speaks per minute.
But does that mean velocity is a useless metric?
Nope.
Velocity Metrics is an amazing tool for agile project managers and engineering teams when it is looked at by clubbing with multiple other engineering metrics to assess the health of engineering processes and optimize the same.
Earlier, we had covered in detail the different metrics you need to look at in tandem with velocity to improve your engineering outcomes. In this insight, we explain ‘how to use the Velocity Metrics the right way’.
What are Velocity Metrics?
In simplest terms, Velocity Metrics are a measure of how much work an engineering team can complete in a development cycle, aka iteration, sprint.
How Velocity Metrics Are Measured?
Velocity Metrics are calculated using the story points.
Agile teams, especially those following the Scrum framework, engage in assigning a story point for each of the backlog items (also known as features or Stories). The method they use for estimating the story points may differ depending on what the Agile team finds convenient internally. The three common story points estimation methodologies include—
- Planning Poker
- T-Shirt Sizing
- Bucket System
For Instance, Planning Poker Story Point Estimation Method Involves—
- Team members individually make an estimation for the effort that may go into unit-sized components. Pay attention, it’s effort estimation and not time estimation.
- The effort estimation number usually ranges between 1 to 13 (1 means least effort, and 13 means max effort).
- Individual team members first assign a story point value to each of the backlog items.
- Next, they work together for consensus on what should be the final story point that individual backlog items are worth (as individuals may have estimated different points).
After the story points are frozen for backlog items, a summation of story points is done for all the backlog items planned/completed 100% in one sprint (ideally 2 - 4 weeks).
Velocity Metric Terminologies
- The average of the story points for 2 or more sprint cycles is called the avg Sprint velocity.
- Sprint velocity estimated before actual execution is called Planned sprint velocity.
- Sprint velocity calculated at the end of the Sprint is the Actual sprint velocity.
- The total story points delivered by a team are called Team velocity. Team velocity shouldn’t be confused with team capacity, which is the maximum potential of the team to deliver story points. In the real world, developer burnout, technical debt, dependencies, and resource unavailability translates into lower productivity as compared to capacity.
- The difference between planned sprint velocity and actual sprint velocity is Net velocity.
For Number of sprints (n), Sprint velocity (SV), and Story points (SP):
Avg SV = (SP of Sprint 1 + SP of Sprint 2 + SP of Sprint 3 + … + SP of Sprint n) / n
We have explained in detail about the sprint Velocity Metrics calculation and how you can optimize a team’s sprint velocity using Hatica. Do read that blog.
Here, let’s dive deeper into how you can use Velocity Metrics to add predictability to your project estimations, gain better visibility into your SDLC processes, improve your engineering outcomes, and learn how not to use it the wrong way.
Using Velocity Metrics The Right Way
Only 29% of projects are completed on time. After the ‘requirements analysis phase of the SDLC process, teams are required to do a rough estimation of:
- How much time would it take to deliver the project?
- How much would it cost?
Now, one may think that the net value of story points for the entire features list can be divided by the average sprint time to find out the number of sprints it would take to complete the project. Technically, it sounds correct, but if only things were that simple.
If you look solely at the Velocity Metrics, it will always mislead you. But if you look at it with the burndown charts or burnup charts, cycle time or lead time, and/or cumulative flow diagrams (CFDs), you may gain better insight into the health of your project.
CFD & Velocity Metric To Better Estimate Sprint Timelines
For example, let’s say the actual Velocity Metrics are way too low for the current sprint compared to the average Velocity Metrics. Now, if you look at CFDs (3-column charts — to do, WIP, done) and find out that WIP is unusually large, it means that too many backlog items are being pursued in parallel (not a good practice). If you’re an engineering manager or lead, you can check with the team and help them adopt the right approach to agile development.
Here, you may also need to look at throughput velocity and release velocity to understand if the items in WIP are actually being worked upon or not. And accordingly, looking holistically at throughput velocity, release velocity, CFD, average velocity, and team capacity metrics — you can estimate how soon the sprint will be completed.
Velocity Metrics Can Also Be Used To Adjust Project Scope and Timelines Based On Actual Team Performance.
If your team consistently completes fewer story points than expected, this could indicate that the project scope is too ambitious, or that the timeline needs to be adjusted. By using Velocity Metrics to identify these issues early on, you can help them re-evaluate project scope and timelines, and work with other stakeholders to set realistic expectations for the project.
Using Velocity Metrics To Diagnose SDLC Process Inefficiencies
In a real-world development example, consider if your team is working on a complex software project that requires integrating several different systems. Let’s say, your team lags in the velocity metric for specific stages of the SDLC process i.e., testing, and fixing bugs. After diagnosing the data, the team realizes that there are significant communication gaps between the developers working on different systems, and the QA team. This is leading to inefficient testing scripts, and a lot of bugs are going unnoticed into production, which comes back haunting as technical debt, rework, developer frustration, and project delays.
In this scenario, you can also help the team plan regular check-ins to work collaboratively and embrace modern SDLC paradigms like DevOps-led automation to streamline testing, integration delivery, and deployment (CI/CD) processes for better team efficiency & productivity.
Sprint Velocity Metrics & Developer Velocity
If the individual developer velocity i.e., story points that s/he can complete independently in a sprint for any programmer is less than the estimated velocity, it means the individual is struggling either with the bandwidth/availability challenges (maybe burnout too), or it’s a skill challenge. Accordingly, you may need to improve your resource planning or assess your organization’s learning & development initiatives.
As you would have observed, like body temperature, Velocity Metrics is a signal (symptom) and not a result (KPI) itself. But you can always analyze the velocity variance i.e., velocity metric fluctuations to identify the real problem.
How Not To Use Velocity Metrics?
- Velocity Metrics are not a reflection of a developer or a team’s productivity. In fact, higher velocity doesn’t always mean faster project completion. Bloated velocity could mean low-quality code and bugs being pushed to the repository. Ultimately, this would build up the technical debt and would require a lot of rework in the future.
- A team working on project ‘X’ with a higher velocity metric than a team who is working on a project ‘Y’, doesn’t mean that ‘X’ Dev team is better than the ‘Y’ Dev team. It is possible that Team X are used to working on stories that are more granular than Project Y’s stories, and hence they will have higher velocity.
- Solely using Velocity Metrics for estimating project timelines could be a terrible idea. Historical Velocity Metrics only account for past data. This can lead to inaccurate time estimates.
undefined
- Trying to make sense of the average velocity graph from the very beginning is not a good idea either. Average velocity graphs will be slow at the start of the project. Later, it starts gaining momentum. And a few sprints down the line, there is stability on the average velocity chart. That’s when you can start extracting true value out of it.
What’s next?
Now that you understand how to effectively use Velocity Metrics for doing more realistic project time & resource estimates, and for bridging the SDLC gaps, probably, it’s time for you to put all this into action in your next project.
How?
Say ‘Hi’ to Hatica.
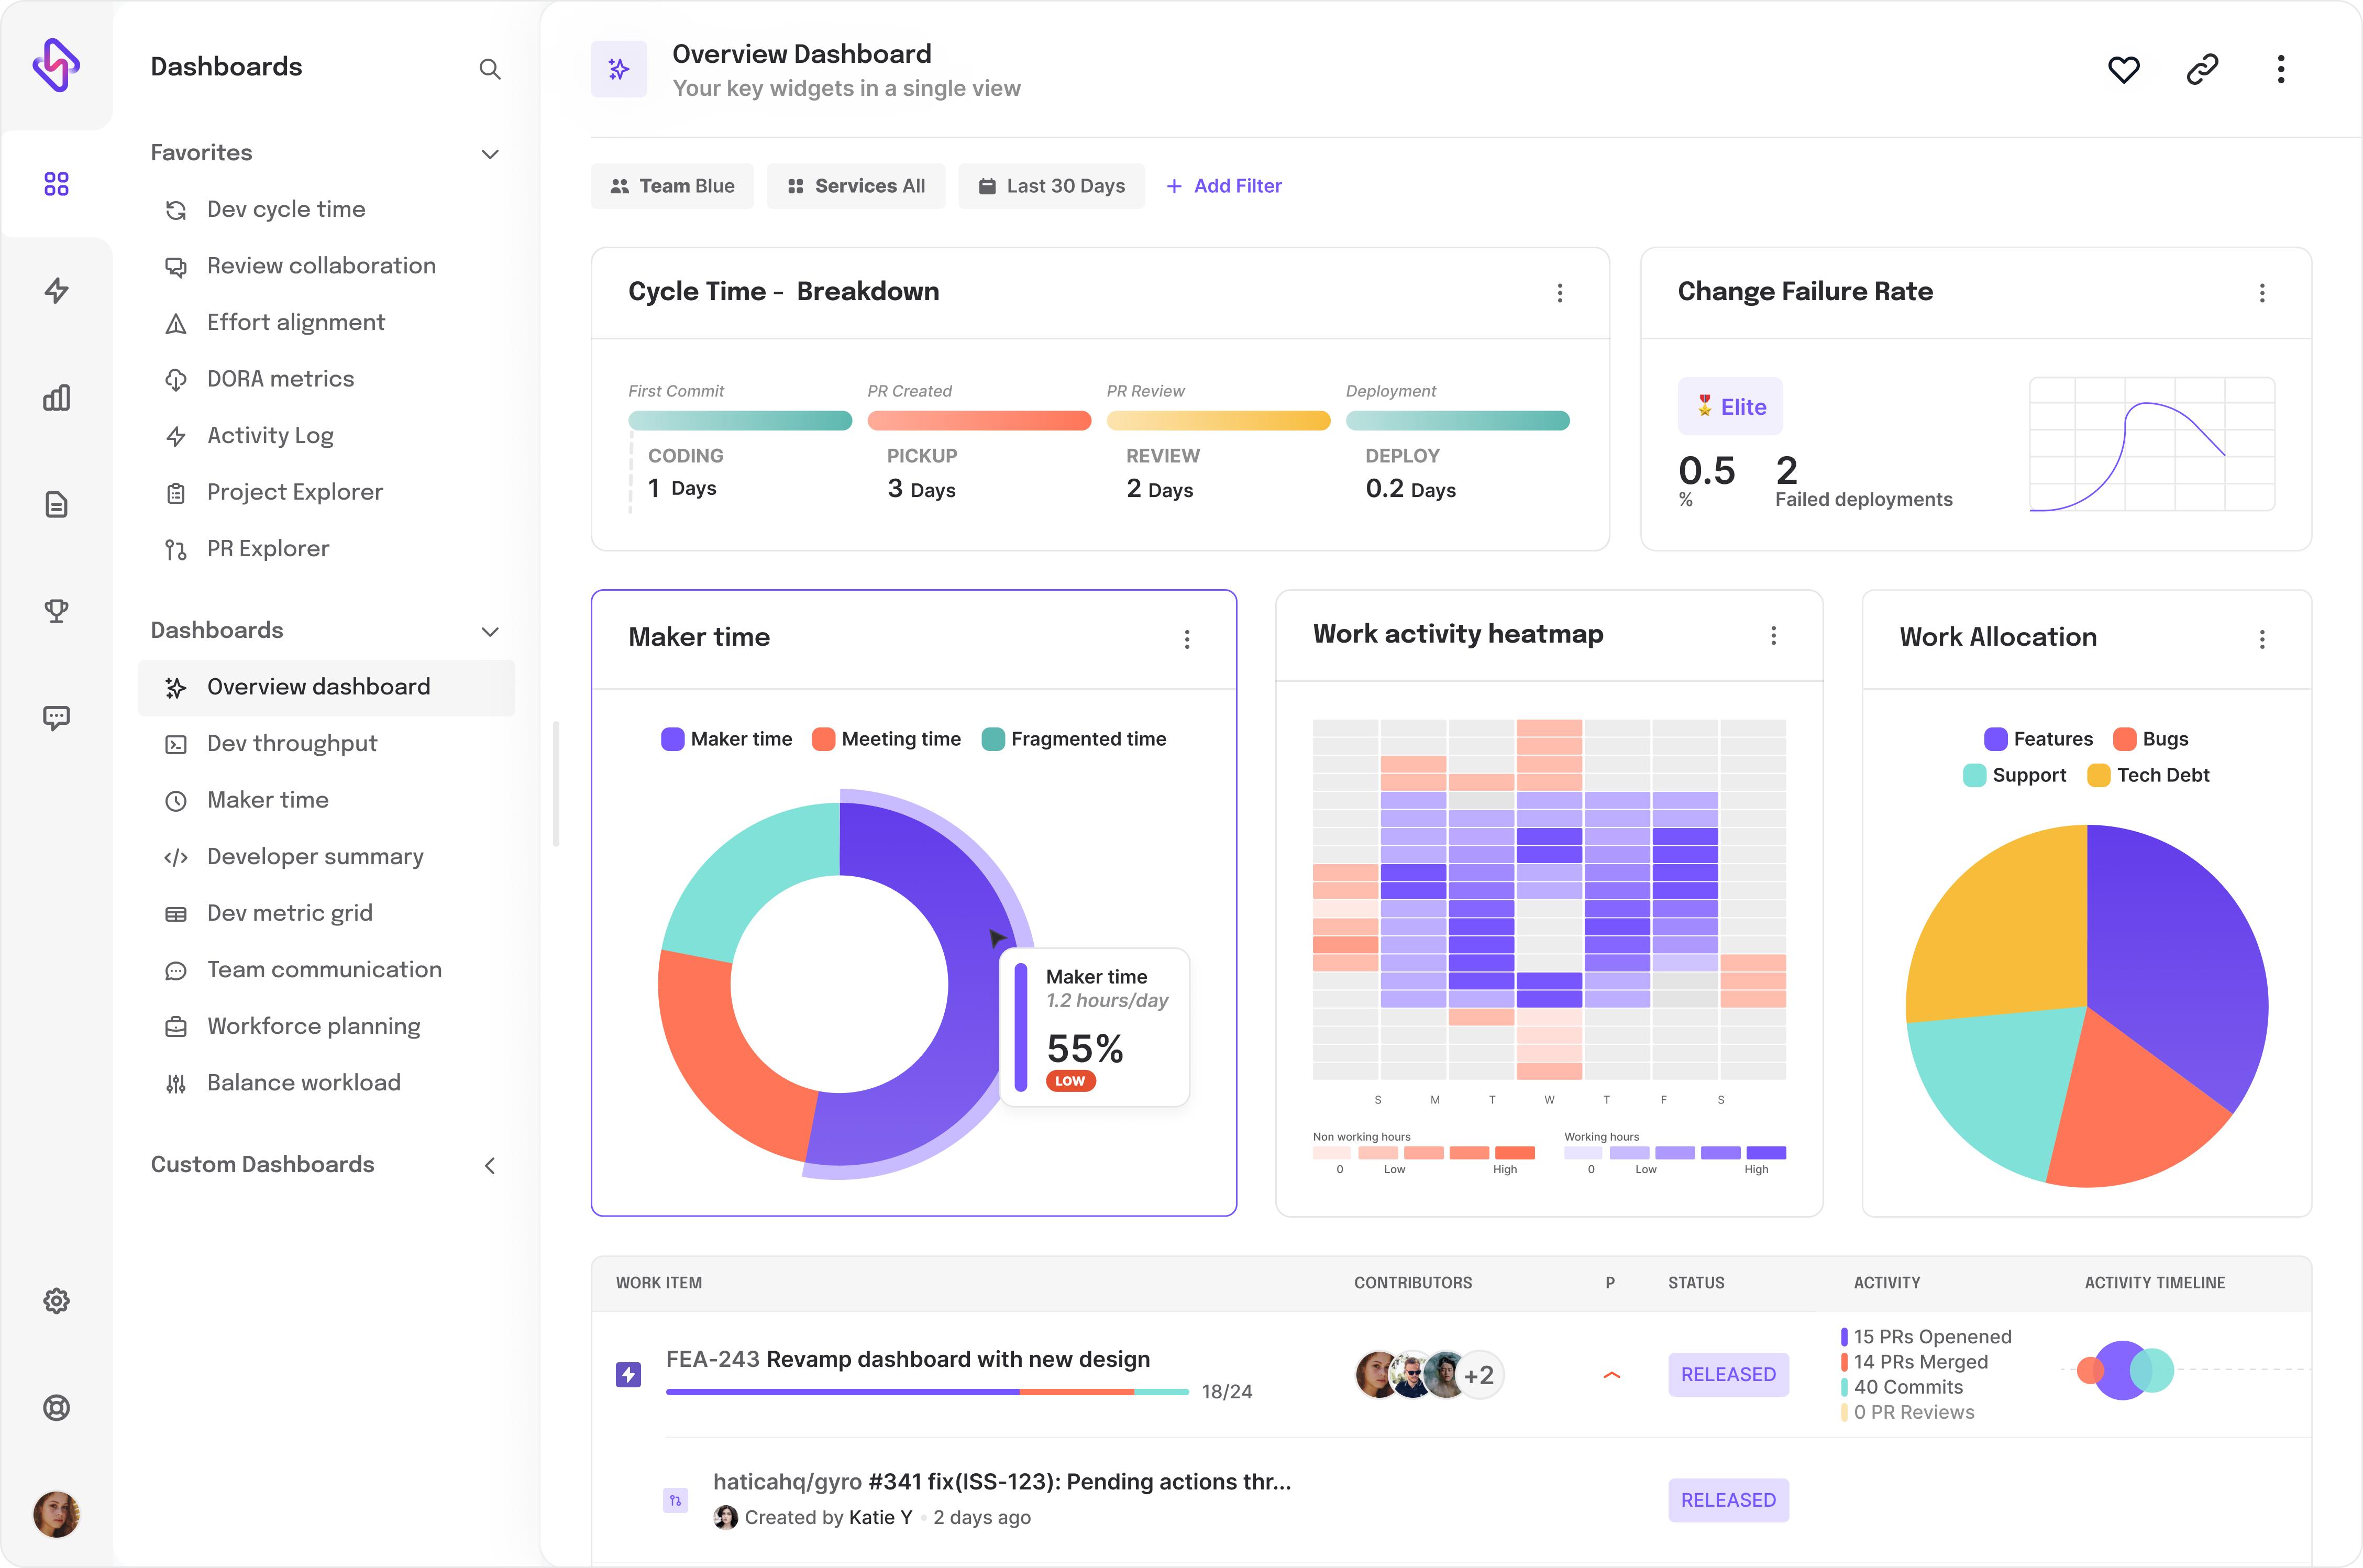
You may add Hatica as your engineering analytics tool to your tech stack. It already integrates with 50+ tools & technologies to pull engineering analytics data from these platforms to help you generate, visualize, and analyze the same with interactive reports, charts, and dashboards.
In short, Hatica helps you to leverage Velocity Metrics in conjunction with other engineering metrics and enables you to—
- Build data-driven high-performing engineering teams.
- Plan data-driven sprints
Keep developing awesome products!