Let’s understand why your Jenkins would be running slow, the pitfalls to avoid, and handling scalability.
Hardware limitations
Jenkins is a resource-intensive tool that requires a lot of CPU, memory, and disk space to operate optimally. If your Jenkins server runs on a low-end machine, it will likely experience slow performance. Allotted memory recommendation starts from 200MB for small installations and above. A single node connection takes about 3 threads of memory, about 2 MB.
Plugin overload
Jenkins's vast plugin ecosystem adds a lot of functionality to the platform, but it can also slow it down. Having too many, or non-performant plugins can greatly reduce your Jenkins performance.
Large build logs
During the build process, Jenkins generates a lot of logs, which can quickly accumulate and take up valuable disk space. Over time, these logs can slow down Jenkins' performance and cause it to crash.
Network latency
If your Jenkins server is hosted on a remote machine, network latency can be a significant factor in its performance. Slow network connections can cause builds to take longer to complete, leading to frustration and lost productivity.
Poorly optimized builds
Jenkins is only as fast as the code it's building, and if your builds are poorly optimized, they will take longer to complete, causing Jenkins to run slowly.
Handling Scalability with Jenkins
Scalability becomes a need as the size of your architecture grows. Jenkins offers vertical and horizontal scalability. Vertical scalability involves having a controller load increased by introducing one or more configured jobs or pipeline builds on that single controller.
Horizontal scalability involves adding more Jenkins controllers to support new teams, pipeline builds, or projects instead of adding new teams or projects to an existing controller.
Here's how to achieve effective scalability with Jenkins:
Effective Communication
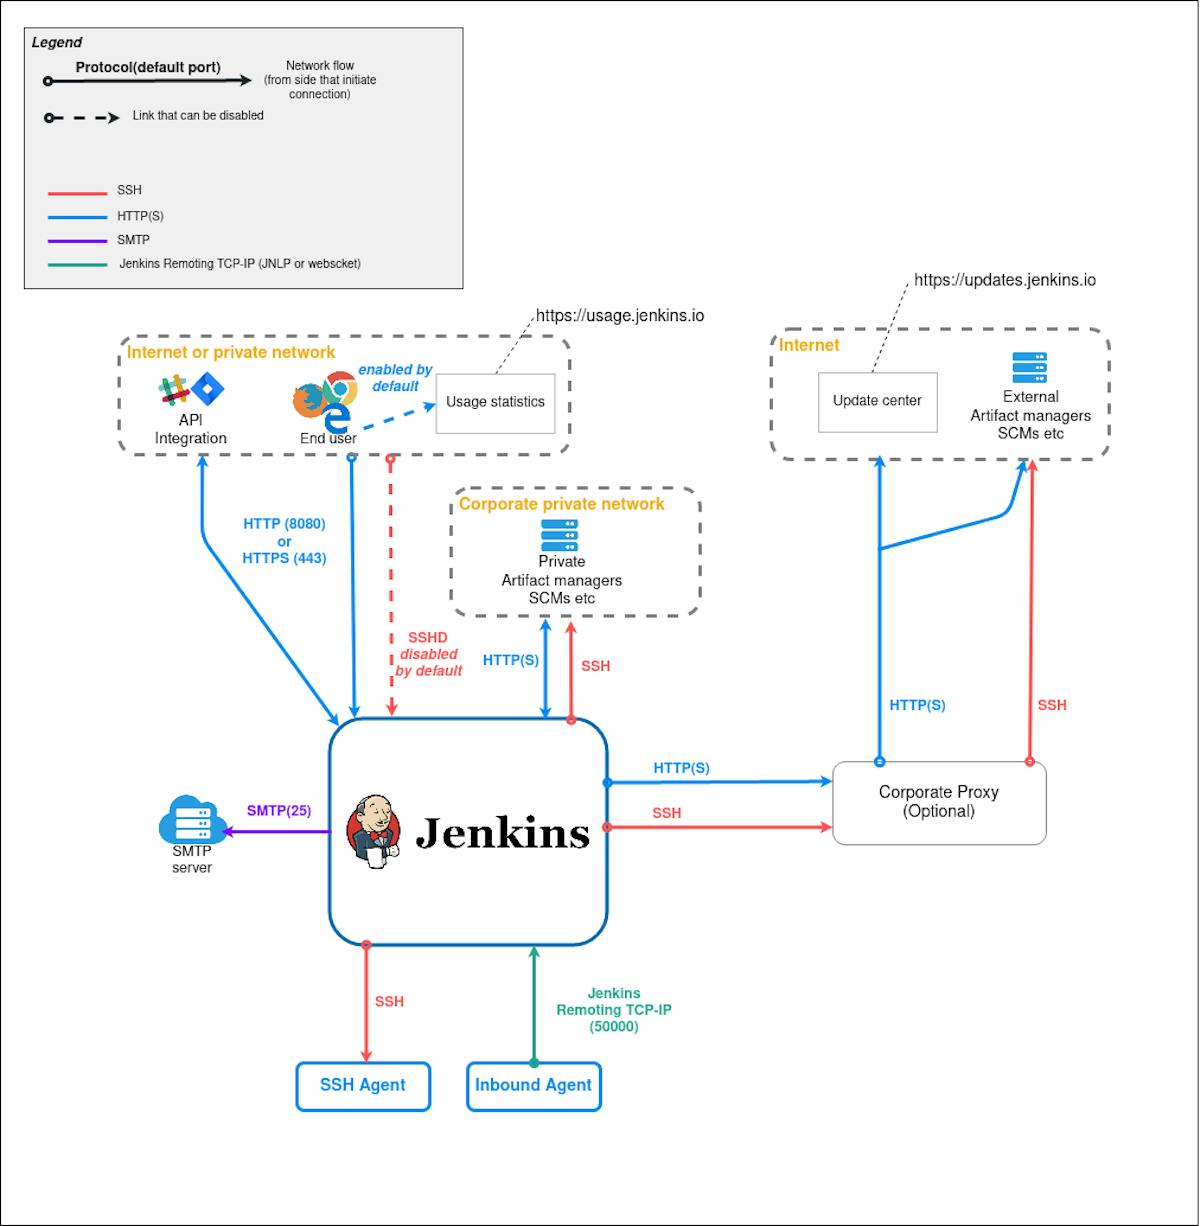
In configuring a build environment, Jenkins manages the resources and requests builds. Horizontally scaling allows the Jenkins installation to host different projects and environments, for effective communication, the host machine needs to run an asynchronous mode of communication that’s bi-directional with the Jenkins controller.
Use a dedicated machine
To ensure that Jenkins has the resources it needs to operate optimally, run it on a reliable machine that meets the minimum hardware requirements. This will prevent other applications from competing for resources and slowing Jenkins down.
Limit plugins
Only install the plugins essential to your workflows and avoid installing any that you don't need. Additionally, regularly review your installed plugins and remove any that you're no longer using.
Archive old build logs
Configure Jenkins to automatically archive old build logs and delete any that are no longer needed. This will help to free up valuable disk space and improve Jenkins' performance.
Optimize network connections
If you're running Jenkins on a remote machine, ensure that you have a fast and stable network connection. Use tools like traceroute and ping to identify any network latency issues and work with your network administrator to resolve them.
Optimize builds
Ensure that your builds are optimized for speed by following best practices for coding and testing. Use tools like caching and parallelization to speed up build times and reduce the strain on Jenkins.
Conclusion
If you're experiencing slow Jenkins performance, there are several tools and techniques that you can use to diagnose the issue.
Here are some of the most effective tips:
- Monitor server resources: Use tools like top, htop, and iostat to monitor your server's CPU, memory, and disk usage. This will help you to identify any bottlenecks and determine whether your server is adequately provisioned.
- Use Jenkins built-in tools: Jenkins has several built-in tools for diagnosing performance issues, including the Performance Plugin and the Thread Dump Analyzer Plugin. Use these tools to identify slow-running builds and bottlenecks in your pipelines.
- Check the Jenkins logs: Jenkins logs contain valuable information about the platform's performance and can help you to identify issues with plugins, builds, and network connections. Use tools like grep and tail to search and analyze your Jenkins.
TL;DR
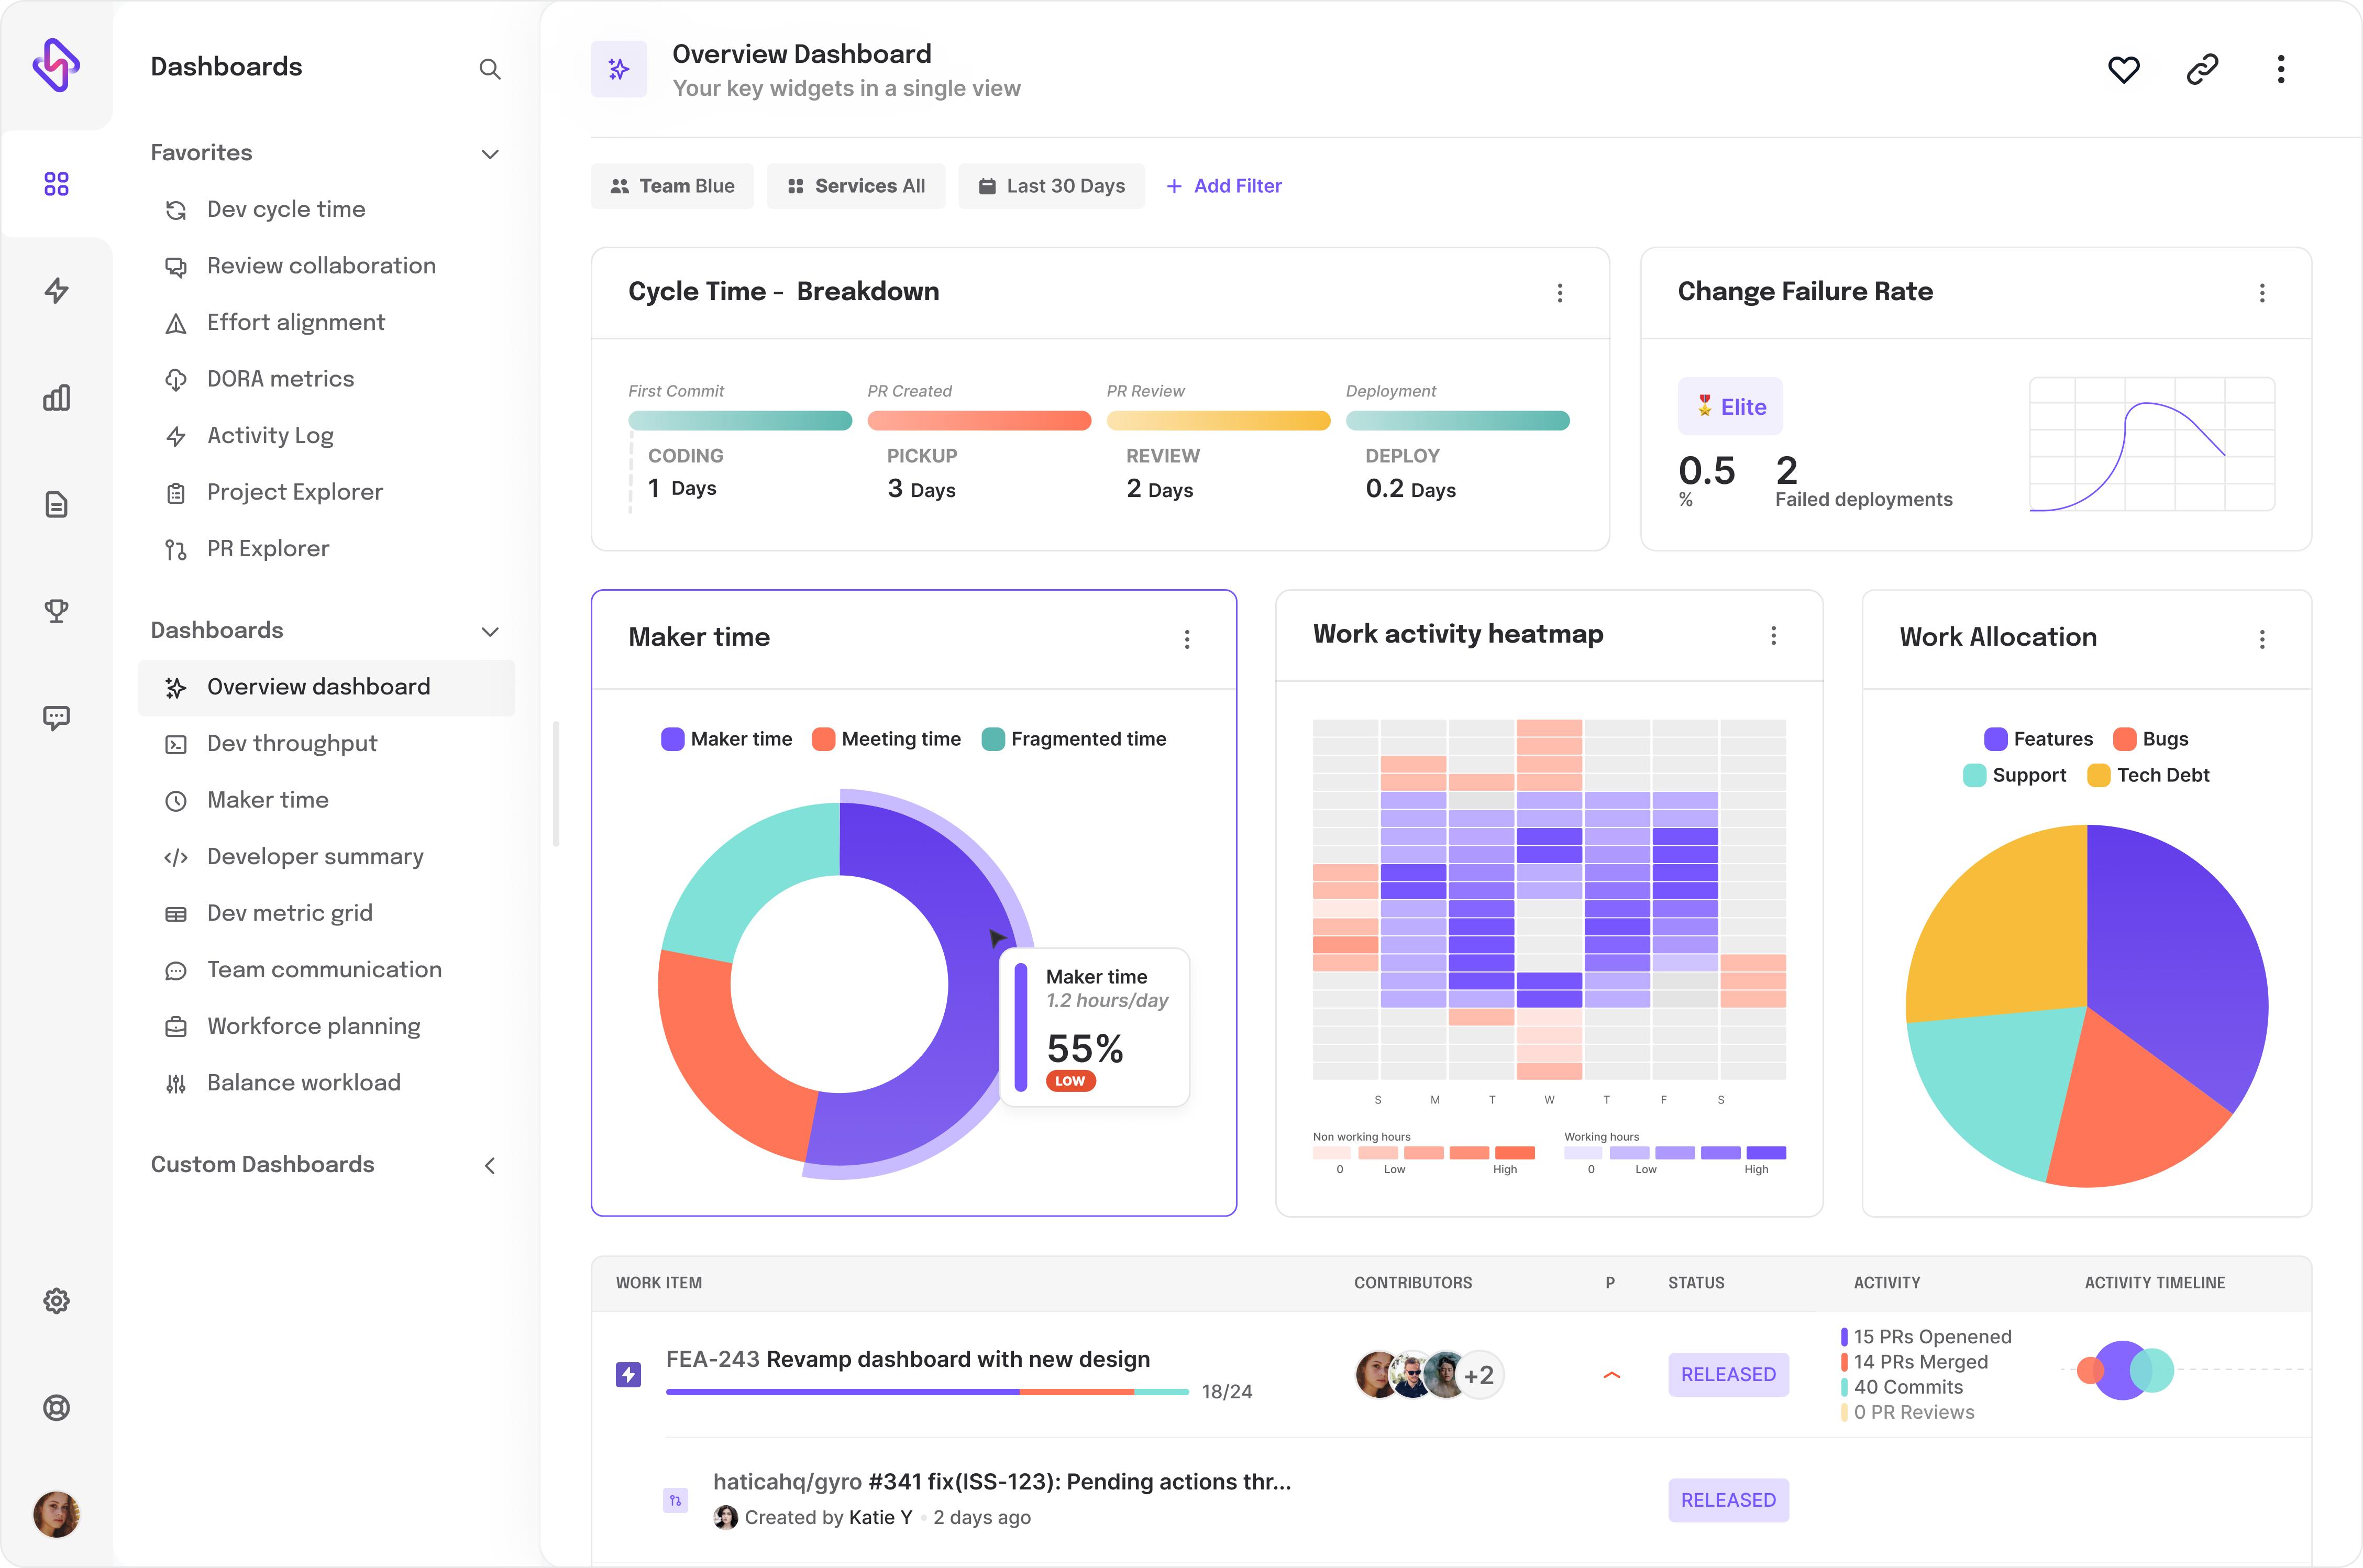
To make the most of your Jenkins, an engineering analytics tool is the need of the hour. Hatica offers metrics across 13 dashboards, powered by CI/CD tools, Jira, Asana, Trello, Jenkins, and GitHub. By collating tool activities at one place, Hatica helps teams streamline their workflow, cut through the clutter of unwanted alerts, and improve productivity.
Subscribe to the Hatica blog today to read more about unblocking developers, and boosting productivity with engineering analytics.