[

🎉

G2 Winter 2024 Report] Hatica Recognized as Momentum Leader with Best Estimated ROI!Read More ->

How to Use Cycle Time Metrics to Improve Dev Velocity?

Learn how to optimize cycle time metrics and discover how engineering managers can use the insights from their teams cycle time to improve developer velocity.
Improve your dev velocity using Dev cycle time metrics

In the fast-paced world of software development, maximizing productivity and efficiency is crucial. One metric that can greatly contribute to improving development velocity is cycle time. Cycle time measures the time it takes for a work item to move from one stage of the development process to another. By analyzing and optimizing cycle time, teams can identify bottlenecks, streamline processes, and ultimately deliver software faster.

In this blog post, we will explore the concept of cycle time and its significance in development velocity and provide practical tips on how to leverage it to enhance your team's productivity.

What is Cycle Time Metric?

Software development cycle time refers to the time taken from the first commit of a PR to its deployment. It indicates the amount of time between the start of a task/work and when it is delivered. The cycle time metric can be broken down into four components: 

  1. Coding time is the time taken between an engineer’s first commit and when a Pull Request (or PR for short) is created.
  2. Pickup time is the time between when a PR is created and when the PR receives its first review.
  3. Review time is the time it takes from when a PR receives its first review and when it is approved.
  4. Deploy time is the time between when a PR is approved and when it is deployed.
Dev cycle time breakdown from Hatica

Essentially, the cycle time metric is a team and project metric that can be used to gauge the delivery velocity of a team. As it measures the time taken to complete a particular dev task it can serve as an indicator of a team’s process speed and efficiency. 

How to Use the Cycle Time Metric?

Cycle time, the lagging indicator, can be an invaluable tool for managers to identify where their team’s bottlenecks lie and more importantly, identify what issues are causing the high values. Let’s breakdown cycle time into its four components and look at some common causes, effects, and solutions to preserve optimum values in each component:  

1. High Coding Time

Coding Time is defined as the time taken from the first commit made to a branch to when a PR is created. Using Hatica’s cycle time dashboard that integrates version control tools (Gitlab, Github, etc.) and project management tools (Jira, Notion, etc.), teams can measure coding time. The ability to measure coding time allows us to identify why the value might be high and how to combat it.

Causes for High Coding Time

  1. Issues with the codebase: When the code quality of the codebase is low, it leads to authors having to make changes to it. This can lead to an increase in the coding time for the whole team. In instances when contributors are unfamiliar with the codebase, the time to code increases, accounting for learning and errors.
  2. Poorly specced tasks and changing requirements lead to authors requesting for more information and updates from the product or design teams while in the middle of creating new code or changes. This can lead to authors creating draft PRs which increases overall coding time. 
  3. Large tasks mean that developers have to make large, widespread changes and a large number of commits on a branch across a codebase to fulfill the requirements of the task. 
  4. Overwork and burnout: When too many tasks are assigned to a developer, it can put multiple WIP tasks in their sprint. Multiple PRs in progress for developers in a team lead to increased cycle time.
Review collaboration dashboard from Hatica

Solution for High Cycle Time

💡Addressing the issue of large PR sizes using quantitative metrics about batch sizes can help reduce PR size and task sizes. Team discussions and feedback during retros can be used to develop better workflows to break down PR sizes that enable teams to merge code at a consistent pace. 

💡Managers can use metrics such as average active PRs per author to avoid overwork and to better allocate tasks. 

đź’ˇUnderstanding the PRD to understand the the complexity and scope of new work along with potential risks can help managers spec clear tasks and allocate the right resources to each task.

2. High Pickup Time

Pickup time is the time between when a PR is created and when the PR receives its first review.

Causes for High Pickup Time

Lengthy PR Pickup times indicate potential bottlenecks in the development process and are often a result of: 

  1. Low involvement of the team, when only a small fraction of the team does code reviews when compared to the fraction writing code.
  2. Large Pull Requests (measured as lines of code): Reviewers prefer to do smaller code reviews since a) more effective reviews can be provided 2) engineers tend to fill small slots between subsequent tasks or meetings to do code reviews and thus tend to skip over reviews that would take longer than the 10 min slots. Thus, when a PR review is too large to fit into a small time slot, they end up staying in the queue for a longer time. 
  3. Timezone of authors: Remote team members in hybrid teams might be at a disadvantage since they do not have the ability to easily nudge their co-located team members to give them a review. Developers in a one-timezone author code and wait for reviews from a reviewer who is off work in a distant timezone.
  4. Long CI time (or) flaky builds/tests: Authors might be quick to create code but if they have to wait hours for automated tests or builds to pass to be able to get a stamp of approval by the machines, it can mean the reviewers will take longer to pick up the PR for code review. A worse scenario is when the tests are flaky and need to retrigger tests again and again to pass, causing dissatisfaction and inefficiency.

Solution for High Pickup Time

đź’ˇMeasure PR Pickup Time trends along with metrics like PR size, comment activity on reviews, etc., to understand review metrics and review quality. Managers can use insights from PR metrics and trends to create goals that can improve the code review process and thus optimize cycle time.

Hatica Goals

💡Invest in infrastructure to facilitate faster and more stable builds. Modern testing tools such as the test-at-scale product by Lambdatest are equipped with the intelligence to run only the impacted tests and not the whole test suite, thereby greatly reducing a developer’s waiting time. 

3. High Rework Time

Rework time is the time taken for a developer to delete or rewrite their code shortly after it has been composed, after a PR review. When it comes to rework time, high is not necessarily bad because when PRs receive high-quality code reviews, they inevitably lead to higher rework. However, when rework time is too high for your team’s benchmarks, it can be an indicator of issues. So what should managers do?

Solution for High Rework Time

  1. Look at the response time of reviews which measures the average time it takes for your reviewers and authors to respond to comments. Your pickup time (first review) might be quick but its often that the authors and the reviewers take long to respond to review comments thus increasing the time it takes to get the code approved. 
  2. Look at the rejection rate of your PRs - how often are PRs not approved in the first review? On the flipside when you have a 100% approval rate, it can also be an issue, especially in large teams, since it can be an indicator of low-quality reviews.
  3. Note if your teams’ tasks are well-specced and monitor to see if rejection rate is high. These can happen often due to tasks being poorly defined without adequate input from the project teams, leading to developers having to make changes to accommodate a different requirement. 
  4. Integrate automatic checks like static code analysis and linting so that reviewers don't need to spend time on nit pics that could be easily caught by machines.

4. Time to Deployment

Deploy time is the time between when a PR is approved and when it is deployed. Obviously, teams generally prefer low deployment time. This metric corresponds to DORA metrics that can be used to identify opportunities for process improvement. This metric is critical since productivity is all about deployed code - if a code is not deployed then effectively, the output is nil for that effort.

It’s important to note that time to deploy cannot be measured using fixed thresholds since the value would differ based on the kind of service/project under question. For instance, mobile apps will have releases further apart than a micro service which might have more frequent releases. Hence it’s important to identify the right benchmarks for each deployment. 

Generally, the time to deploy is higher than the benchmark if there is a long wait time or flaky builds in CI/CD that delay merges. At other times, when a PR needs multiple or slow tests before deployment, it can lead to increased time to deploy.  

Deployment frequency (DORA metric) is the frequency with which a team pushes changes to production.  Managers can ensure better productivity by structuring team workflows to allow them to ship smaller, more frequent deployments, thereby optimizing time to deployment, lowering risks, and providing better customer benefits. 

How Does the Cycle Time Metric Help Dev Managers?

The primary purpose of the cycle time metric is to help dev teams identify blockers in the team workflow in order to help them speed up their delivery. As a lagging indicator, i.e., a metric that confirms patterns that are in progress, the cycle time metric can be used as a signal of underlying issues in an engineering team’s workflow. Thus, along with related metrics, it can be used to do a root cause analysis as to why the team faces process issues. (Read on for more details)  

High cycle time has wide-ranging consequences and manifests across the project management lifecycle. For instance, healthy or optimum cycle time has a tremendous impact on the productivity of the project management lifecycle.

Stale PRs and branches

High cycle time caused by high time to review and rework can lead to authors and reviewers losing context to their work. This can result in stale tasks and production issues. Stale PRs also hurt productivity and workflows since they often result in huge merge conflicts that are difficult to resolve. Oftentimes, the merge conflicts are a result of multiple other code changes and when the code merge isn’t done well, this can lead to bugs in the product. Hence, when managers are able to preserve a healthy cycle time, they can prevent stale PRs and branches and protect the quality of their team’s work and productivity.

Developer Experience

When authors have to wait too long to get code reviews or when they don’t get quality reviews or get a constant rejection from reviewers, cycle time spikes, severely hurting the developer experience.

Workload Balance

High cycle time manifests as teams not meeting their promised goals in sprints - say you run weekly sprints, if your cycle time average is not less than 4 days, you will most likely end up with a large number of spillover tasks since all tasks would get closed towards the end of the sprint while the rest will spillover. Spillover tasks cause a cascading effect on individual and team productivity and ability to deliver. Keeping healthy cycle time automatically leads to better workload balance in multiple ways; It encourages more people involved in code reviews to keep the pickup time low, and managers are enabled to assign tasks better in their sprints to keep spillover of tasks to a minimum.

Healthy Thresholds for Efficient Workflows

Although thresholds depend on workflows and the nature of the projects, whether mobile or a microservice, and/or the repo, the overall cycle time including optimum target times for coding to merge time are generally similar across project types.

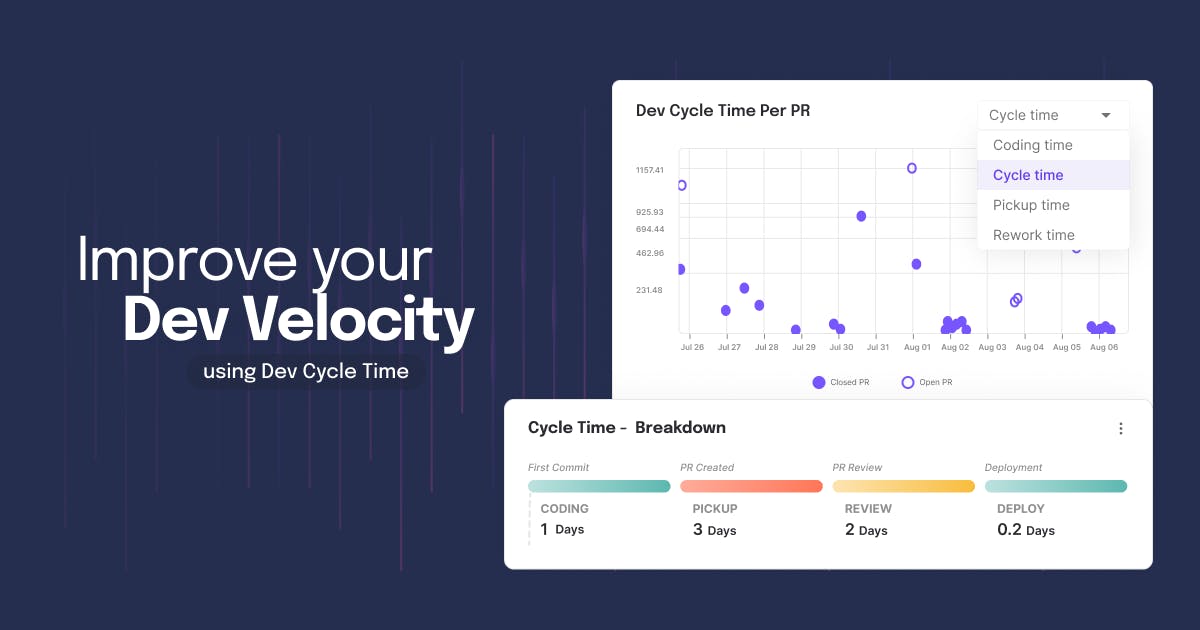
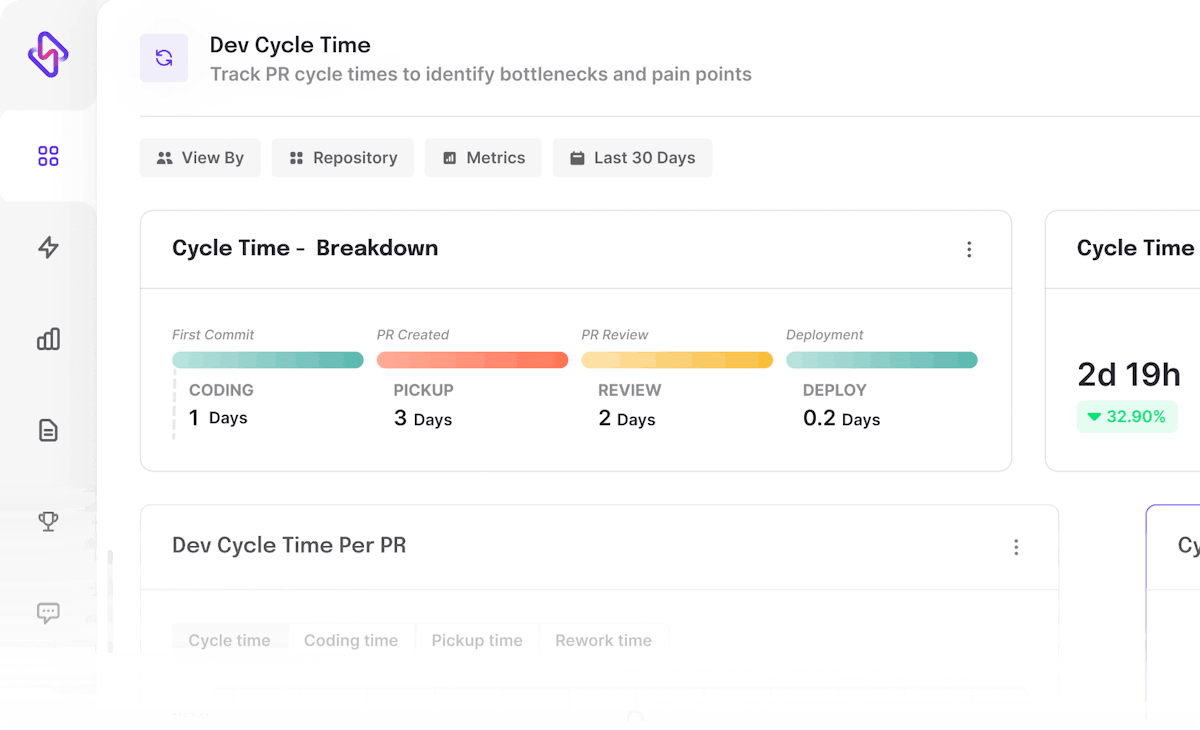
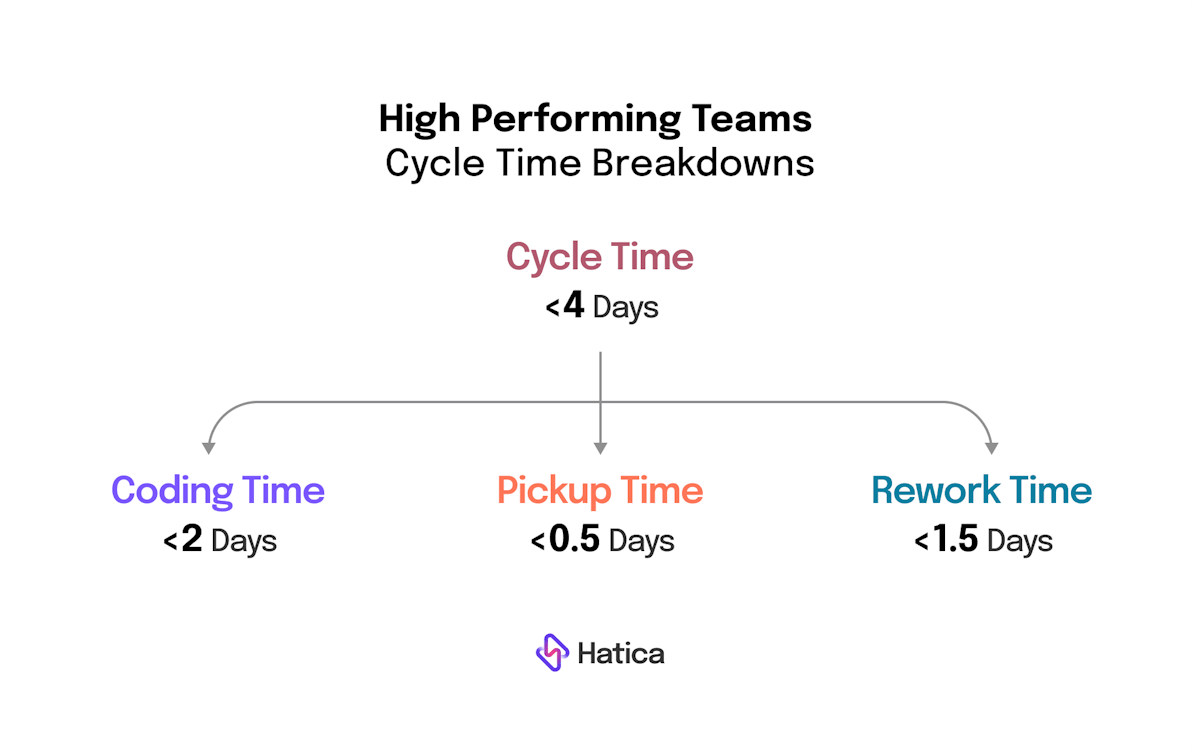
For most high-performing teams, Cycle time is less than 4 days. For these teams, the breakdown average ranges are:

Coding time <2 days

Pickup time <0.5 days

Rework time <1.5 days

The time to deploy remains specific and highly dependent on the kind of project or repository. Here, the average ranges for mobile are less frequent (from 1 to 4 weeks for consumer apps on average) while for active microservices they tend to be daily. 

A trusted source for benchmarking time to deploy is the deployment frequency thresholds in DORA metrics as suggested by the Accelerate DORA actors themselves. More on this, here.

High performing teams cycle time

What it is not

It is essential for engineering managers and leaders to stay conscious of the fact that cycle time is not an individual metric. Rather, it is a team and project-level metric that highlights a team’s delivery cadence and helps maintain stable efficiency metrics. Thus, cycle time is not an indicator of the quantum of output but the speed of output, and hence when managers optimize their team’s cycle time they are able to optimize their team’s ability to deliver, thereby improving their dev velocity. 

Gotchas

Here are some heuristics to watch out for: 

  • While the total cycle time that you should target depends on the type of project, this is mostly because of the deployment time which is based on the release schedule. Without accounting for deployment time, the remaining steps from coding to merging code to the deployment branch remain mostly the same across your teams.
  • If you have a high cycle time and have decided to work on it, the best approach is to take an iterative, continuous improvement path. For example, if your team’s cycle time is currently at 6 days and you would like to bring it down to 3 days, a good starting point would be to first map out which inefficiencies and bottlenecks you would like to address and then aim to bring the high cycle time down by 1 day and then continuously improving performance to achieve the targeted cycle time metric. 
  • Remove outliers when measuring cycle time and thus measure percentile P95s or P90, since there will always be exceptions to rules, particularly in the case of cycle time. 

💡Hatica equips engineering teams with granular visibility into team cycle time alongside 60-plus other metrics enabling them to reduce bottlenecks to accelerated delivery and achieve a better developer experience. Learn how Hatica can help you build better engineering teams. Request a demo →

FAQs

1. What is the Difference Between Cycle Time and Velocity?

Cycle time and velocity are both metrics used in software development, but they measure different aspects of the development process. Cycle time measures the time it takes to complete a single task or cycle, while velocity measures the amount of work completed within a specific period, usually a sprint or iteration. Velocity focuses on the volume of work, whereas cycle time focuses on the duration of individual tasks.

2. Why is Optimizing Cycle Time Important for Efficient Software Delivery?

Optimizing cycle time is important because it directly affects the speed and efficiency of software delivery. By reducing cycle time, you can accelerate the development and delivery of software, enabling faster time-to-market and improved customer satisfaction.

3. How Can Cycle Time Be Used to Improve Dev Velocity?

Cycle time can be used as a valuable metric to identify bottlenecks, inefficiencies, and areas for improvement in the software development process. By analyzing cycle time, teams can identify areas where tasks are taking longer than expected and implement strategies to streamline those tasks. Shortening cycle time can help improve dev velocity by reducing the time it takes to deliver features and enhancing overall productivity.

4. How Can Cycle Time and Velocity Be Used Together for Better Project Management?

Cycle time and velocity can complement each other in project management. By monitoring both metrics, teams can gain a comprehensive understanding of their development process. Cycle time provides insights into individual task durations and helps identify areas for optimization, while velocity indicates the overall team's capacity to deliver work within a given timeframe. By analyzing and comparing these metrics, project managers can make data-driven decisions, set realistic expectations, and optimize resource allocation for better project planning and execution.

Subscribe to Hatica's blog

Get bi-weekly insights straight to your inbox

Share this article:
Table of Contents
  • What is Cycle Time Metric?
  • How to Use the Cycle Time Metric?
  • 1. High Coding Time
  • 2. High Pickup Time
  • 3. High Rework Time
  • 4. Time to Deployment
  • How Does the Cycle Time Metric Help Dev Managers?
  • Stale PRs and branches
  • Developer Experience
  • Workload Balance
  • Healthy Thresholds for Efficient Workflows
  • What it is not
  • Gotchas
  • FAQs
  • 1. What is the Difference Between Cycle Time and Velocity?
  • 2. Why is Optimizing Cycle Time Important for Efficient Software Delivery?
  • 3. How Can Cycle Time Be Used to Improve Dev Velocity?
  • 4. How Can Cycle Time and Velocity Be Used Together for Better Project Management?

Ready to dive in? Start your free trial today

Overview dashboard from Hatica