4 Challenges in Implementing DORA Metrics
The DORA metrics offer data-backed insights into existing and/or desired software delivery performance, equipping organizations with the ability to improve and iterate continuously. Despite the availability of these metrics, most engineering teams still struggle to utilize them effectively, resulting in unnecessary challenges and missed prospects. Here are some of the most common challenges software teams are likely to encounter when using these metrics:
1. Mixing Apples and Oranges: Process vs. Outcome Metrics
DORA metrics come in two flavors: process and outcome. Process metrics zoom in on specific parts of the development cycle, like how long it takes to fix bugs or deploy features. Outcome metrics look at the bigger picture, like customer satisfaction and deployment success. Understanding the difference is crucial to get a clear view of your software delivery process.
For example, "Lead Time for Changes" tracks the time from identifying a change to releasing it, while "Deployment Frequency" looks at how often you deploy. Both assess the DevOps process, but one focuses on speed within a change cycle, and the other on overall release frequency. Teams need to strike a balance – track each metric individually, but also combine them to understand the entire SDLC picture.
2. Focusing on Numbers, Missing the Process
A common pitfall is getting fixated on individual outcomes instead of continuous process improvement. Many teams get caught up in chasing "good" DORA numbers and lose sight of the bigger picture. Instead of just tracking development cycles, consider quality assurance and customer satisfaction to truly understand project performance.
To avoid this, use additional DevOps metrics like code review size, sprint velocity, and developer well-being. DORA provides a piece of the SDLC puzzle, but the rest depends on your team's size, complexities, and product type.
3. Using DORA Without Enough Context
Setting realistic expectations is key when using DORA metrics. Businesses sometimes set reasonable goals for software development but fail to measure progress against them. While DORA engineering metrics help track progress and success, they shouldn't be the only factor.
Consider the "Change Volume Per Day" metric. The number of changes pushed daily is just a surface-level view. The actual quality of changes, time and effort breakdown, and their impact on the system require additional context. Don't chase elite team numbers blindly – each team is different in size, work nature, and product type.
4. Missing Out on Engineering Analytics
Data is only valuable when used with context and clear goals. Numbers don't speak for themselves - they need to be used to define improvement areas and drive action. Data analytics helps teams extract insights from raw data, allowing them to control their process, not the other way around.
Leverage insights from DORA metrics to identify bottlenecks in your SDLC. Use data to make informed decisions and drive improvements in software delivery. Don't forget, that DORA offers a high-level view. For a deeper assessment, consider additional factors like organizational culture, infrastructure complexity, tooling, and team dynamics.
An engineering analytics platform can combine all relevant data into one place, giving teams complete visibility into their DevOps pipeline, blockers, and areas for improvement at both individual and team levels.
Despite these challenges, DORA metrics remain valuable tools. In the next section, we'll explore why DevOps teams still need DORA metrics.
Why Do DevOps Teams Need DORA?
DevOps can feel like a fast-paced race. Each deployment brings new challenges, but many of these issues are similar. A smooth DevOps pipeline with good team handoffs and data-driven decisions keeps everything running well.
That's where the DORA assessment tool comes in. These metrics help you check up on your software delivery process. Think of them as a roadmap, using your team's data to show how well you're managing DevOps, tracking progress, and building efficient pipelines.
These metrics do more than just find bottlenecks. They give you a full picture of your DevOps journey, including security and reliability. It's like having a 360-degree view of your process, backed by real data. For example, teams using DORA engineering metrics often scan their applications for security issues regularly. They also follow best practices like logging code history and building scripts. These small details add up to a strong DevOps culture.
The big benefit of using DORA? Faster software updates and less downtime. This efficiency comes from having a well-tuned DevOps process.
DORA gives your team the tools and knowledge to build a great DevOps environment. With assessments, features, metrics, and resources like the "Accelerate" book, DORA helps you monitor progress, find areas to improve, and adopt workflows that boost your team's effectiveness. For instance, DORA lets you compare your change lead times to industry standards, helping you streamline your process.
In the end, DORA engineering metrics help your engineering team stay ahead in the fast-changing tech world. By using DORA's insights, you can keep your team competitive, deliver high-quality software, and maximize your DevOps efficiency.
Next, let’s delve into the specific benefits of tracking DORA engineering metrics.
Benefits of Tracking DORA Metrics
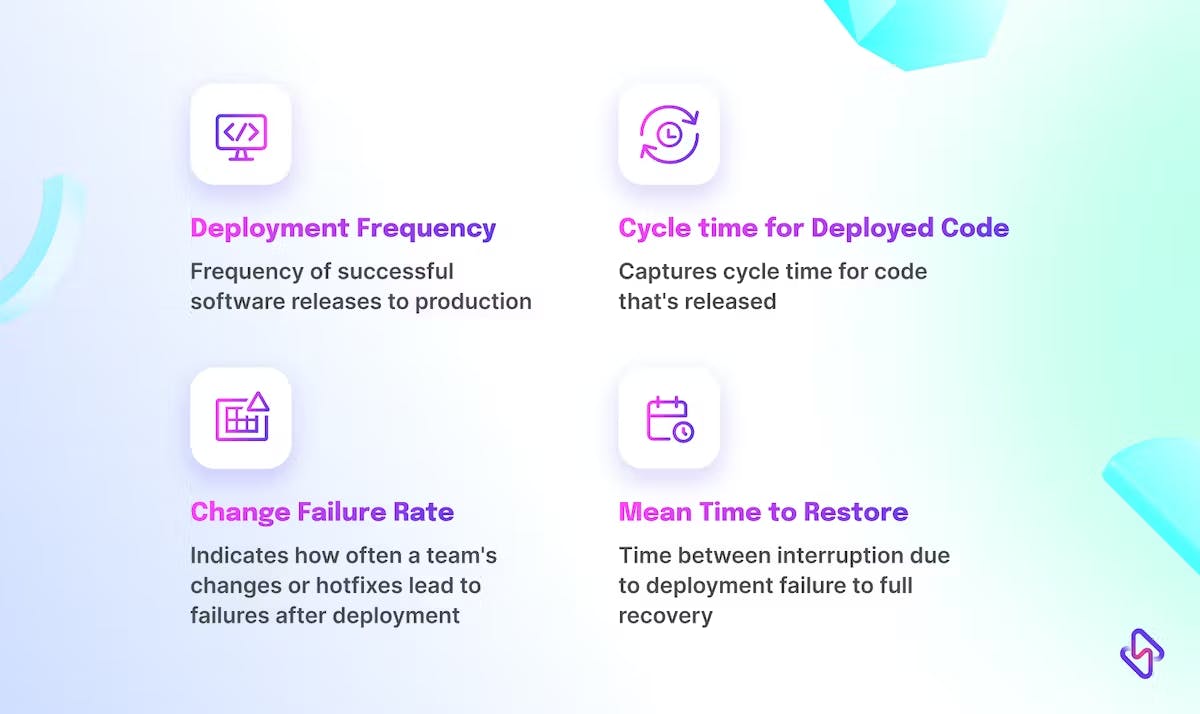
DORA metrics provide valuable insights into the performance of your software delivery and operations. By tracking metrics such as lead time, deployment frequency, change failure rate, and mean time to recovery, you can gain a clear understanding of your team's efficiency and identify areas for improvement.
2. Data-Driven Decision Making
With DORA metrics, you can make data-driven decisions regarding process improvements, resource allocation, and prioritization. By analyzing the metrics, you can identify bottlenecks, optimize workflows, and allocate resources effectively, leading to better outcomes and increased productivity.
3. Continuous Improvement
DORA engineering metrics enable you to measure the impact of process changes and improvements over time. By tracking the metrics consistently, you can monitor progress, identify trends, and ensure that your team is continuously improving their software delivery practices.
Dora provides a benchmark for comparing your team's performance against industry standards and top-performing organizations. This benchmarking allows you to identify areas where your team excels and areas where there is room for improvement, helping you set realistic goals and drive continuous improvement efforts.
5. Collaboration and Alignment
DORA metrics serve as a common language for teams and stakeholders. By tracking and sharing these metrics, you can foster collaboration, alignment, and shared accountability among different teams involved in the software delivery process. This promotes a culture of transparency and collective ownership of outcomes.
6. Customer Satisfaction
By focusing on metrics such as deployment frequency and change failure rate, DORA metrics indirectly contribute to improved customer satisfaction. When teams deliver software faster, with fewer failures and quicker recovery times, it leads to a more stable and reliable product, enhancing the overall customer experience.
DevOps Research and Assessment metrics empower organizations to gain insights, make data-driven decisions, drive continuous improvement, benchmark performance, foster collaboration, and ultimately deliver better products to customers.
Moving on, let’s address the cost aspect of implementing DORA metrics.
How Much Do DORA Metrics Cost?
Remember those days when streamlining your software delivery with DORA Metrics meant a hefty monthly bill? Thankfully, those days are gone!
Originally, utilizing DORA metrics required significant investment. Engineering managers had to depend on various sources to generate these metrics, often delivered as physical PDFs (can you believe it?). These services could rack up thousands of dollars each month.
But here's the good news: advancements in data collection and integration technology have slashed the cost of gathering DORA data. This translates to a major win for you—DORA metrics are now readily available and cost-efficient, regardless of your company size or team structure with Hatica.
This shift means you can focus on the true power of DORA engineering metrics: pinpointing areas for improvement, optimizing your DevOps practices and ultimately achieving smooth and efficient software delivery.
Now that we understand the cost implications, let’s see how companies are optimizing key DORA metrics.
How are Companies Optimising DORA Metrics?
Companies that adopt DORA metrics cultivate a culture of continual improvement and learning. By measuring and analyzing software delivery performance, teams can pinpoint areas for enhancement and swiftly adapt to changing customer needs and market dynamics.
This business agility empowers organizations to pivot quickly, seize opportunities, and effectively manage risks.
Research from the DevOps Institute reveals that organizations with mature DevOps practices guided by DORA metrics are twice as likely to surpass their financial targets. This might be because streamlined software delivery processes lead to cost savings, reduce time spent on manual tasks, and boost overall productivity, correlating directly with improved financial outcomes.
Let’s delve into specific strategies companies use to align DORA metrics with their business goals.
Alignment of Development and Business Goals
DORA engineering metrics serve as a shared language for technical and business teams. By aligning software delivery performance with business objectives, organizations ensure that development efforts directly contribute to strategic goals. This alignment fosters a collaborative environment where teams unite for shared success.
In addition to alignment, DORA metrics also play a crucial role in talent attraction and retention.
Talent Attraction and Retention
Top talent gravitates towards organizations that prioritize innovation and invest in modern software delivery practices. Emphasizing DORA metrics showcases a commitment to fostering an environment where employees can excel, grow, and contribute to meaningful projects. This focus on continuous improvement enhances talent attraction and retention, reducing turnover costs and maintaining a skilled workforce.
In conclusion, the impact of DORA engineering metrics on business is profound. Efficient software delivery processes, guided by these metrics, accelerate time-to-market, boost customer satisfaction, enhance
business agility, and drive improved financial performance. Leveraging these metrics allows organizations to align development efforts with business goals, attract top talent, and gain a competitive edge in rapidly evolving digital landscapes. Embracing DORA metrics isn't solely for DevOps teams—it's a strategic imperative that drives success and prosperity across the entire business.
For a practical approach, let’s discuss monitoring DORA metrics with Hatica.
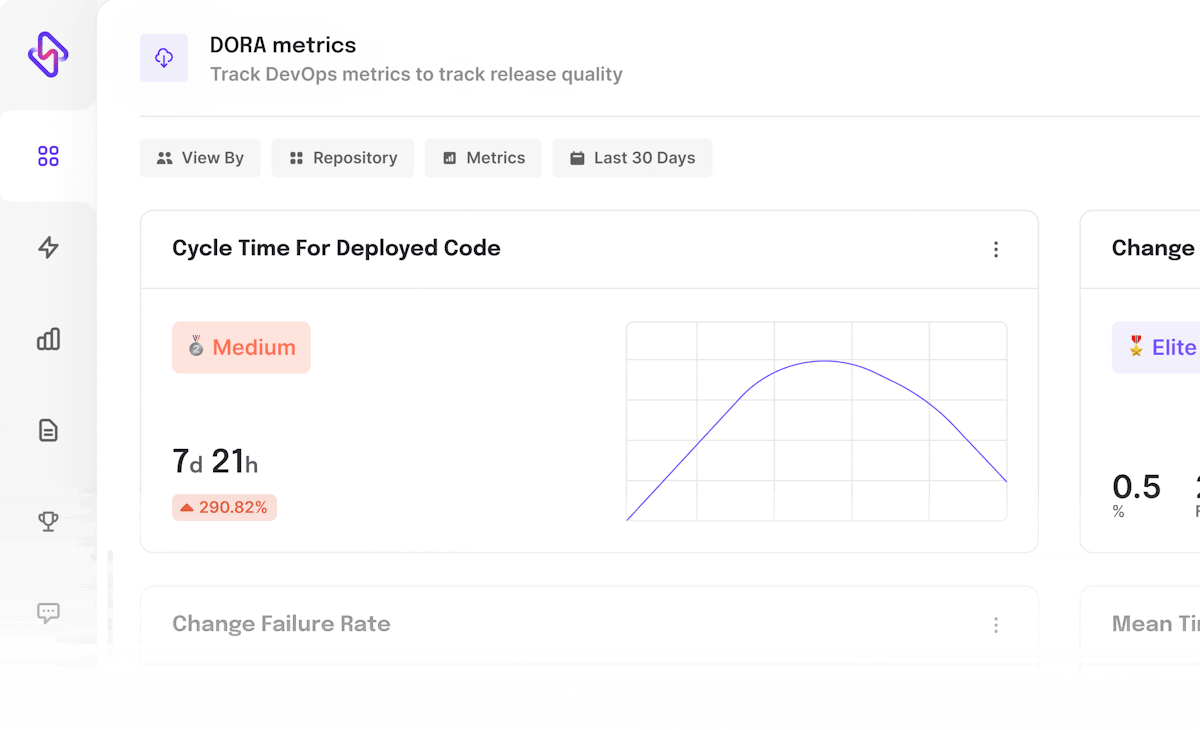
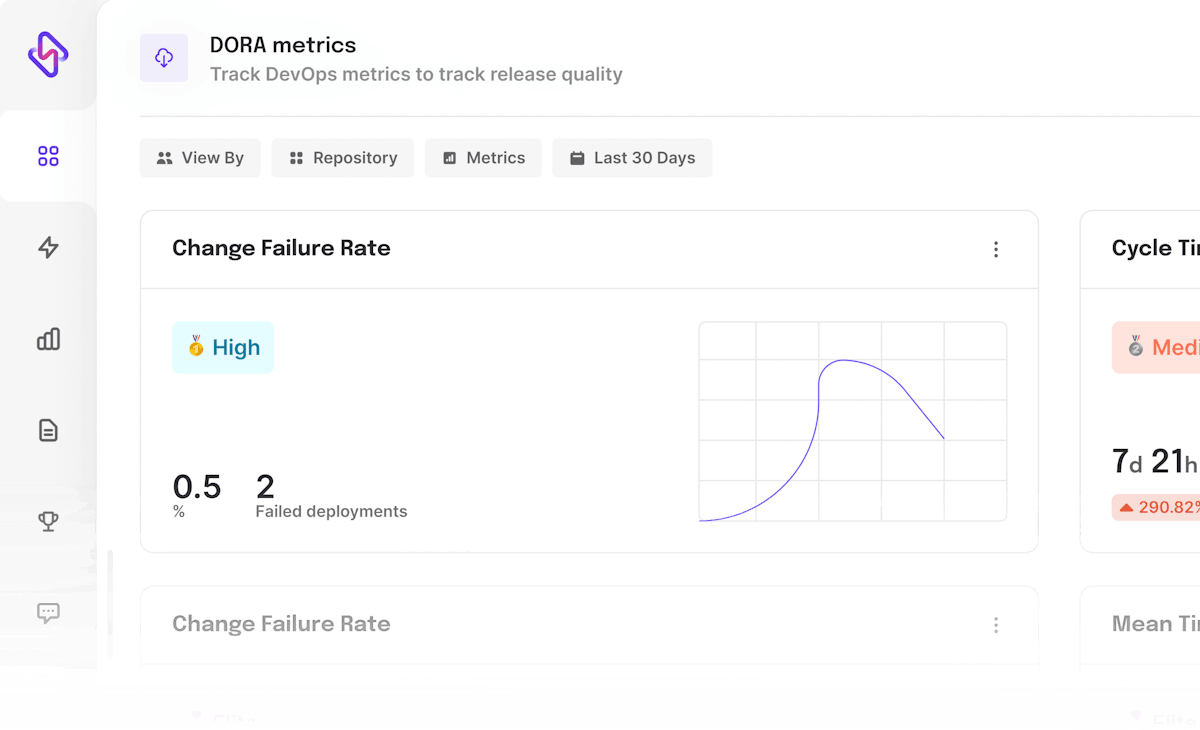
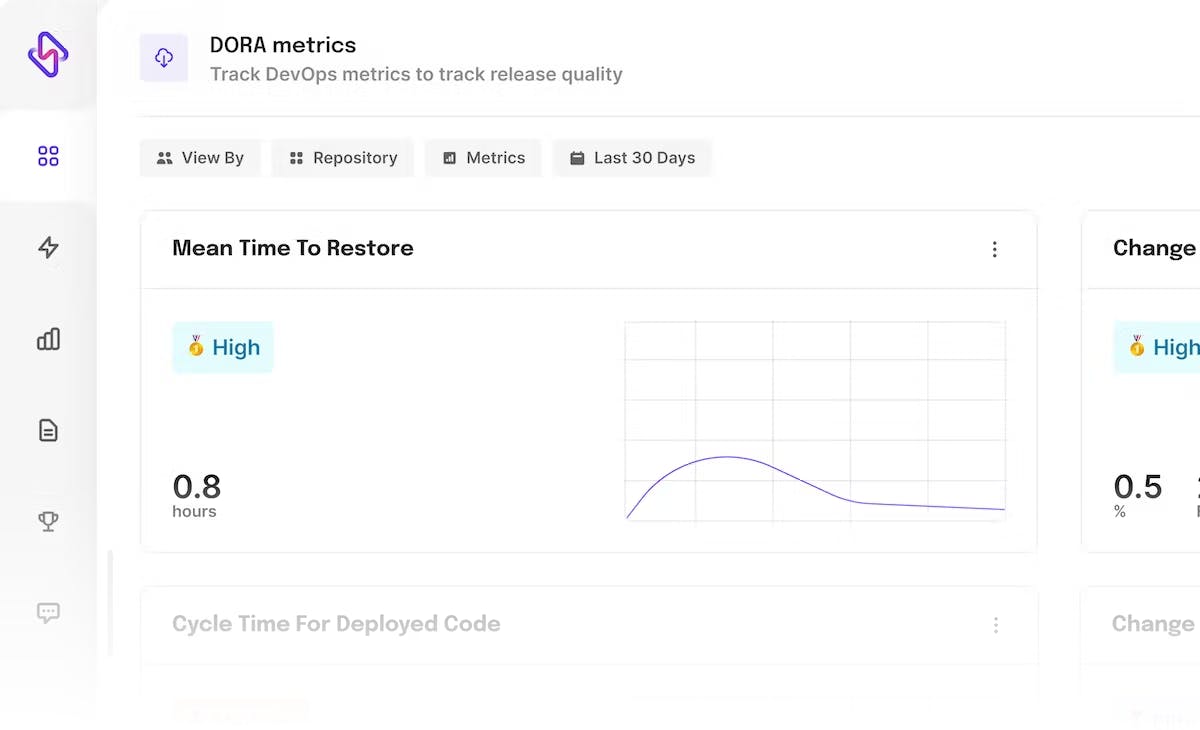
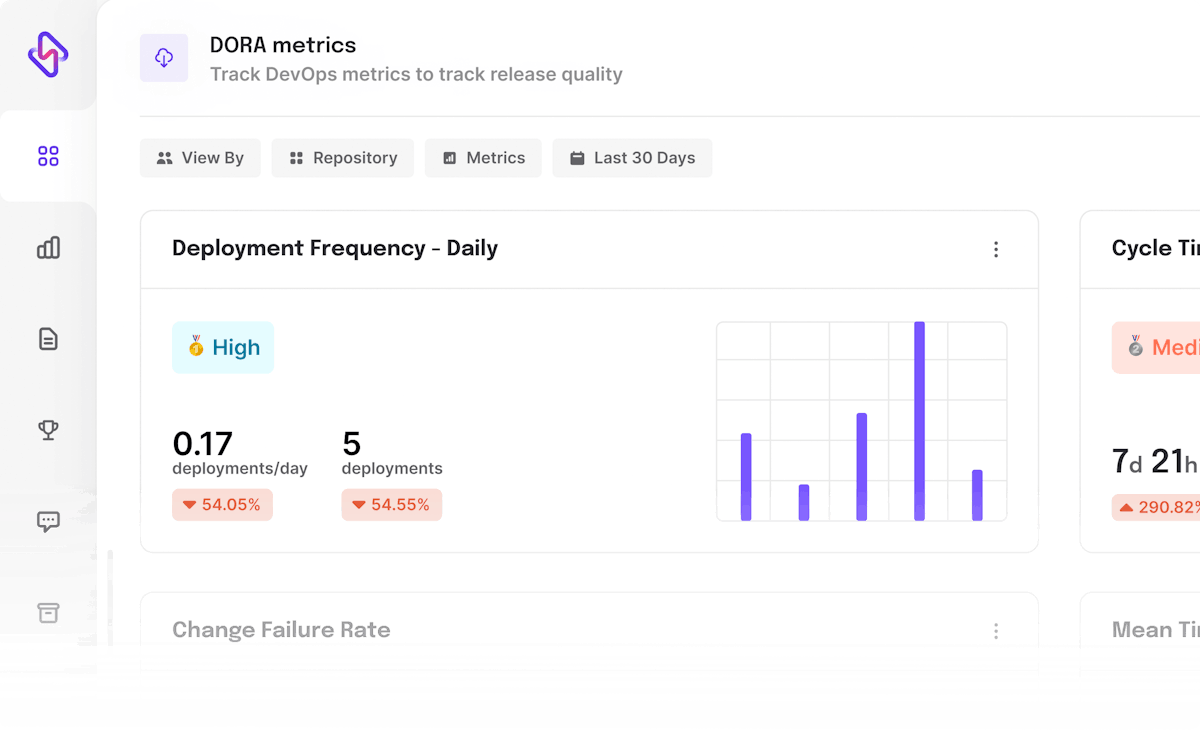
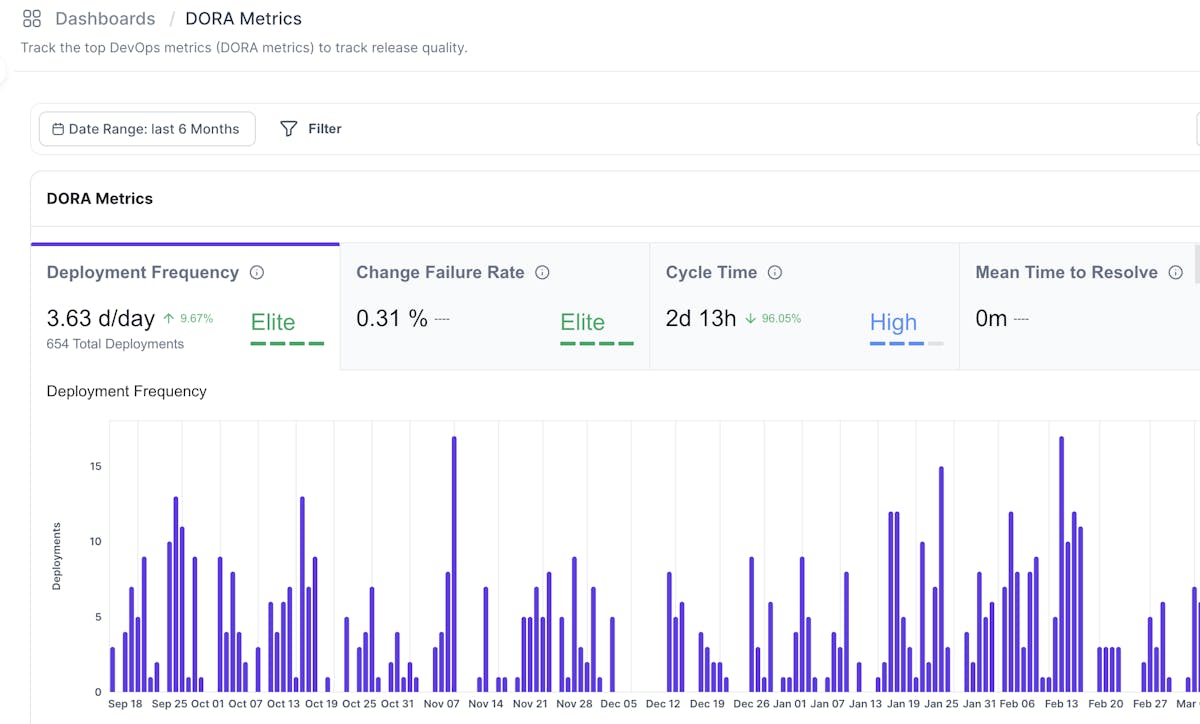
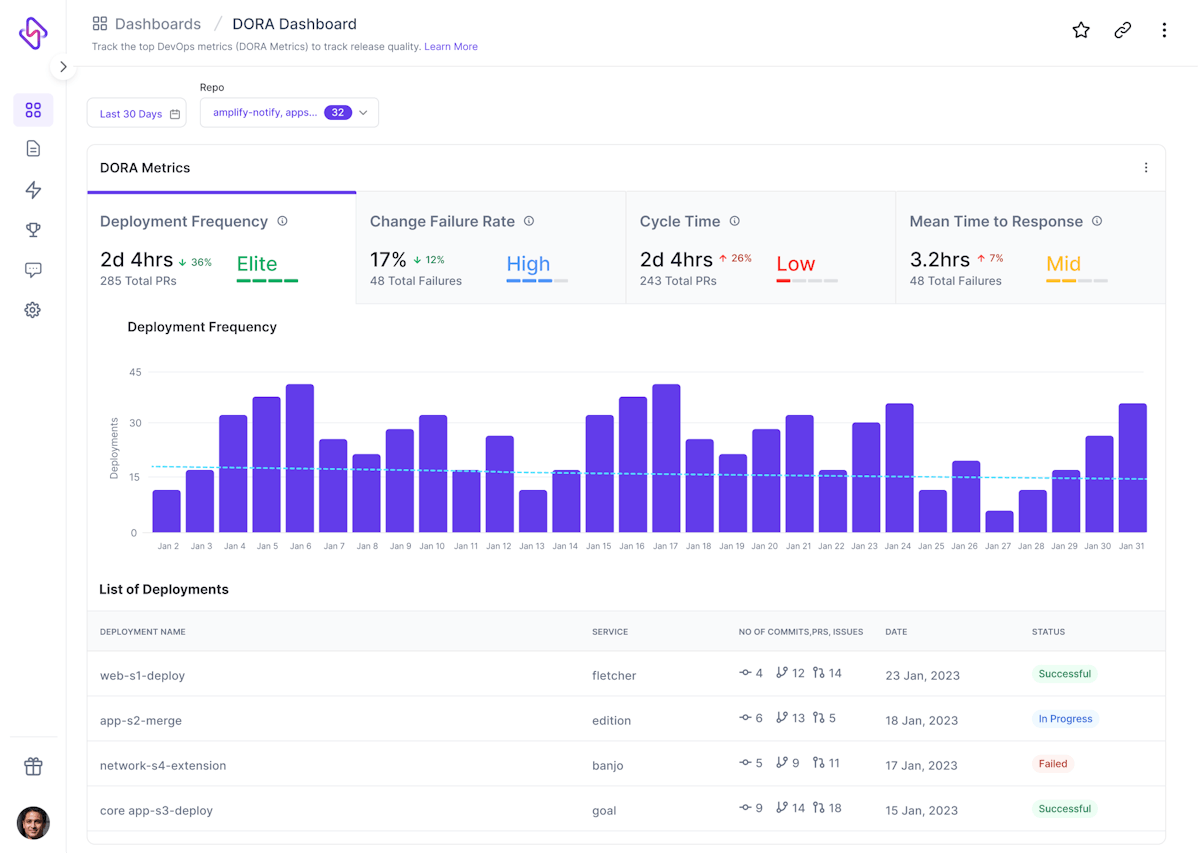
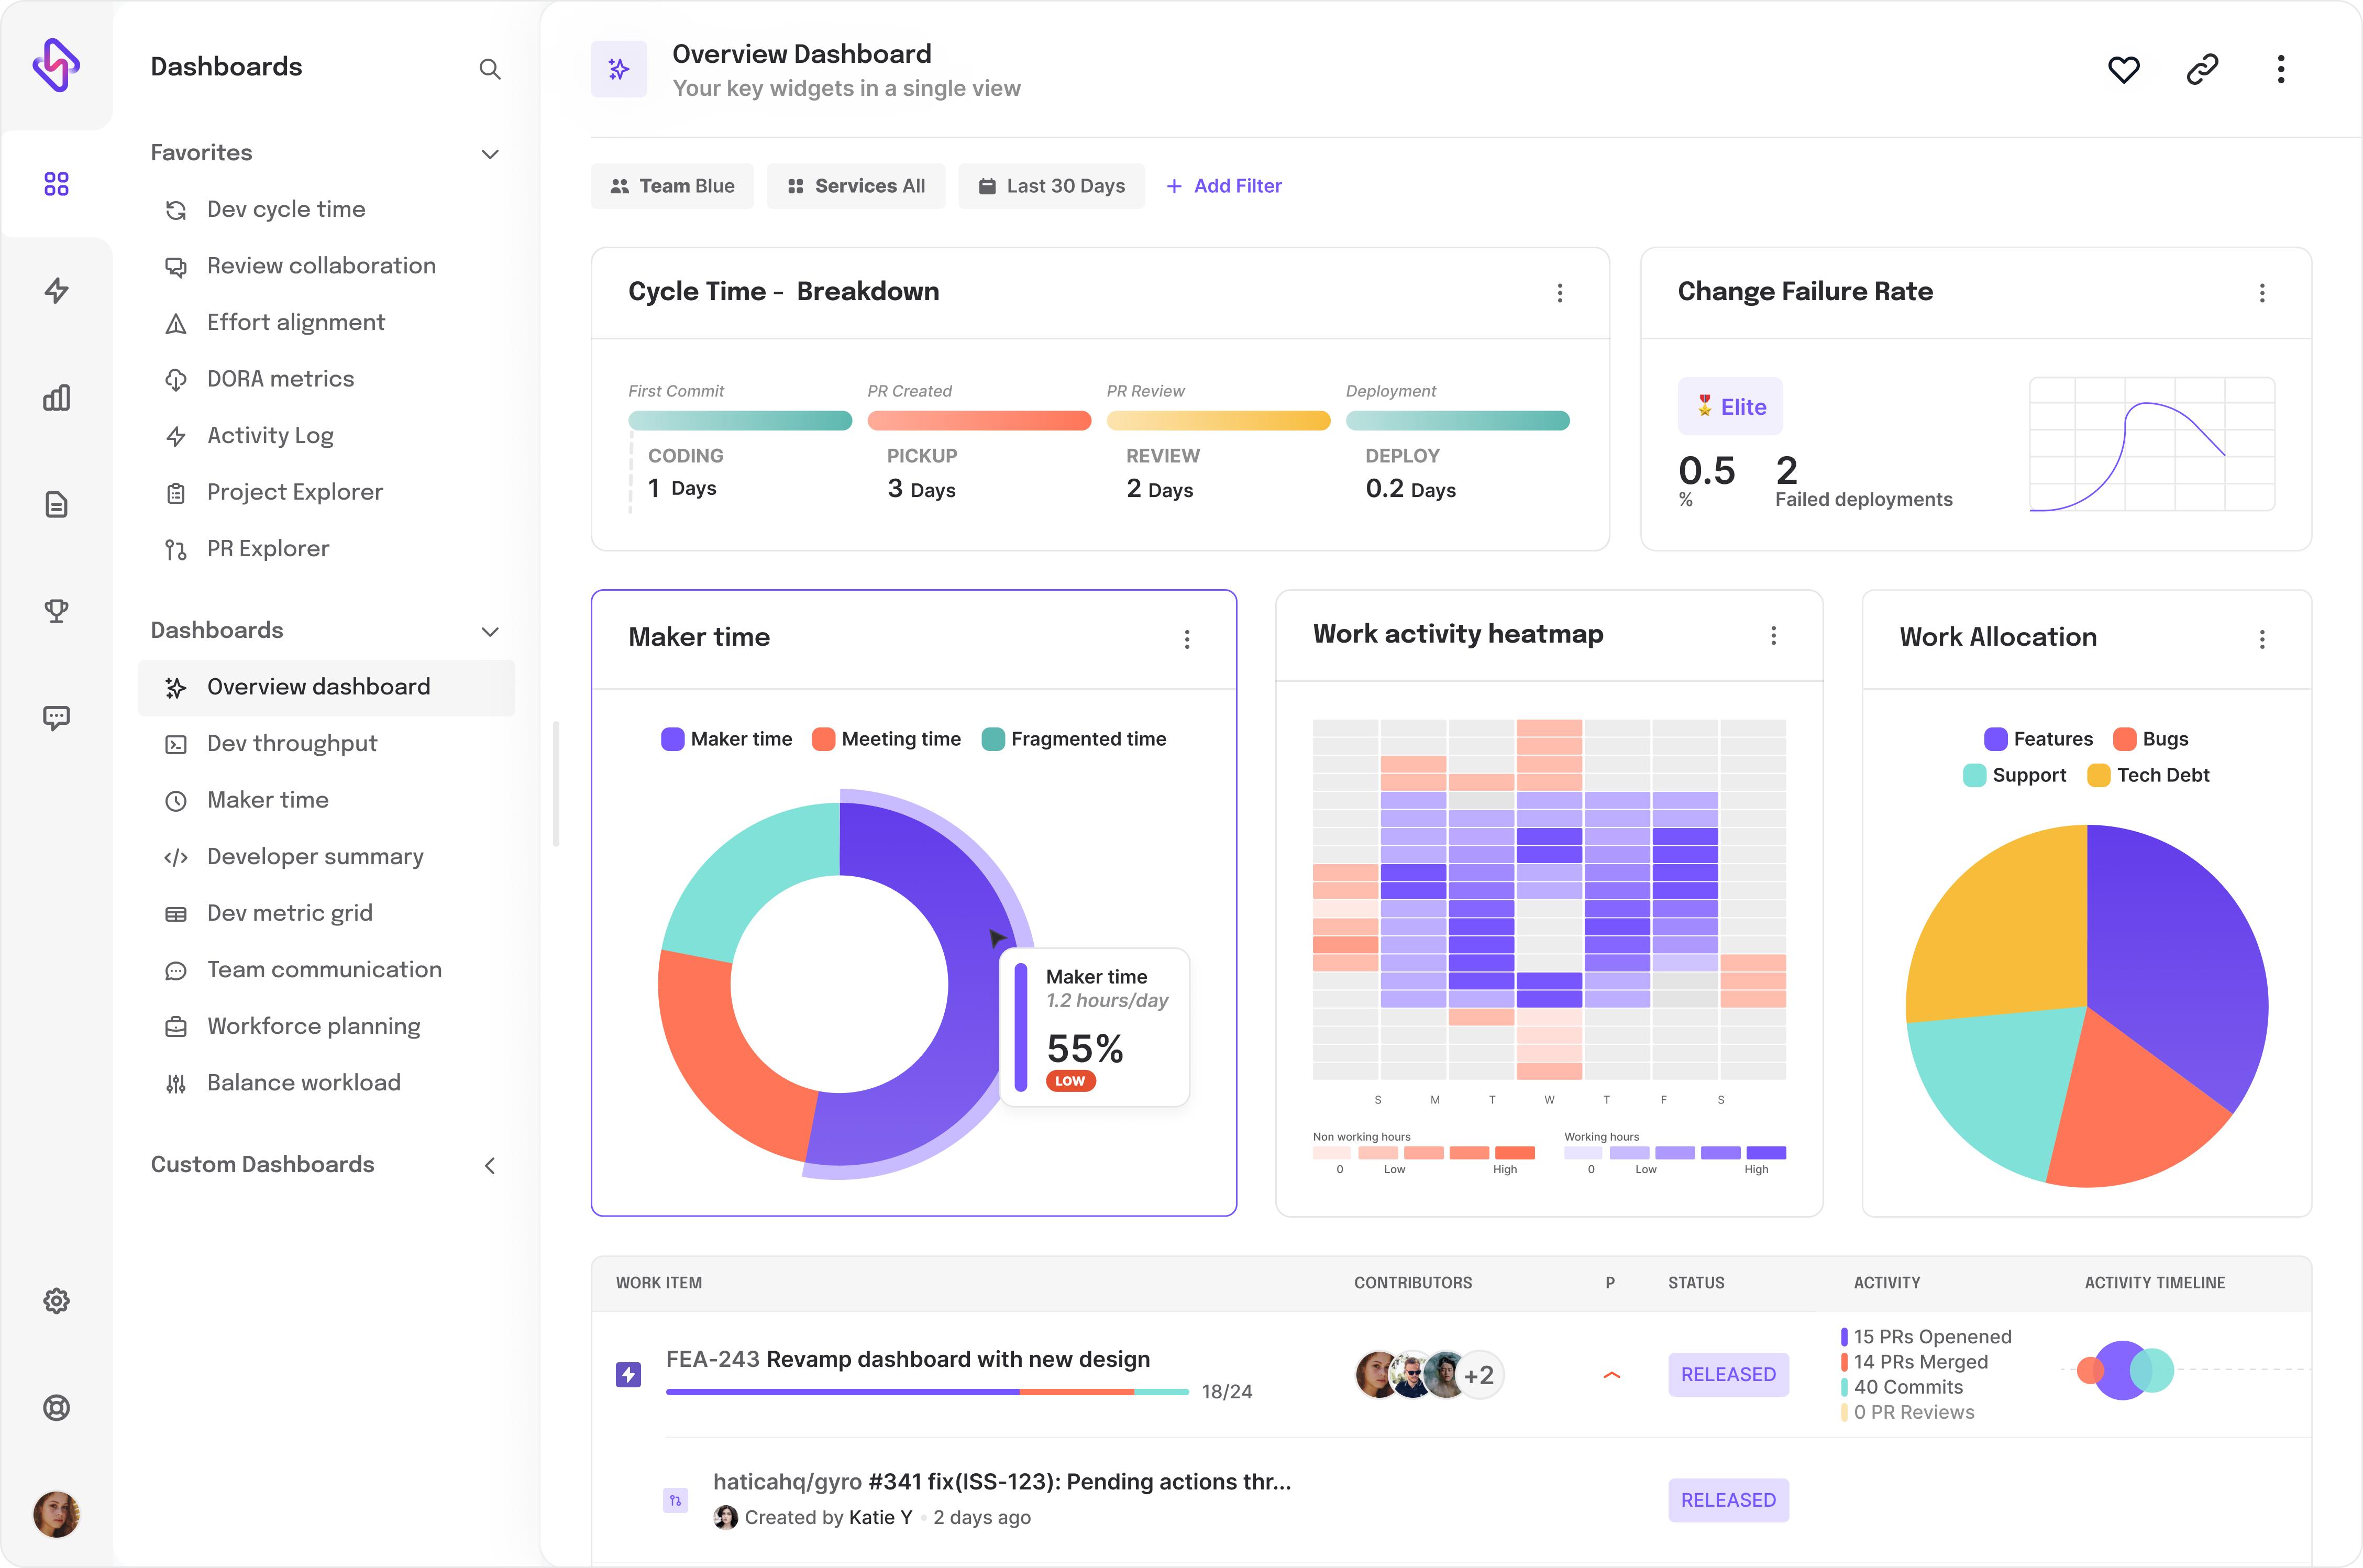
Monitoring DORA Metrics With Hatica
Hatica offers a comprehensive view of the four DORA metrics by collating inputs across a digital tool stack and offering data-driven insights to understand the DevOps bottlenecks of a team.