What is Git Analytics and Why it Matters to Engineering Teams?

Git analytics provides accurate insights of projects to engineering teams. Learn why git analytics is used by engineering teams to optimize engineering workflow.
Why Should Engineering Teams Care About Git Analytics

The pursuit of software excellence is vital for business performance. As businesses increasingly rely on digital technology, engineering teams are pivotal in driving innovation and enhancing processes. According to a McKinsey study of 400+ large enterprises across 12 industries, high-performance engineering teams outperform their peers in areas like revenue growth, customer satisfaction, and brand perception.

Organizations must prioritize innovation and optimize their engineering teams' performance and speed to excel in a competitive business environment. Achieving this requires reliable data for objective assessment and continuous improvement. However, obtaining such data has often been challenging, costly, and incomplete, leading to gaps in leadership's insights. Fortunately, emerging philosophies and frameworks guide what to measure and how to use metrics to enhance development teams. One valuable framework is the use of Git Analytics.

In this blog post, we'll explore why engineering teams should care about Git Analytics and how it can benefit their workflow.

Let’s get started.

What is Git Analytics?

What is Git Analytics for Developer teams?

Git is a version control system used to maintain, share, and collaboratively develop code. Programmers use Git to track changes made to code. Git analytics allows users to gain visibility into programmers’ work activity by measuring engineer output, processes, and work quality. These engineering analytics provide managers with a viewpoint to assess their team’s performance and project health.  

Benefits of Git Analytics for Engineering Teams

Let’s explore the manifold benefits of Git Analytics and how it can be a game-changer for engineering teams.

1. Continuous Improvement 

Git analytics allows managers to assess and evaluate the performance of their dev teams. It enables them to identify inefficiencies that risk delivery and also equips managers with data insights that enable them to take necessary action. Data-driven insights to guide team management will assist engineering leaders in reducing engineering inefficiency. This allows teams to foster a culture of continuous improvement. 

2. Preventing bottlenecks

Git analytics can provide visibility into a developer’s work activity, serving as a log of engineer’s tasks, progress, and challenges. Managers can use this viewpoint as a daily overview of each developer’s work pattern and identify bottlenecks or anomalies. Using historical data of anomalies, managers can plan 1:1 meetings and stand-ups geared towards process improvements and optimization. 

3. Developer Satisfaction

Analytics dashboards provide visual cues to developer performance and progress. Such visualization incentivizes and promotes intrinsic work motivators such as the developer's interest, commitment, and effort. Such intrinsic motivation can translate to better job performance and employee satisfaction, which are critical to employee retention.

4. Optimized Workloads 

Git metrics tools provide a single source of truth to managers and developers. Managers have easily accessible and reliable sources of performance data on their team members. Developers gain workplace visibility even if they are working on relatively low-visibility (but, high-impact) work. Such a data-driven view helps managers optimize workloads and also helps prevent burnout by removing the onus of workplace visibility from the developers.

5. Code Quality and Efficiency

Monitoring code quality is essential for any engineering team. Git Analytics helps identify code churn, track code review statistics, and spot areas that require improvement. By addressing code quality issues early, teams can reduce technical debt and produce more reliable software.

6. Tracking and Monitoring Progress

Engineering managers can benefit from Git Analytics by tracking project progress in real-time. Metrics like commit frequency and branching patterns can provide insights into how well a project is progressing and whether it's on schedule.

7. Data-Driven Decision-Making

Data-driven decision-making is at the core of Git Analytics. Engineering teams can use metrics to make informed choices about resource allocation, project prioritization, and process optimization. This leads to more effective development strategies.

What Metrics Should Teams Measure?

Let's dive deeper into the key metrics engineering teams should measure to enhance their development processes and overall productivity.

1. Cycle time

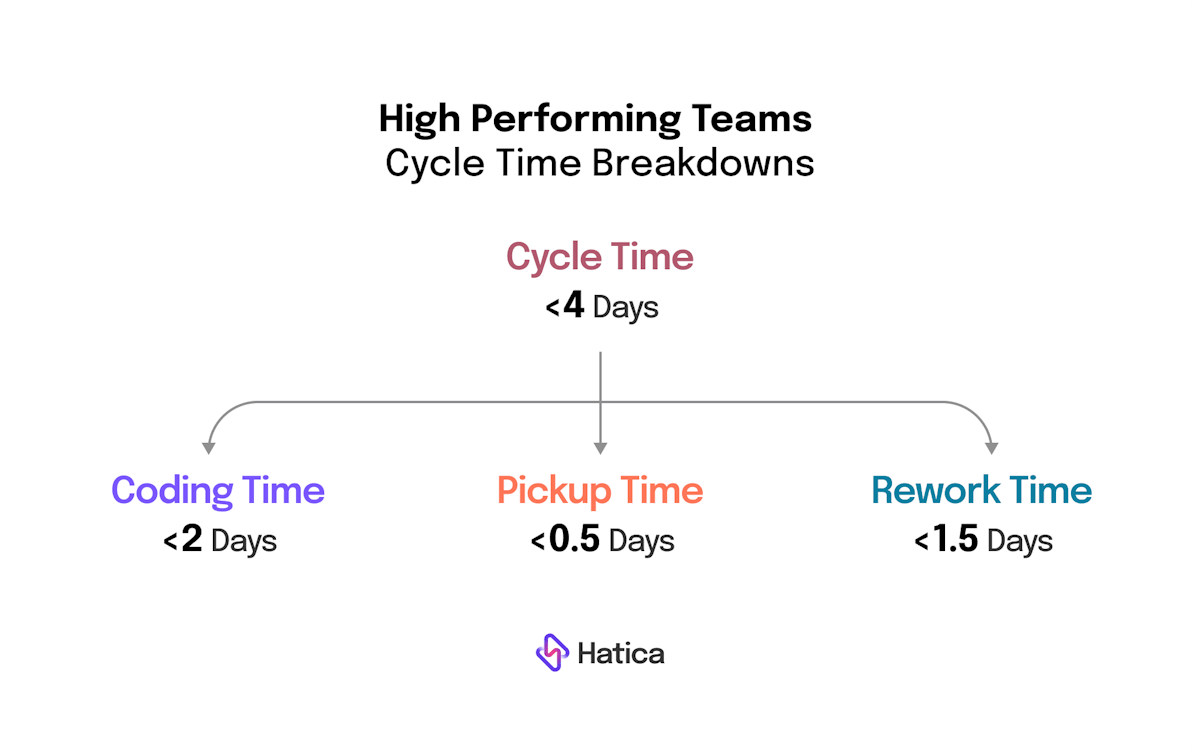
High performing teams cycle time

Software development cycle time is the period of time from an engineer’s first commit to the deployment of code. The metric provides insights into the speed of the dev team, that is, the time taken to complete projects, and the overall performance of the team. It measures the efficiency and ability of a team to deliver projects within a given timeline.

When leaders optimize cycle time, they can optimize their team’s tools and processes to adequately support their teams. At instances when cycle time increases when compared to expected benchmarks, leaders can preempt threats to delivery and preserve developer productivity by reorganizing their teams and managing workload to optimize performance. 

2. Rework vs New work

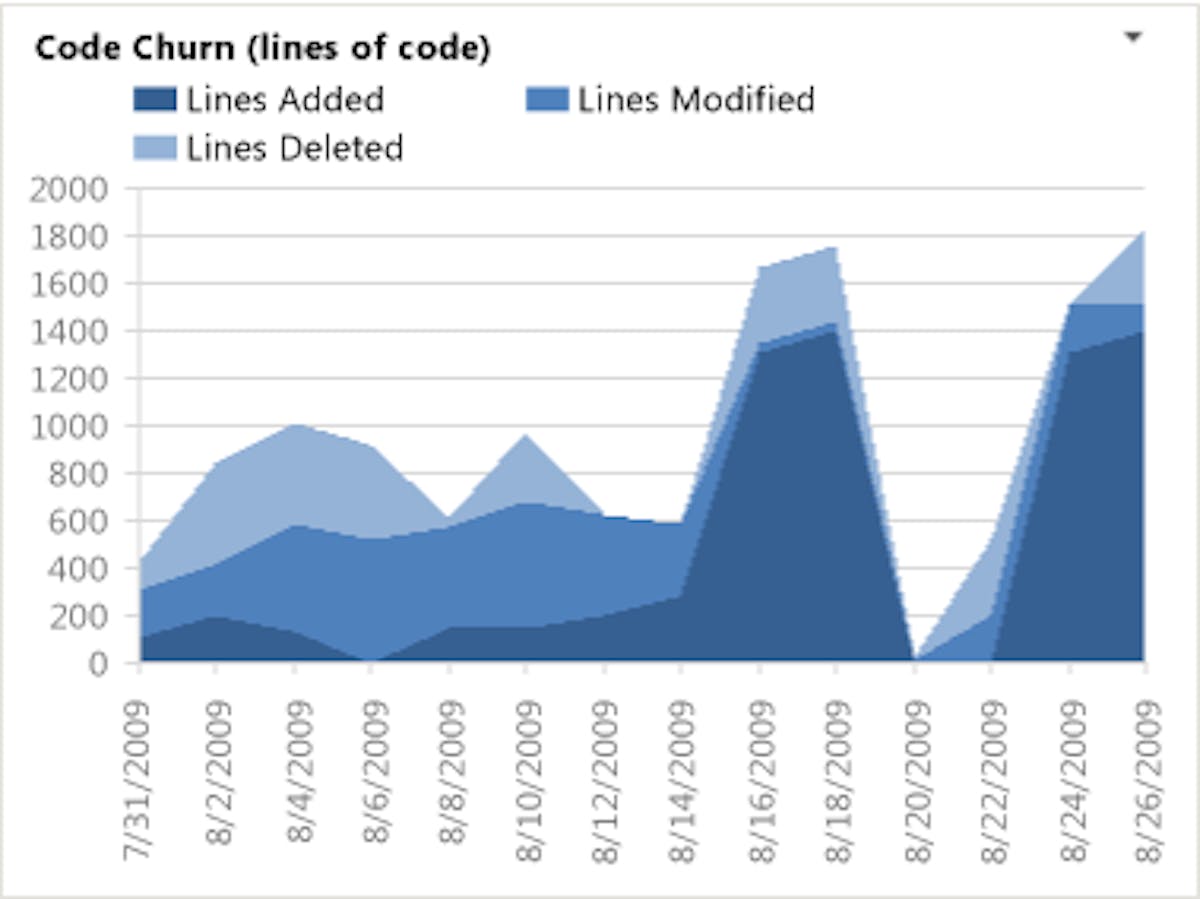
Rework, also known as code churn, refers to the frequency at which an engineer edits their own code. Although a certain level of rework is usually acceptable and normal for engineers, high levels of code churn can indicate inefficiencies in the software development cycle. 

New work refers to the code that is produced anew by an engineer. 

Code churn in dev teams

When rework is contrasted against new work, it helps paint a picture of an engineer’s productivity and contribution towards creating new assets or contributing to new development aligned with the team’s goals. By monitoring this metric, managers can assess whether their teams are progressing efficiently towards creating value. When this indicator is negative, it serves as a sign that helps managers optimize their team’s code churn, maker time, and goal alignment. 

3. Code Review Metrics

Code reviews are a pivotal aspect of the software development cycle, promoting collaboration, code quality, and knowledge sharing within the team. To gauge the effectiveness of code reviews, engineering teams rely on various metrics:

A. Review involvement

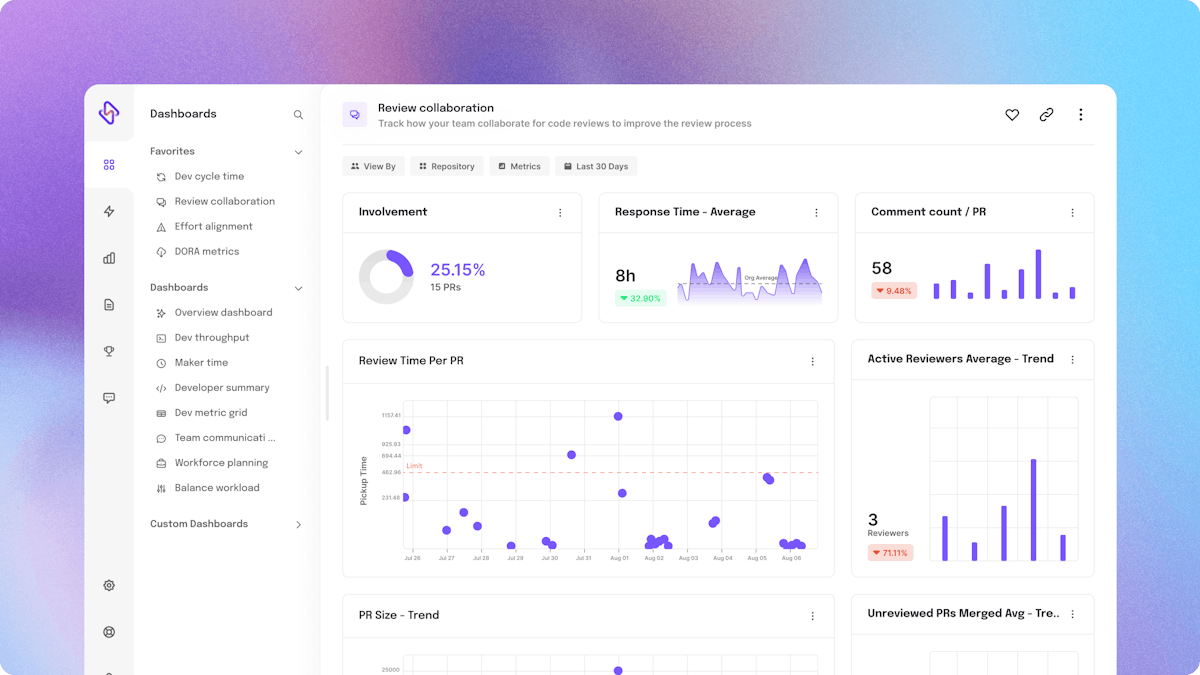
Review involvement measures the fraction of a team’s Pull Requests that an engineer is involved in. The PR review process is a hallmark of dev team collaboration. Often involving several stakeholders, the review process checks for completeness and quality of each release and has great implications on a dev team’s ability to deliver business value. Since PR reviews are a critical aspect of a dev cycle, measuring review involvement indicates an engineer’s interest, ability, and efficiency in working as a cohesive team, contributing to the team’s shared goal, and providing valuable input to the team’s work product.

Review collaboration dashboard from Hatica

When review involvement for an engineer is lower than team benchmarks, it could indicate inefficiencies in several potential areas such as inefficient PR size allocation or poor workload allocation, a lack of skill or expertise, or even burnout. When managers track review involvement, they are able to optimize cycle time and align their team members toward delivery goals.   

B. Response Time

Response time metrics are essential for understanding the efficiency of the code review process. There are two key aspects:

C. Submitter Response Time:

This is the average time it takes for the coder who raised the PR to respond to a review. It is calculated based on both, a response as a follow-on commit, or just an addressed comment.

D. Reviewer Response Time:

This metric represents the average time it takes for a reviewer to respond to a comment by a submitter on their PR. When the response time is high, it leads to a task being left as a work in progress. The longer the response time, the more difficult it might get to rework the project with accuracy and creativity due to a loss of context and continuity. It also leads to increased cycle time and causes high rework time.

4. Unreviewed PRs Merged

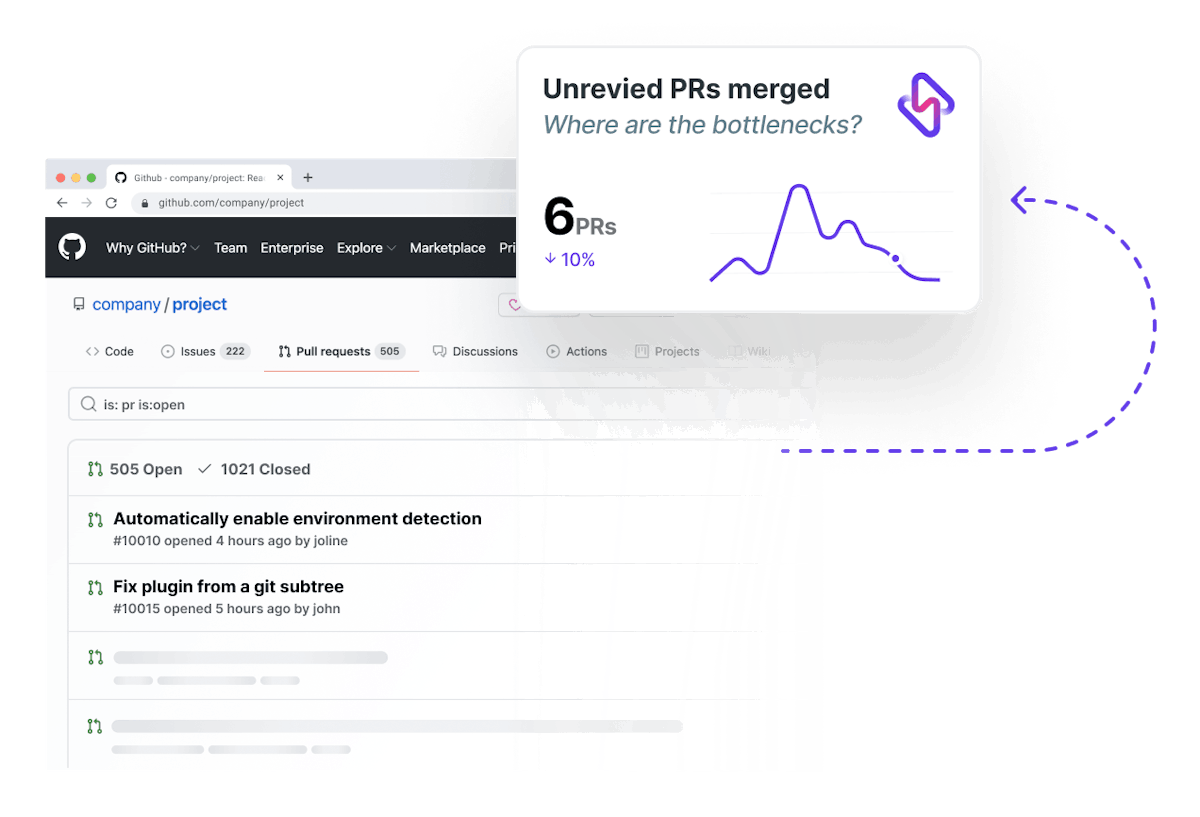
This metric represents the count of PRs that were merged without a review. This includes not only PRs that were not approved but also those that were not reviewed at all. PR reviews are a critical process of the dev cycle to ensure that the code is complete, addresses the requirements, is error or bug free, and is of high quality. When teams merge unreviewed PRs, they risk the efficiency of the entire project. Thus, this is an important metric to gauge the quality of dev team processes. 

Unreviewed PRs merged

Merging unreviewed PRs is often the reason why some teams have deceptively low cycle time. Even though low cycle time is desirable, having very low cycle time of less than a couple hours is often a signal of compromise on process quality either through merging unreviewed PRs or a low quality of reviews. 

5. Pickup Time

PR pickup time is a component of the cycle time metric. It can be defined as the time between when a pull request is raised and until a review has started. Teams that adopt efficient review processes ideally have their pickup time benchmarked in minutes. When this metric inches higher than a few hours, it could be a signal of inefficient processes including poor workload allocation and high number of work in progress tasks, high PR size, or poor workflows for transfer of projects.  

Git Analytics is Not the Complete Picture

Git analytics does not accurately reflect individual performance. While one might be tempted to base the performance of developers on Git based metrics, this is more often than not a bad idea. And this is simply because Git is a collaboration tool and drives workflow and team metrics rather than individuals. Git analytics represent workflow and team metrics. The insights from Git are measurement of developer performance cannot be distilled down to a few metrics and should not be used without context.

Git analytics, when combined with other engineering management metrics, can provide a holistic understanding of development team performance. This understanding is particularly valuable now, as remote work and hybrid teams have become the order of the day. In this future of work, leaders must ensure they preempt and manage inefficiencies, boost visibility, and preserve developer productivity. In this effort, engineering analytics will serve as an indispensable tool to enable engineering team success. 

Hatica is a comprehensive engineering analytics tool that couples git analytics with activity from all the tools that developers use to map out workflows and discover opportunities for your team to be better and faster while ensuring well-being. Discover how Hatica can equip your engineering teams to perform at their best. Request a demo with Hatica today!

Frequently Asked Questions

1. What types of data can be analyzed with Git analytics?

Git analytics can analyze various types of data, including commit history, code contributions, branching patterns, and issue-tracking information. It provides a holistic view of the software development lifecycle.

2. How can Git analytics benefit software development teams?

Git analytics can benefit teams by helping them identify bottlenecks, track code quality, measure developer productivity, improve project management, and enhance overall team efficiency.

3. Are there specific tools or software for implementing Git analytics?

Yes, there are several tools and software platforms available for Git analytics, such as GitPrime, GitLab Insights, and GitHub Insights. These tools can help automate data collection and analysis.

Subscribe to Hatica's blog

Get bi-weekly insights straight to your inbox

Share this article:
Table of Contents
  • What is Git Analytics?
  • Benefits of Git Analytics for Engineering Teams
  • 1. Continuous Improvement 
  • 2. Preventing bottlenecks
  • 3. Developer Satisfaction
  • 4. Optimized Workloads 
  • 5. Code Quality and Efficiency
  • 6. Tracking and Monitoring Progress
  • 7. Data-Driven Decision-Making
  • What Metrics Should Teams Measure?
  • 1. Cycle time
  • 2. Rework vs New work
  • 3. Code Review Metrics
  • 4. Unreviewed PRs Merged
  • 5. Pickup Time
  • Git Analytics is Not the Complete Picture
  • Frequently Asked Questions
  • 1. What types of data can be analyzed with Git analytics?
  • 2. How can Git analytics benefit software development teams?
  • 3. Are there specific tools or software for implementing Git analytics?

Ready to dive in? Start your free trial today

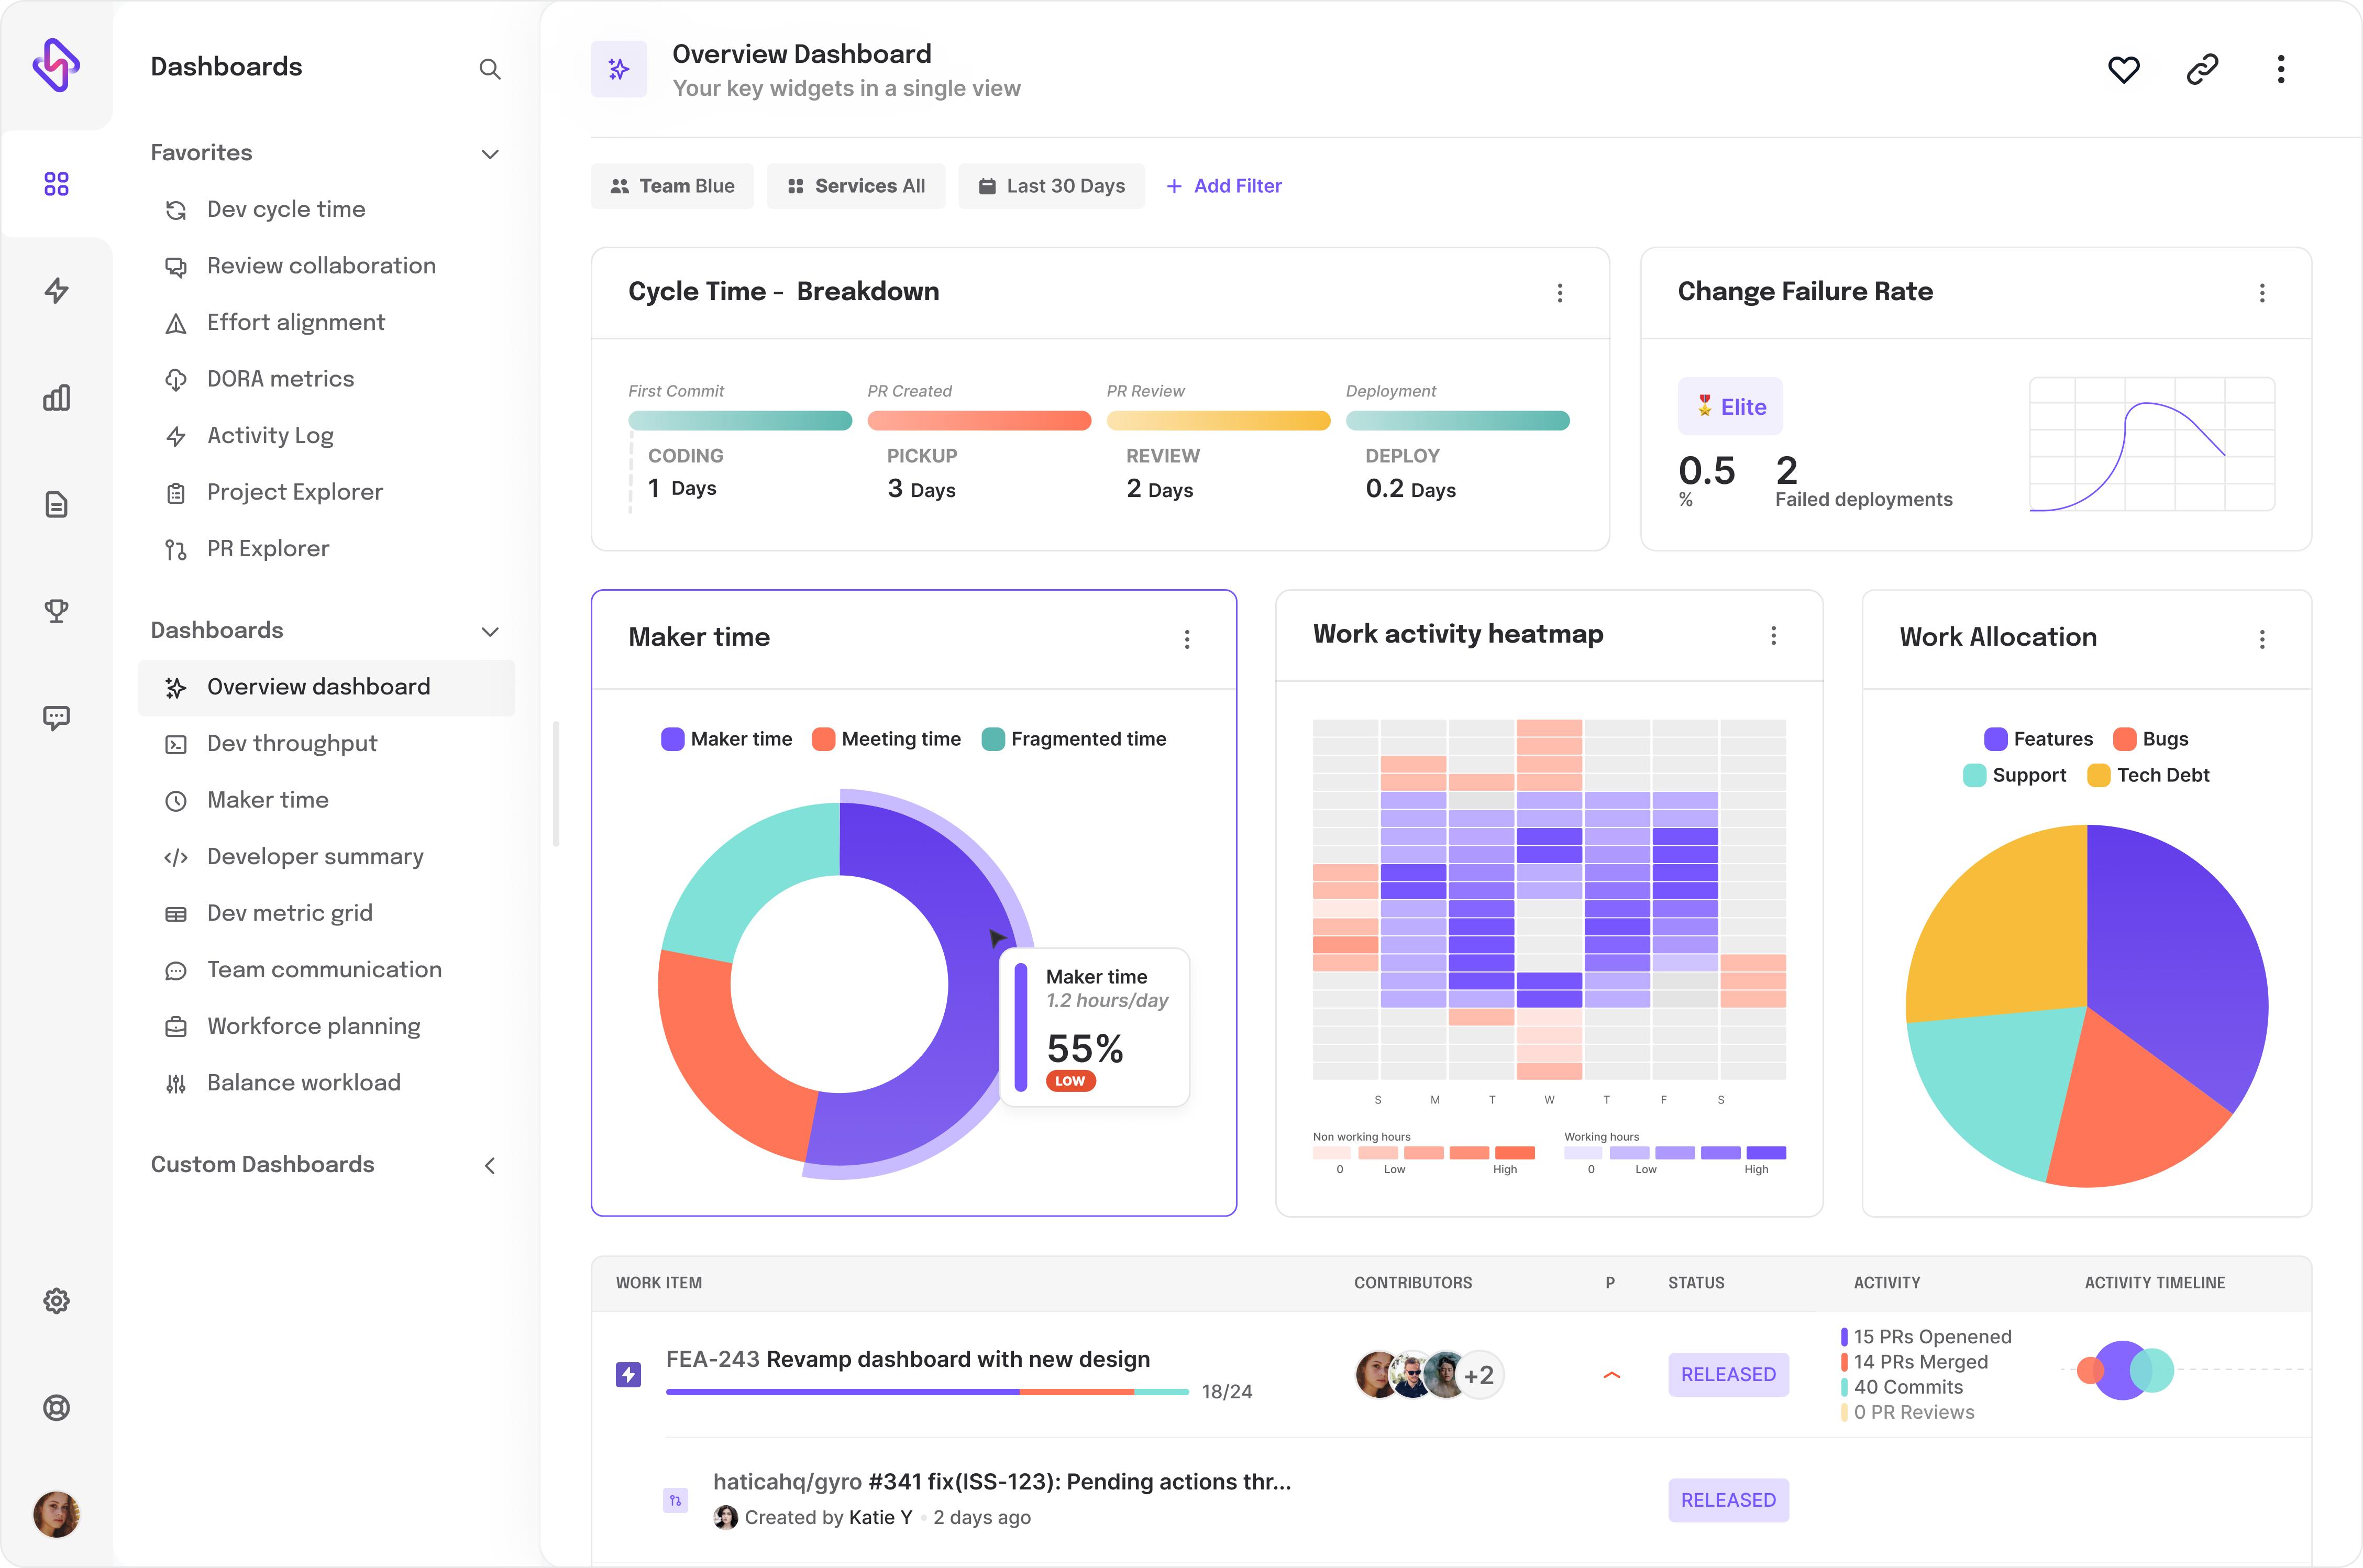
Overview dashboard from Hatica