The context
In today's fast-paced world of software development, developers are constantly facing new challenges. Meeting tight deadlines, solving complex problems, and staying up-to-date with the latest technologies can affect their well-being. However, engineering analytics is a powerful tool that can help alleviate some of these challenges.
This blog explores how engineering analytics can serve as a guiding light for Engineering Managers (EMs) to nurture the well-being of their developers, driving optimal performance and satisfaction.
Understanding the Challenges of Engineering Managers and Developers
Change happens constantly and gradually. Unless we’re speaking about events that upend our normal way of life, say a pandemic, for example; most large changes happen as an undercurrent without our deliberate awareness. And then, suddenly, we find ourselves in a completely new normal.
In software development teams, such gradual changes have now led to the new reality of remote work, globally distributed teams, and SaaS sprawl. This change has helped dev teams to become faster, more productive, and more successful.
However, it has also created a new challenge to engineering managers and leaders - EMs face the challenge of not having informed and deep visibility into their team’s work activities, well-being, and productivity. Furthermore, dev team leaders are unable to manage their SaaS sprawl and the processes that their teams use.
Without this visibility, engineering managers and leaders are unable to understand how their teams work nor find avenues to help their coworkers to perform better. This obstructs their ability to gauge bottlenecks and prepare for process improvements. Even though many remote teams adopt 1:1s to combat the challenge, the lack of personal connection and bonding opportunities have made remote 1:1s less effective.
For developers too, remote work and SaaS sprawl have brought on a new stream of new challenges. For most developers, the unplanned shift to remote work and the swift, unorganized adoption of SaaS tools has created uncertainty around processes, commitments, measurements, and management. An increasing tool stack inevitably leads to notification overload that can create threats to developer efficiency and flow and cause increased instances of context switching. As developers switch between apps and tasks, they develop the habit and find a need to stay “always-on” or digitally plugged in to complete their tasks and accommodate the different demands of distributed working. All these lags in productivity add to the many stresses of adapting to working from home, contributing to the growing problem of developer burnout.
The solution: Data-driven engineering management
What can leaders and managers do to combat this snowballing impact of poor visibility?
One solution that has captured the imagination of leaders and proven as a potent way forward is the use of data-driven engineering management. Using de-identified data and work analytics from a dev team’s tool stack, engineering managers and leaders are able to get factual operational visibility into their teams, processes, and technology.
What is Engineering Analytics?
Engineering Analytics is a dynamic approach that harnesses the power of data and analytics to illuminate the intricate landscape of software development. It is a transformative tool that empowers organizations to understand their development processes better, make informed decisions, and drive continuous improvement.
At its core, Engineering Analytics involves collecting, analyzing, and interpreting data generated throughout the software development lifecycle. This data encompasses many metrics, including coding activity, code review durations, deployment frequency, incident response times, collaboration patterns, etc. By aggregating and analyzing this data, organizations can unlock valuable insights that impact various facets of software development.
How Engineering Analytics Enhance Developers’ Well-Being?
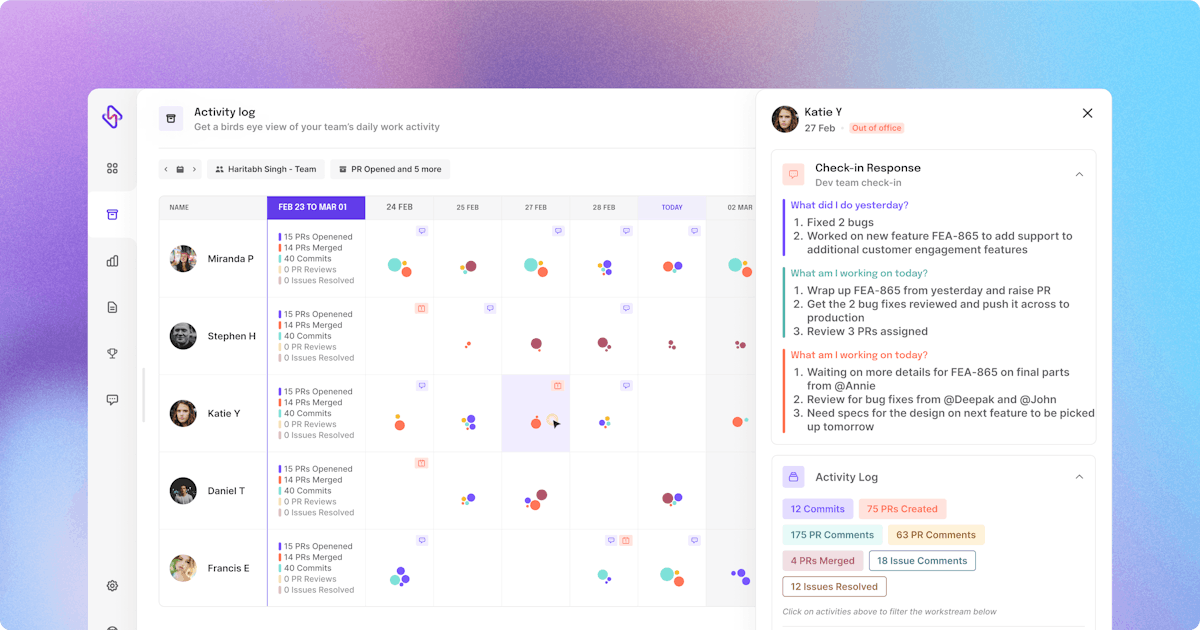
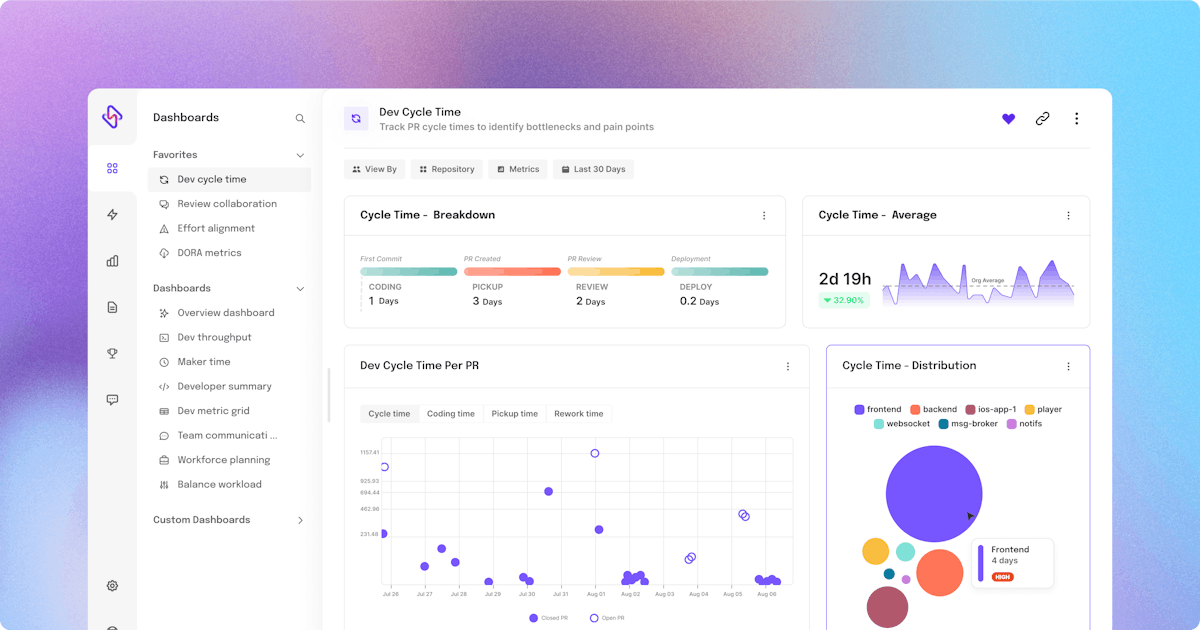
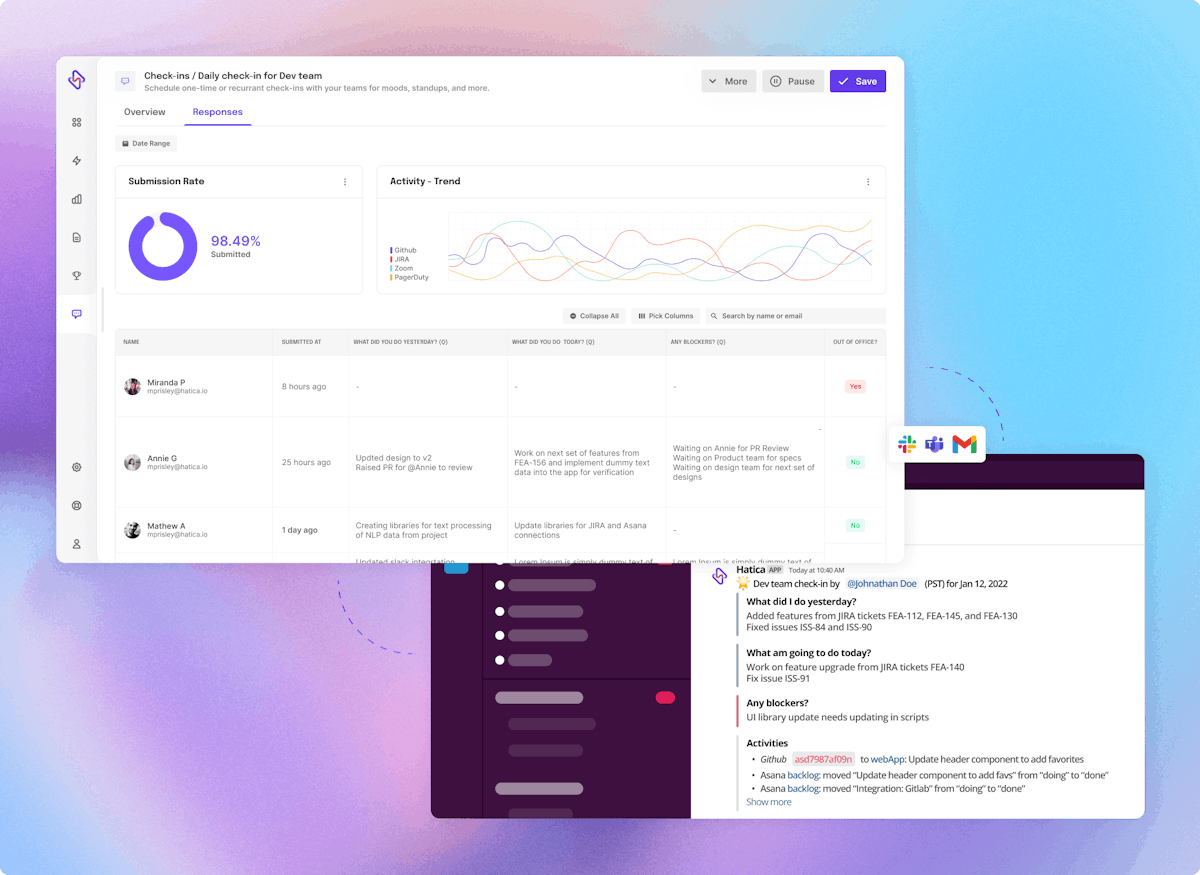
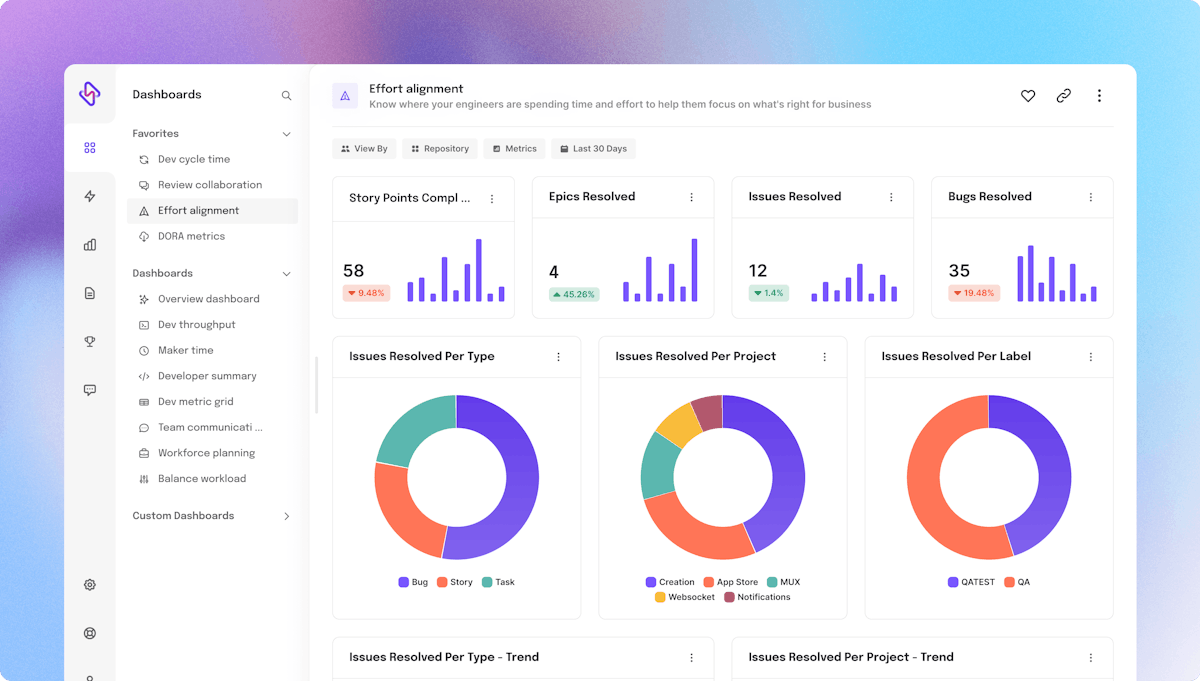
1. Visibility into engineering workflows and metrics
Software development workflows can be tedious and complex. With data-driven visibility into engineering workflows, managers can optimize their processes for success.
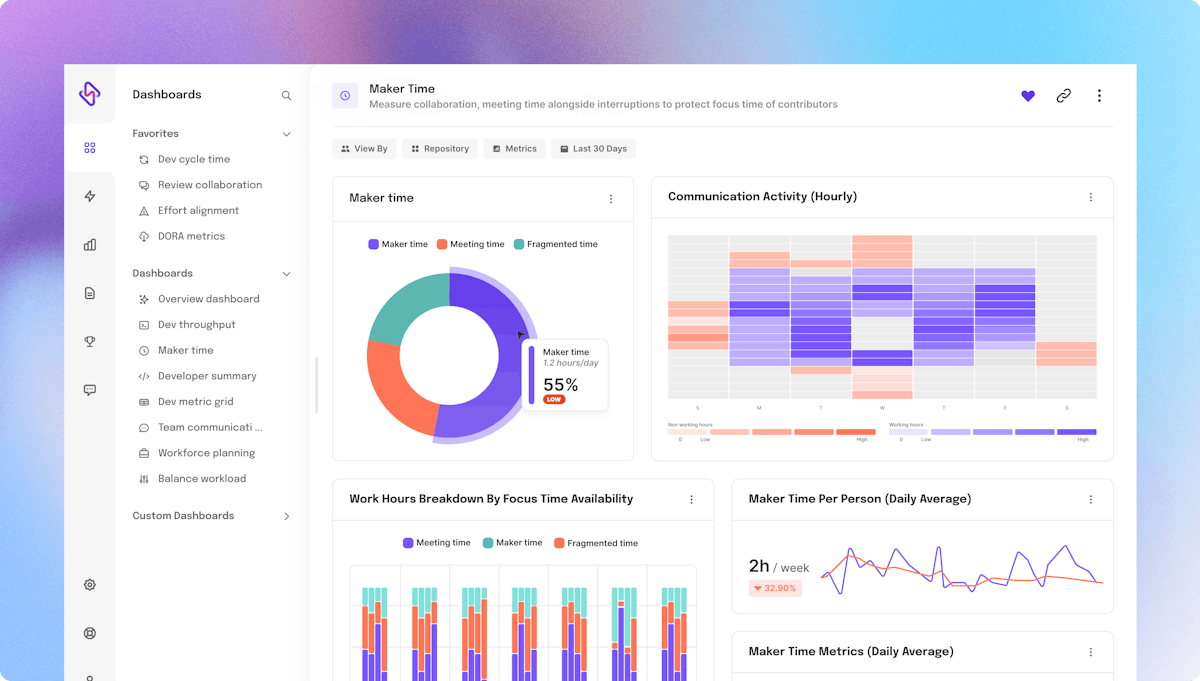
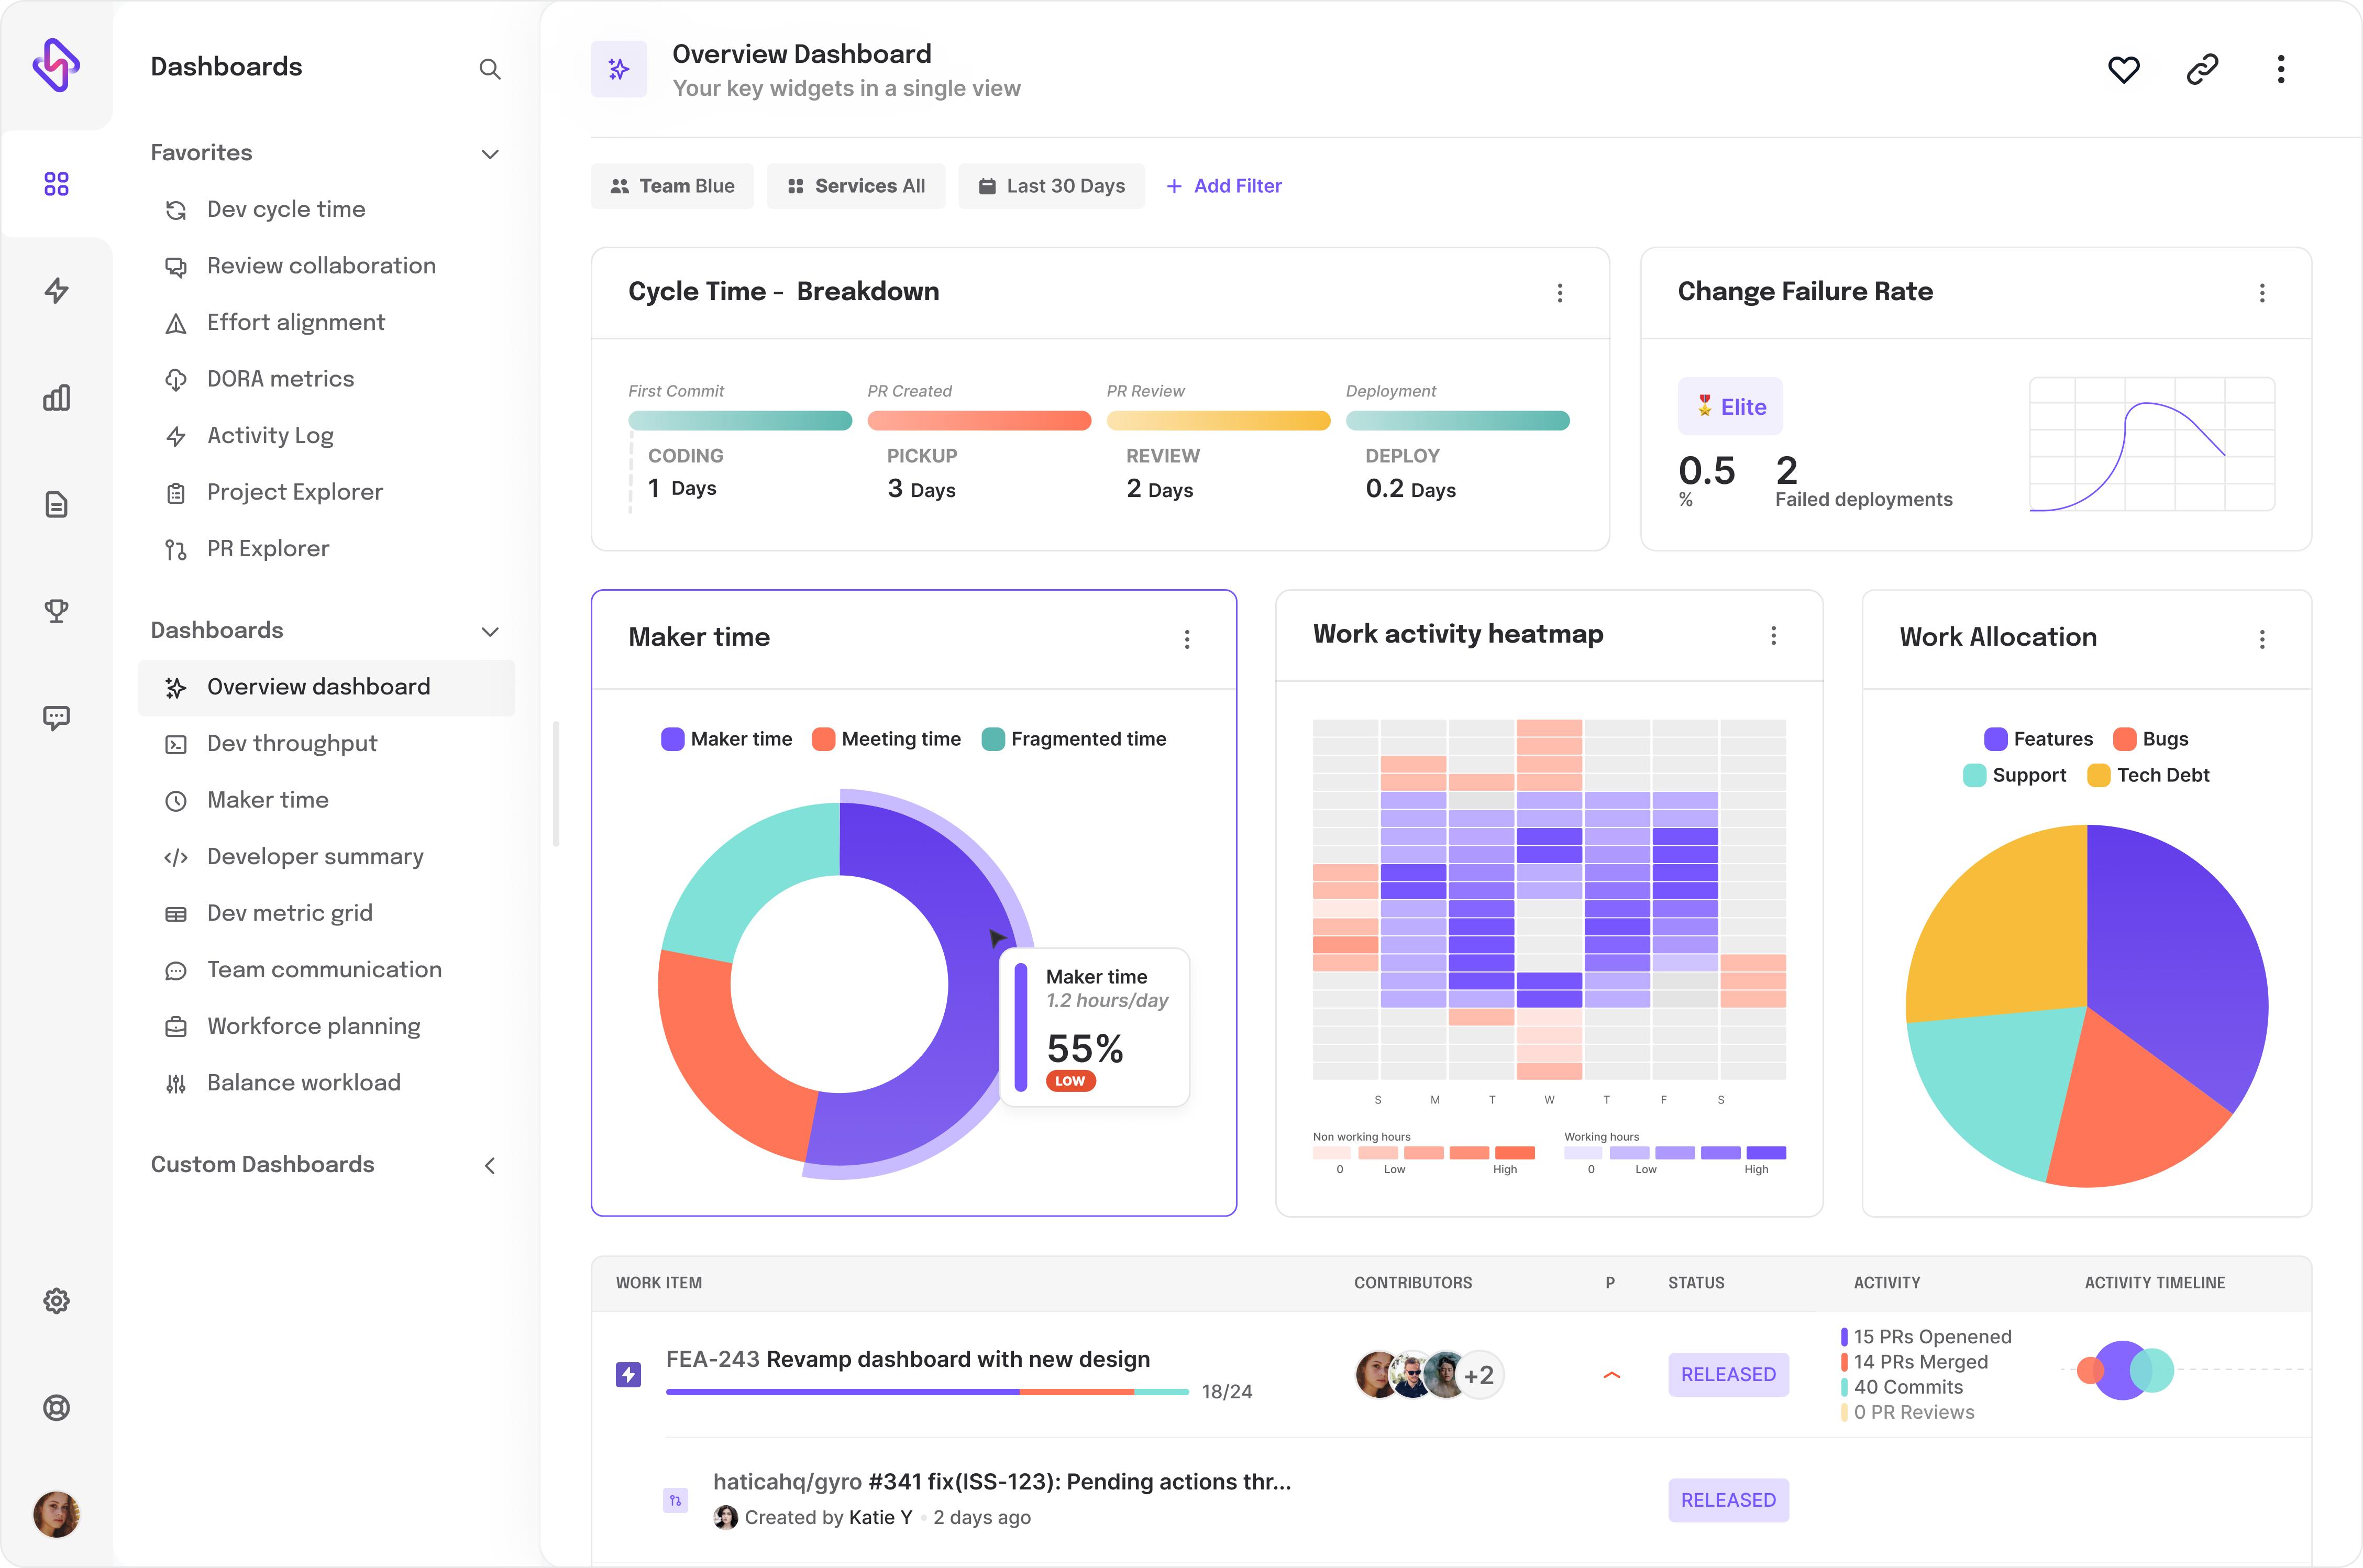
2. Work activity heatmap
A heatmap of work activity can help managers visualize and understand a developer’s or team’s work outside of regular work hours. This can help managers gauge how much and how frequently engineers have to work outside work hours and more importantly, this data can help answer why team members have to work too many hours. In many cases this data can identify process flaws such as poor collaboration across different time zones that lead to a developer waiting on a code review from a team in a distant time zone, or when developers have scheduled meetings at non working hours. Other times, this data can draw attention to the threat of burnout owing to cases where incident alerts or pages from Pagerduty that keep developers working at odd times.