
Software development costs an estimated 63% of a project’s budget, making developers and their work performances a center point of executive discussions. Initially, organizations resorted to a more mechanical approach of locating the work done by their devs- through average lines of code written or bugs fixed per day. However, the metrics don't convey the full picture of software development lifecycle.
Teams with high productivity and process efficiency have taken a more provocative approach by focusing on the ‘how’ of development- the developer behavior, collaboration patterns, code reviews, and team dynamics. Identifying and eliminating bottlenecks helps the team work on their core competencies and be more productive.
What is Developer Productivity?
It is difficult to visualize developer productivity in isolation. In the most broader terms, it is the amount of quality and reliable software developed efficiently by an engineering team. Most teams track it via assessing different metrics that indicate how well a team of developers performs against predetermined goals. These include time-to-completion, bug rate, developer experience, code coverage, and team collaboration.
Development processes can be evaluated based on those outcomes; however, they do not help manage developer productivity. Forsgren et. al’s SPACE framework, or Objectives and Key Results (OKRs) provides a practical and multidimensional viewpoint into developer productivity and proposes a new approach to defining, measuring and predicting it. The focus of all these approaches is developing and releasing software quickly while reducing the time to value and increasing return on investment.
Why Developer Productivity Metric is Important?
Developer productivity refers to the efficiency and effectiveness of software developers in completing their tasks and delivering high-quality code. It plays a crucial role in the success of software development projects and the overall performance of a software development team. There are several reasons why developer productivity metrics are essential:
1. Time and Cost Efficiency:
Improving developer productivity can significantly reduce the time required to develop and deliver software products. When developers can work efficiently and complete tasks promptly, it leads to faster project completion and shorter time-to-market. This, in turn, can result in cost savings for the organization.
2. Quality and Reliability:
Engineering for efficiency emphasizes speed and the quality of the code produced. By improving productivity, developers have more time and focus on writing clean, well-tested code that is less prone to bugs and issues. This leads to higher-quality, more reliable software and less likely to require extensive debugging or maintenance.
3. Team Collaboration and Satisfaction:
A productive developer team can effectively collaborate and work together. By improving productivity, developers can streamline their workflows, reduce bottlenecks, and enhance communication and collaboration within the team. This fosters a positive work environment, increases job satisfaction, and promotes teamwork, ultimately leading to better outcomes for the organization.
4. Meeting Project Deadlines:
Developer productivity metrics are essential for tracking progress and ensuring that projects stay on schedule. By having clear productivity metrics in place, teams can identify potential delays or issues early on and take necessary actions to address them. This allows for better project planning and enables teams to meet their deadlines consistently.
5. Innovation and Continuous Improvement:
Improving developer productivity also frees up time for developers to explore new technologies, learn new skills, and innovate. When developers have the bandwidth to experiment and think creatively, they can develop innovative solutions and drive continuous improvement in their work processes. This can lead to better products and competitive advantages in the market.
How to Measure Developer Productivity?
Global Code Time Report shows that only 10% of developers code for 2 hours per day, while 40% of them may spend around an hour per day coding. It is a clear indicator that managers cannot accurately calculate developer productivity based on the lines of code written in a day.
DevProd shouldn't be limited to outdated performance metrics. Instead, it is a holistic approach that factors work quality, customer feedback, collaboration, and flexibility. The aim is to identify and eliminate bottlenecks in the development process to boost developer performance. A Microsoft survey results show that developers report 49.4% output on good days. They can make significant progress on their coding tasks when working uninterrupted. A holistic approach would be to minimize interruptions for the engineering teams.
Additionally, a single metric cannot ensure the reliability and quality of the output. Therefore, it is essential to observe multiple indicators and focus on outcomes when assessing the productivity of engineering teams. We have mentioned the productivity metrics that you should analyze to build an effective DevOps Maturity Model and avoid dev burnout:
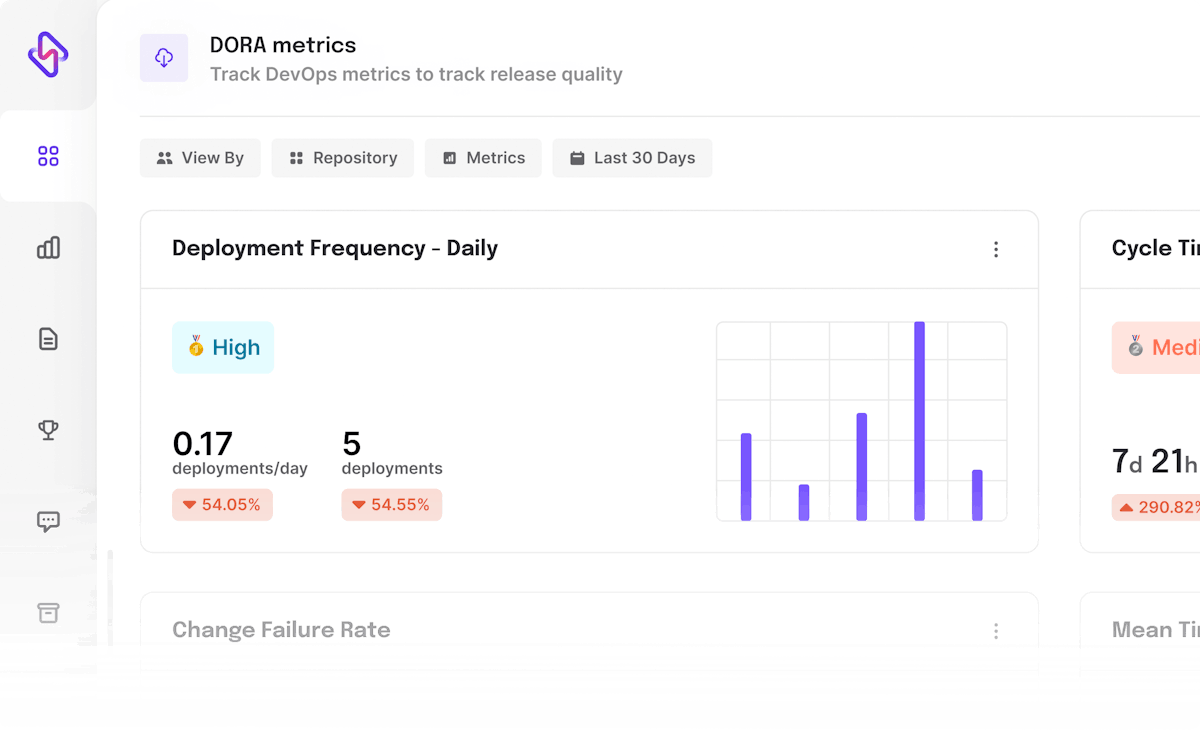
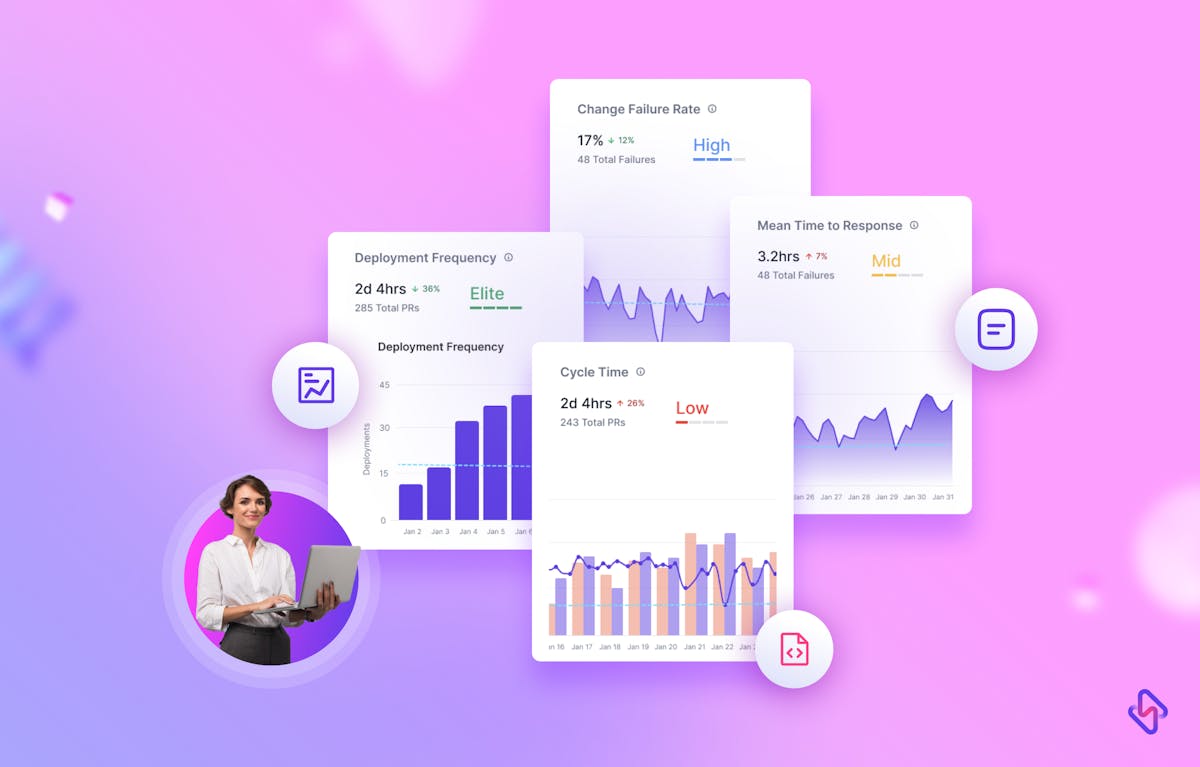
1. Deployment Frequency
Deployment frequency is a key metric of high developer productivity that measures how often code changes are deployed to production environments. It reflects the agility and speed of software development teams in delivering new features, bug fixes, and improvements.
A high deployment frequency indicates a fast-paced development cycle, enabling rapid feedback loops and continuous delivery.
This metric encourages efficient collaboration, shorter release cycles, and the ability to adapt quickly to changing user needs and market demands.