[

🎉

G2 Spring 2024 Report] Hatica does it again! Wins Momentum Leader, Best Est. ROI and Users Love Us badge among many!Read More ->

G2 Summer 2023 Report: Hatica Winning The Hearts, and Charts Again!

G2 Summer 2023 Report is out, and Hatica has outshined its competitors once again. With Momentum Leader, High Performer, and Leader spots in software development analytics tool category, Hatica leaves no stone unturned in driving engineering excellence.
G2 Summer 2023 Report: Hatica bags momentum leader

This summer is special for us as we have once again topped the G2 charts, and grabbed several #1 spots. 

G2 Summer 2023 Report mirrors our efforts as an engineering management platform in driving engineering excellence for development teams. It’s only our vision as a brand to instill data-driven conversations amongst engineering teams and build overall developer experience - that keeps the momentum going! 

I am not surprised why our customers and users love Hatica so much (as can be seen in the G2 Summer 2023 Report results) with our continued effort in enabling engineering teams to drive velocity, alignment and higher productivity. 

Highlights of Hatica’s Achievements in G2 Summer 2023 Report

Quarter-on-Quarter, our hearts are filled with happy customers, and phenomenal rankings. Our wall of fame shines  bright with:

  • Momentum Leader in the Momentum Grid® Report for Software Development Analytics Tools category
  • High Performer in Grid® Report for Software Development Analytics Tools category
  • Leader in Small-Business Grid® Report for Software Development Analytics Tools category
  • #1 for Likelihood to Recommend in Small-Business Grid® Report 
  • #3 for Relationship Index for the overall Software Development Analytics Tools category

G2 Summer 2023 Report Badges

We have been also ranked for: 

  • #1 for Price 
  • #1 for Productivity Updates
  • #1 for Historical Data Consolidation 
  • #1 for Analytics and Trends
  • Rated #1 for Ease of Use
  • Rated #1 for Testing Integration
  • #1 for Meets Requirements
  • #1 for Quality Support 
  • #1 for Likelihood to Recommend 

Momentum Leader in Software Development Analytics Tools: Momentum Grid® Report 

Hatica has been ranked a Momentum Leader in the Momentum Grid Report for Software Development Analytics Tool| Summer 2023. In an outstanding achievement, Hatica beats its key competitors Jellyfish and LinearB. We were also part of Momentum Grid in the G2 Spring 2023 Report as well.

Trending software development analytics tools in G2 Summer 2023 Report

This is a testament to our continuous efforts towards building a product that engineering teams love to use.

The ratings also include:

  • 97% of reviewers are likely to recommend Hatica 
  • 100% agree that the product is going in the right direction
  • 96% agree that Hatica meets their requirements

#3 for Software Development Analytics: Relationship Index  

This summer, Hatica bagged the #3 spot in the Relationship Index for Software Development Analytics. The report makes use of three parameters:

  • Best relationship 
  • Ease of doing business 
  • Customer support quality

We, as a team, achieved the feat of attaining the score of:

G2 Summer 2023 Report Hatica ratings

“Got an objective metrics-driven approach to measure engineering effectiveness. Hatica takes out the guesswork concerning engineering effectiveness so engineers can focus on what they do best. It is also easy to integrate and use. The dashboards bring several key metrics into a single pane of glass, and metrics can drive process optimization.”- Kannan G, mid-market. 

Leader in Software Development Analytics Tools: Small-Business Grid® Report 

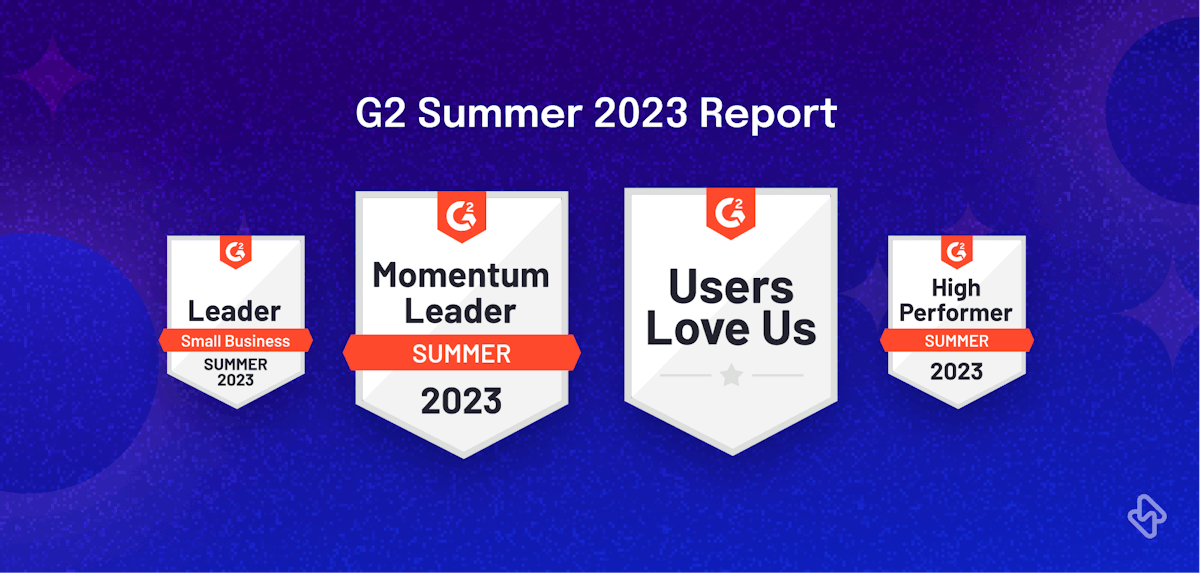
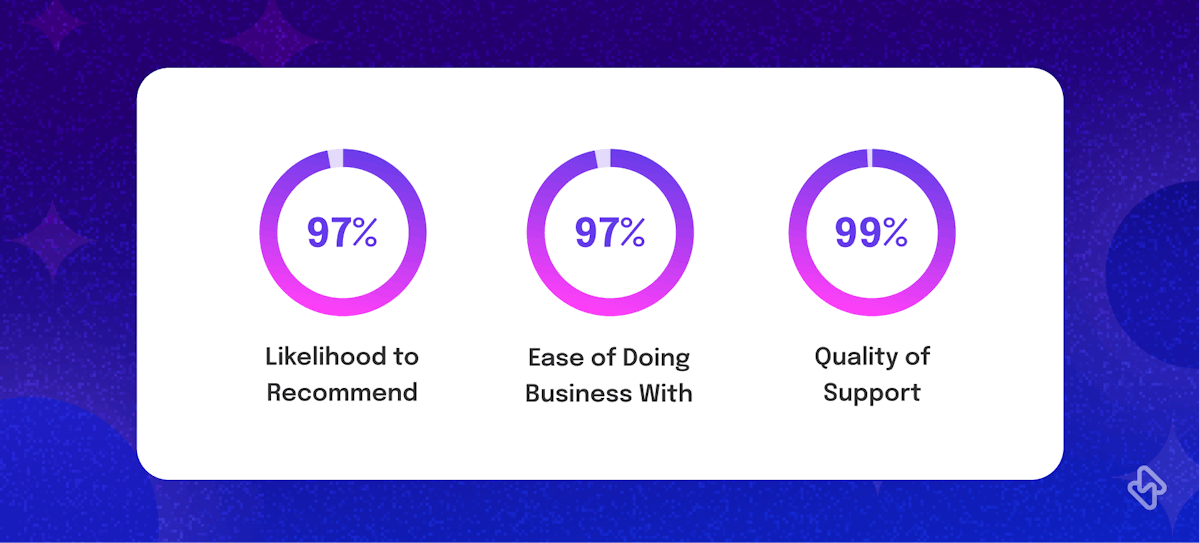
Hatica has also been recognized as a Leader in the G2 Small-Business Grid Report | Summer 2023. Our ratings are off the charts: 

  • 99% in support quality 
  • 96% in ease of use
  • 98% in meeting customer requirements and hitting the sweet spots 

What’s more is Hatica has received special mention for:

  • Powerful analytics and trends 
  • Historical data consolidation 
  • Productivity updates to meet user needs 

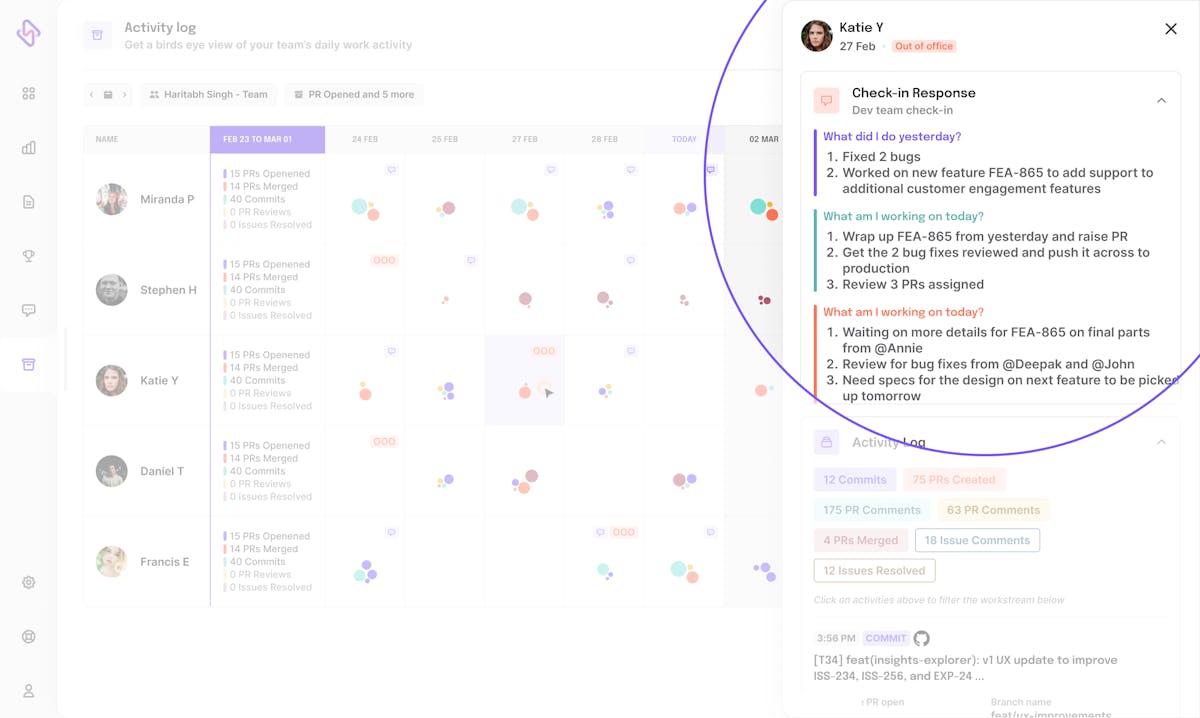
"Running lean teams comes with tight deadlines and overwork. We started using activity log dashboards and cycle time dashboards. These helped us look at work allocation in a better way and saw that there were imbalances. Fixing those helped us move onto how long we spend on development and deployment."- Verified user, small business 

Check out other Hatica reviews on G2 here. 

Our Past Achievements

It’s been three years since we are winning users' hearts, and registering several wins every other day. We have previously bagged the Users Love Us badge, and were ranked #1 in numerous G2 reports for: 

  • #1 for Productivity Updates
  • #1 for Analytics and Trends
  • Rated #1 for Ease of Use
  • Rated #1 for Price
  • Rated #1 for Testing Integration
  • Rated #1 for Data Context
  • #1 for Meets Requirements

Read: Hatica Ranked #1 Momentum Leader in G2 Spring 2023 Reports

Hatica: The #1 Engineering Management Platform for Software Teams 

These accolades are stepping stones for us to drive engineering transformation—erase work silos, maximize ROI, optimize operations, and scale business values, and results. An engineering management platform like Hatica takes care of all moving parts of the software lifecycle- from writing the first code piece, to reviewing, and pushing it to prod, and building the final application. 

Engineering leaders today know the value of data-driven engineering insights for continuous improvement. Hatica equips engineering leaders with workflow visibility, identify blockers, understand resource allocation and distribution across projects and map ROI to the cost/effort involved while aligning the engineering team’s overall effort to the business goals. This way engineering leaders can make informed decisions, and use data to drive transformation. 

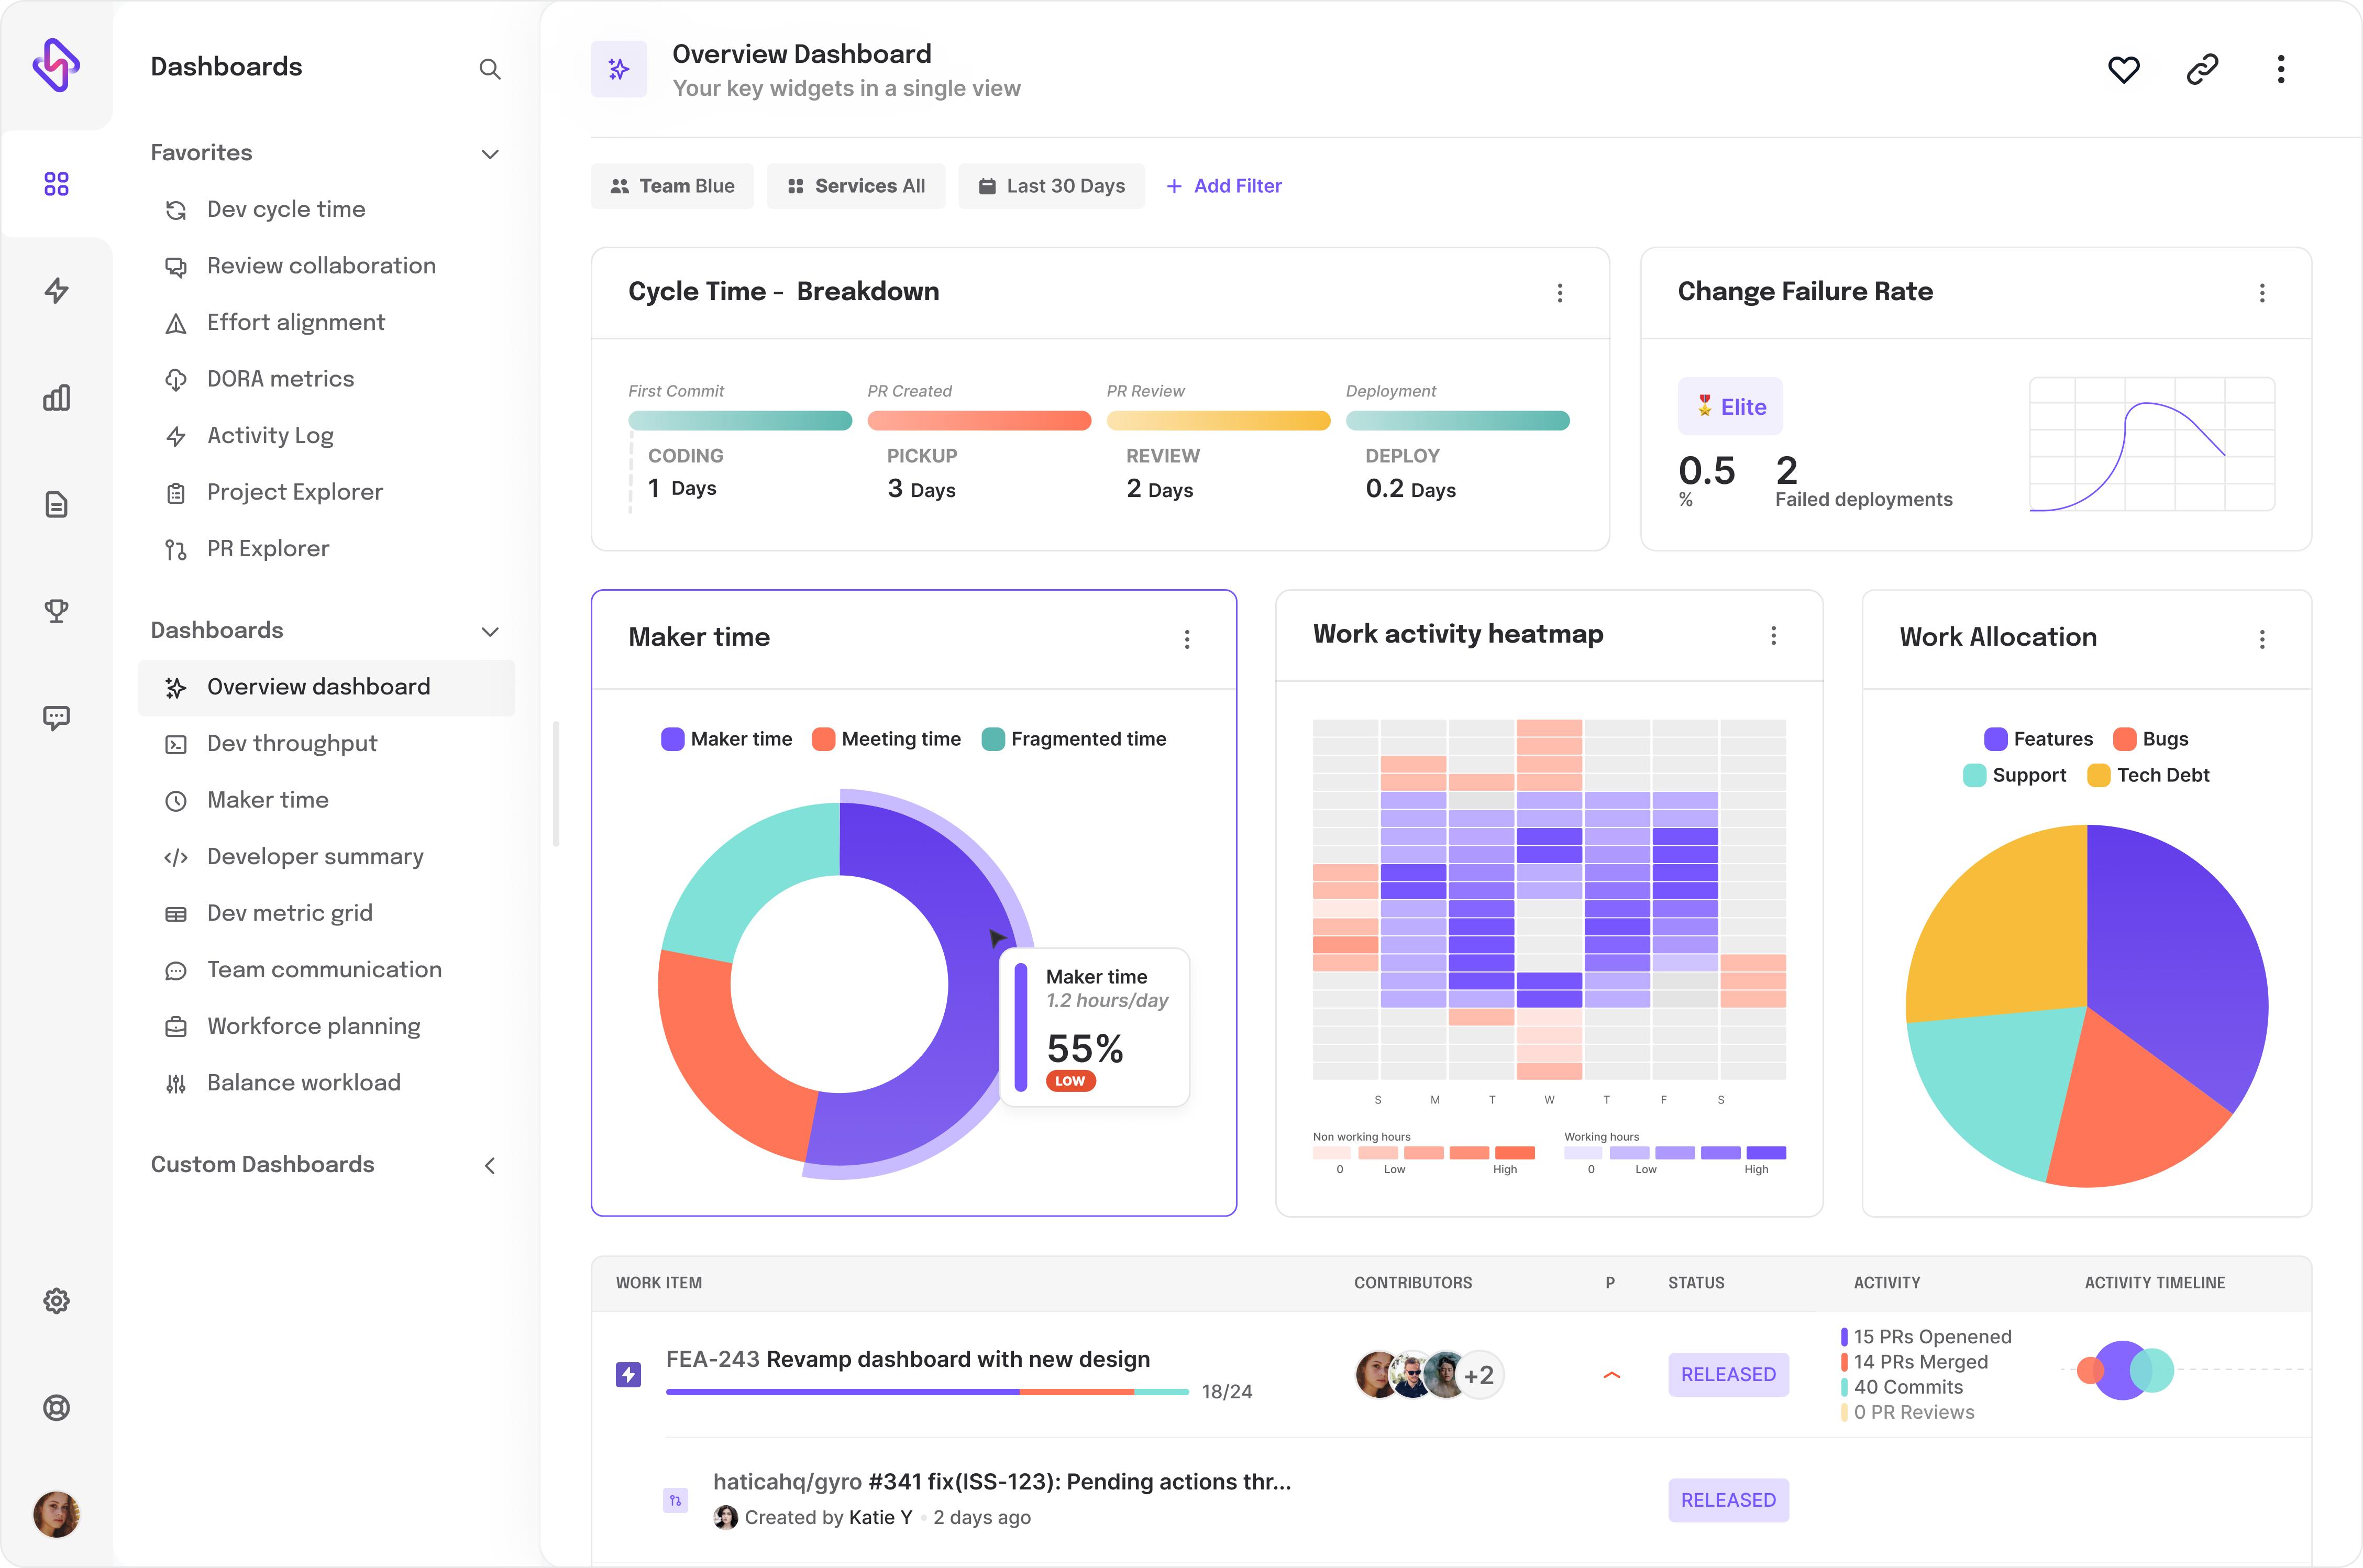
Each cog in the engineering wheel is crucial to drive success, and we take care of it all through our 13+ data-rich dashboards, and 130+ engineering metrics, with relevant context to help you sail through the complexities of the software development lifecycle. 

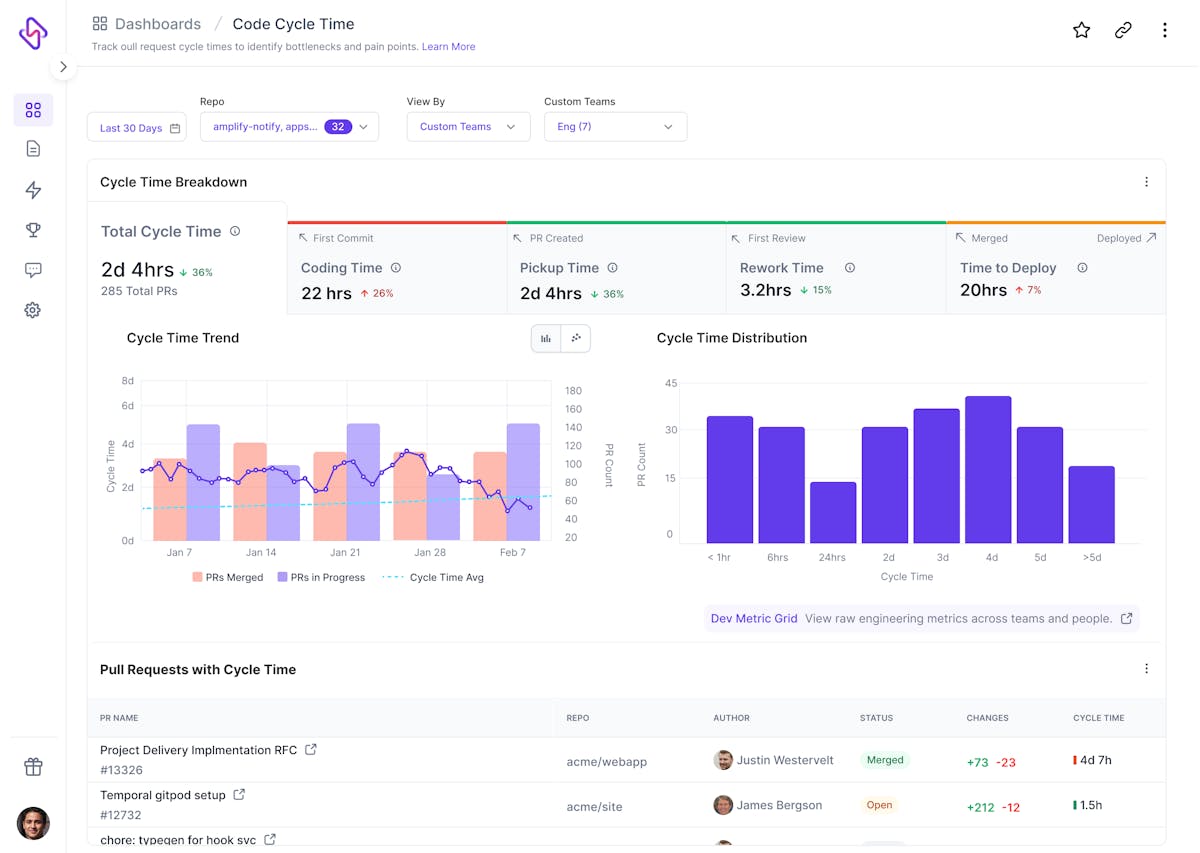
Quoting a few cool dashboards, Hatica’s Dev Cycle time dashboard helps teams rationalize their development velocity by unclogging the SDLC cycle, refine operational management, and fix foundational bottlenecks, like unproductive code churn, painful code reviews, and higher code complexity. In the last three years, our customers have seen 50% improvement in velocity, 3X faster project deliveries, and super sustainable pickup time. 

Hatica's cycle time dashboard

As stated already, we take care of all moving parts of an SDLC equation. Our well-being dashboard is designed to empower devs in doing their best work without compromising on work-life balance, well-being, and health. At Hatica, we strongly believe that satisfied and happy individuals  means more productive teams! With this dashboard, the data collated can serve as a power source for engineering teams in fighting burnout, locate outside work hours, and streamline workload balance per developer.  

Developer well being dashboard

Our async standups have supported engineering teams in taking remote work towards the new paradigm of productivity. With Hatica check-ins, managers can conduct async standups, track daily work items, and stay in loop of all team efforts, needs, and concerns thus allowing developers to work at their preferred time and still make their work-progress made available and accessible to everyone in the team. Isn’t that cool?

Hatica activity log with check-in response

Drive Your Engineering Success with Hatica

We are entering our fourth year now, and the journey isn’t going to be easy. As engineering teams grow, scale and build innovative products, they identify more complexities and need for moving past these faster. But with a passionate team, and supportive users, we are continuously striving for your and thus our success!.

Quoting LinkedIn’s Jeff Weiner—Data powers everything we do. However, the tech industry lags far behind when it comes to digging deeper insights out of it. That’s where engineering analytics comes in— transforming raw data into actionable insights and meaningful contexts, so teams can reduce foundational blockers hampering their productivity. So, next time your cycle time is high, or planning accuracy is below expectations, read through the analytics dashboards and garner enough understanding to plan next steps. 

Without a doubt, engineering  analytics is the key to successful teams that deliver business value with limited resources. With 360 degree data insights into team’s workload, contributions, and processes, an engineering analytics platform ensures high business benefits, more room for growth, and innovation, mature IT processes, and high developer productivity. 

Data-driven teams are the future of software engineering, and it’s time for tech teams to suit up, and use it to leverage engineering excellence. 

Subscribe to Hatica's blog

Get bi-weekly insights straight to your inbox

Share this article:
Table of Contents
  • Highlights of Hatica’s Achievements in G2 Summer 2023 Report
  • Momentum Leader in Software Development Analytics Tools: Momentum Grid® Report 
  • #3 for Software Development Analytics: Relationship Index  
  • Leader in Software Development Analytics Tools: Small-Business Grid® Report 
  • Our Past Achievements
  • Hatica: The #1 Engineering Management Platform for Software Teams 
  • Drive Your Engineering Success with Hatica

Ready to dive in? Start your free trial today

Overview dashboard from Hatica