[

🎉

G2 Spring 2024 Report] Hatica does it again! Wins Momentum Leader, Best Est. ROI and Users Love Us badge among many!Read More ->

Team Building2024-03-14

A Guide for VP of Engineering to Build A Data-Driven Engineering Culture

Here's a VP of Engineering's Guide to identify the metrics that matter most, and effectively articulate how engineering initiatives directly contribute to revenue growth, customer satisfaction, and overall company success.
VP of Engineering's Guide to Crafting a Data-Driven Engineering Culture

Regardless of your leadership role, data is a valuable tool for assessing your team's health, allowing you to identify and address issues, and empowering engineers to excel in solving complex problems.

For a VP of Engineering, measuring how effectively your engineering team is delivering can be tricky in a world filled with constant changes like PaaS, GenAI, and containerization. While it's common to take on customer-focused projects, it's not always clear how they impact the business's bottom line.

When talking to VPs of Engineering about their efforts to improve profits, we often see detailed project plans. However, there goes full silence every time the questions turn to: how these engineering projects are progressing, or what is the ongoing ROI of their engineering investment.

Simply moving projects forward doesn't guarantee increased revenue, higher profits, or a stronger market position. Today's engineering teams face scrutiny for key metrics like engineering effectiveness, delivery velocity, and innovation pace. Balancing these factors while optimizing developer experience is the responsibility of the VP of Engineering.

In software project transformation, VPs of Engineering should focus on making a real impact. 

This means that they must champion a shift to impact-driven leadership, prioritizing scalable projects, building faster MVPs, and measuring the value created.

Most importantly, they need to foster a data-driven engineering culture.

Today, let's talk about crafting a data-driven engineering culture, figuring out how a VP of Engineering can measure success, looking at engineering metrics, and making sure these metrics are heading in the right direction. But first, let's understand the problems leaders face without data. 

The Importance of a Data-Driven Approach for a VP of Engineering

A robust data-driven approach acts as a reliable compass for a VP of Engineering’s leadership journey. Think of your leadership journey as a voyage. Using a data-driven approach is like having a helpful compass that not only points the way but also shows what's coming up ahead. It's a bit like having an experienced guide when sailing through tricky waters full of uncertainties, opportunities, and obstacles. By providing useful information consistently, the compass simplifies decision-making.

This special compass doesn't just show the final destination; it also helps the VPE understand their team better. It highlights where the team works well together, spots areas for improvement, and reveals how productive the team is. Think of it as a guiding light that brightens up the specifics of the team's strengths and areas for improvement.

Operating without a data-driven foundation comes with its fair share of risks. Firstly, there's the challenge of invisible delivery from your engineering team. The progress of software development might stay hidden until a new product or feature is released, leading to questions about the team's workload, timelines, and output in leadership meetings. This lack of visibility makes it trickier to coordinate with other business departments.

Then, there's the issue of risky decision-making. Informed decisions within the organization are crucial for safeguarding market share. Without data guidance, decisions can become uninformed, potentially resulting in costly mistakes, misallocation of resources, and a deviation from actual needs.

Lastly, there's the risk of lacking confidence in the boardroom. Expressing performance results and staffing needs without empirical data may face resistance when securing resources.

Now that we've emphasized the importance of a concrete data-driven strategy, let's explore the metrics a VP of Engineering should consider to stay on track.

What are the Metrics That Drive Success For a VP of Engineering?

The VPE is the face of engineering in an organization and orchestrator of business transformation through software projects. They aim to position themselves and their teams as pioneers in the ecosystem, shaping the future of engineering.

A VP of engineering stands at the crossroads of technical expertise, business strategy, and people leadership. Hence, it becomes important to keep an eye on the right metrics to succeed in these three areas.

Therefore, here we've gathered the top software metrics and KPIs that VPEs could track to make informed decisions, acknowledge engineering work, and define success for their teams: 

1. Financial Metrics 

Financial prudence is the new battleground of the VP of engineering. With the rise in uneven engineering demands, the cost of developing and scaling software too is spiking exponentially, making it imperative for VPEs to track how much resources are spent on each engineering project, and whether they improve the breadth of the bottom line. 

The ideal financial metric that VPEs must take into account is business value created, i.e. Return on Investment (ROI) - the impact of engineering efforts on revenue growth, and bottom line. A high ROI means more resources are now available to serve real users, thus improving platform speed and reliability. 

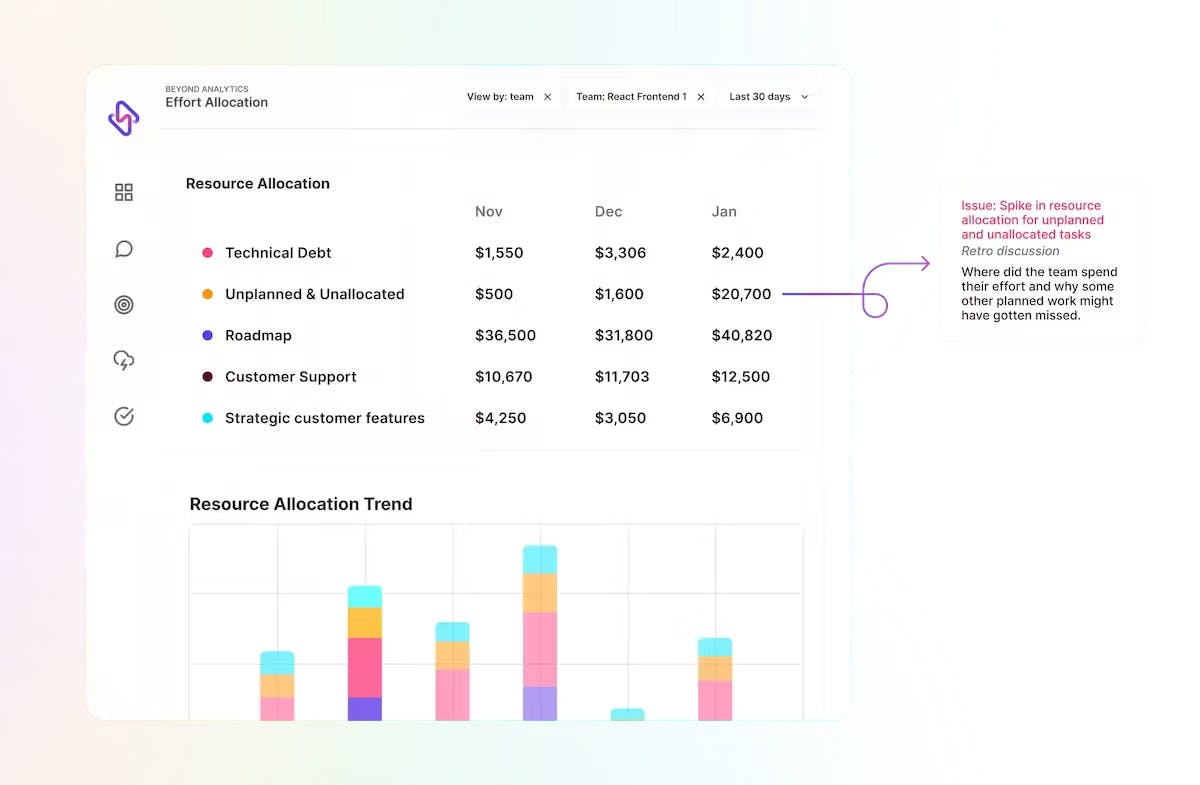
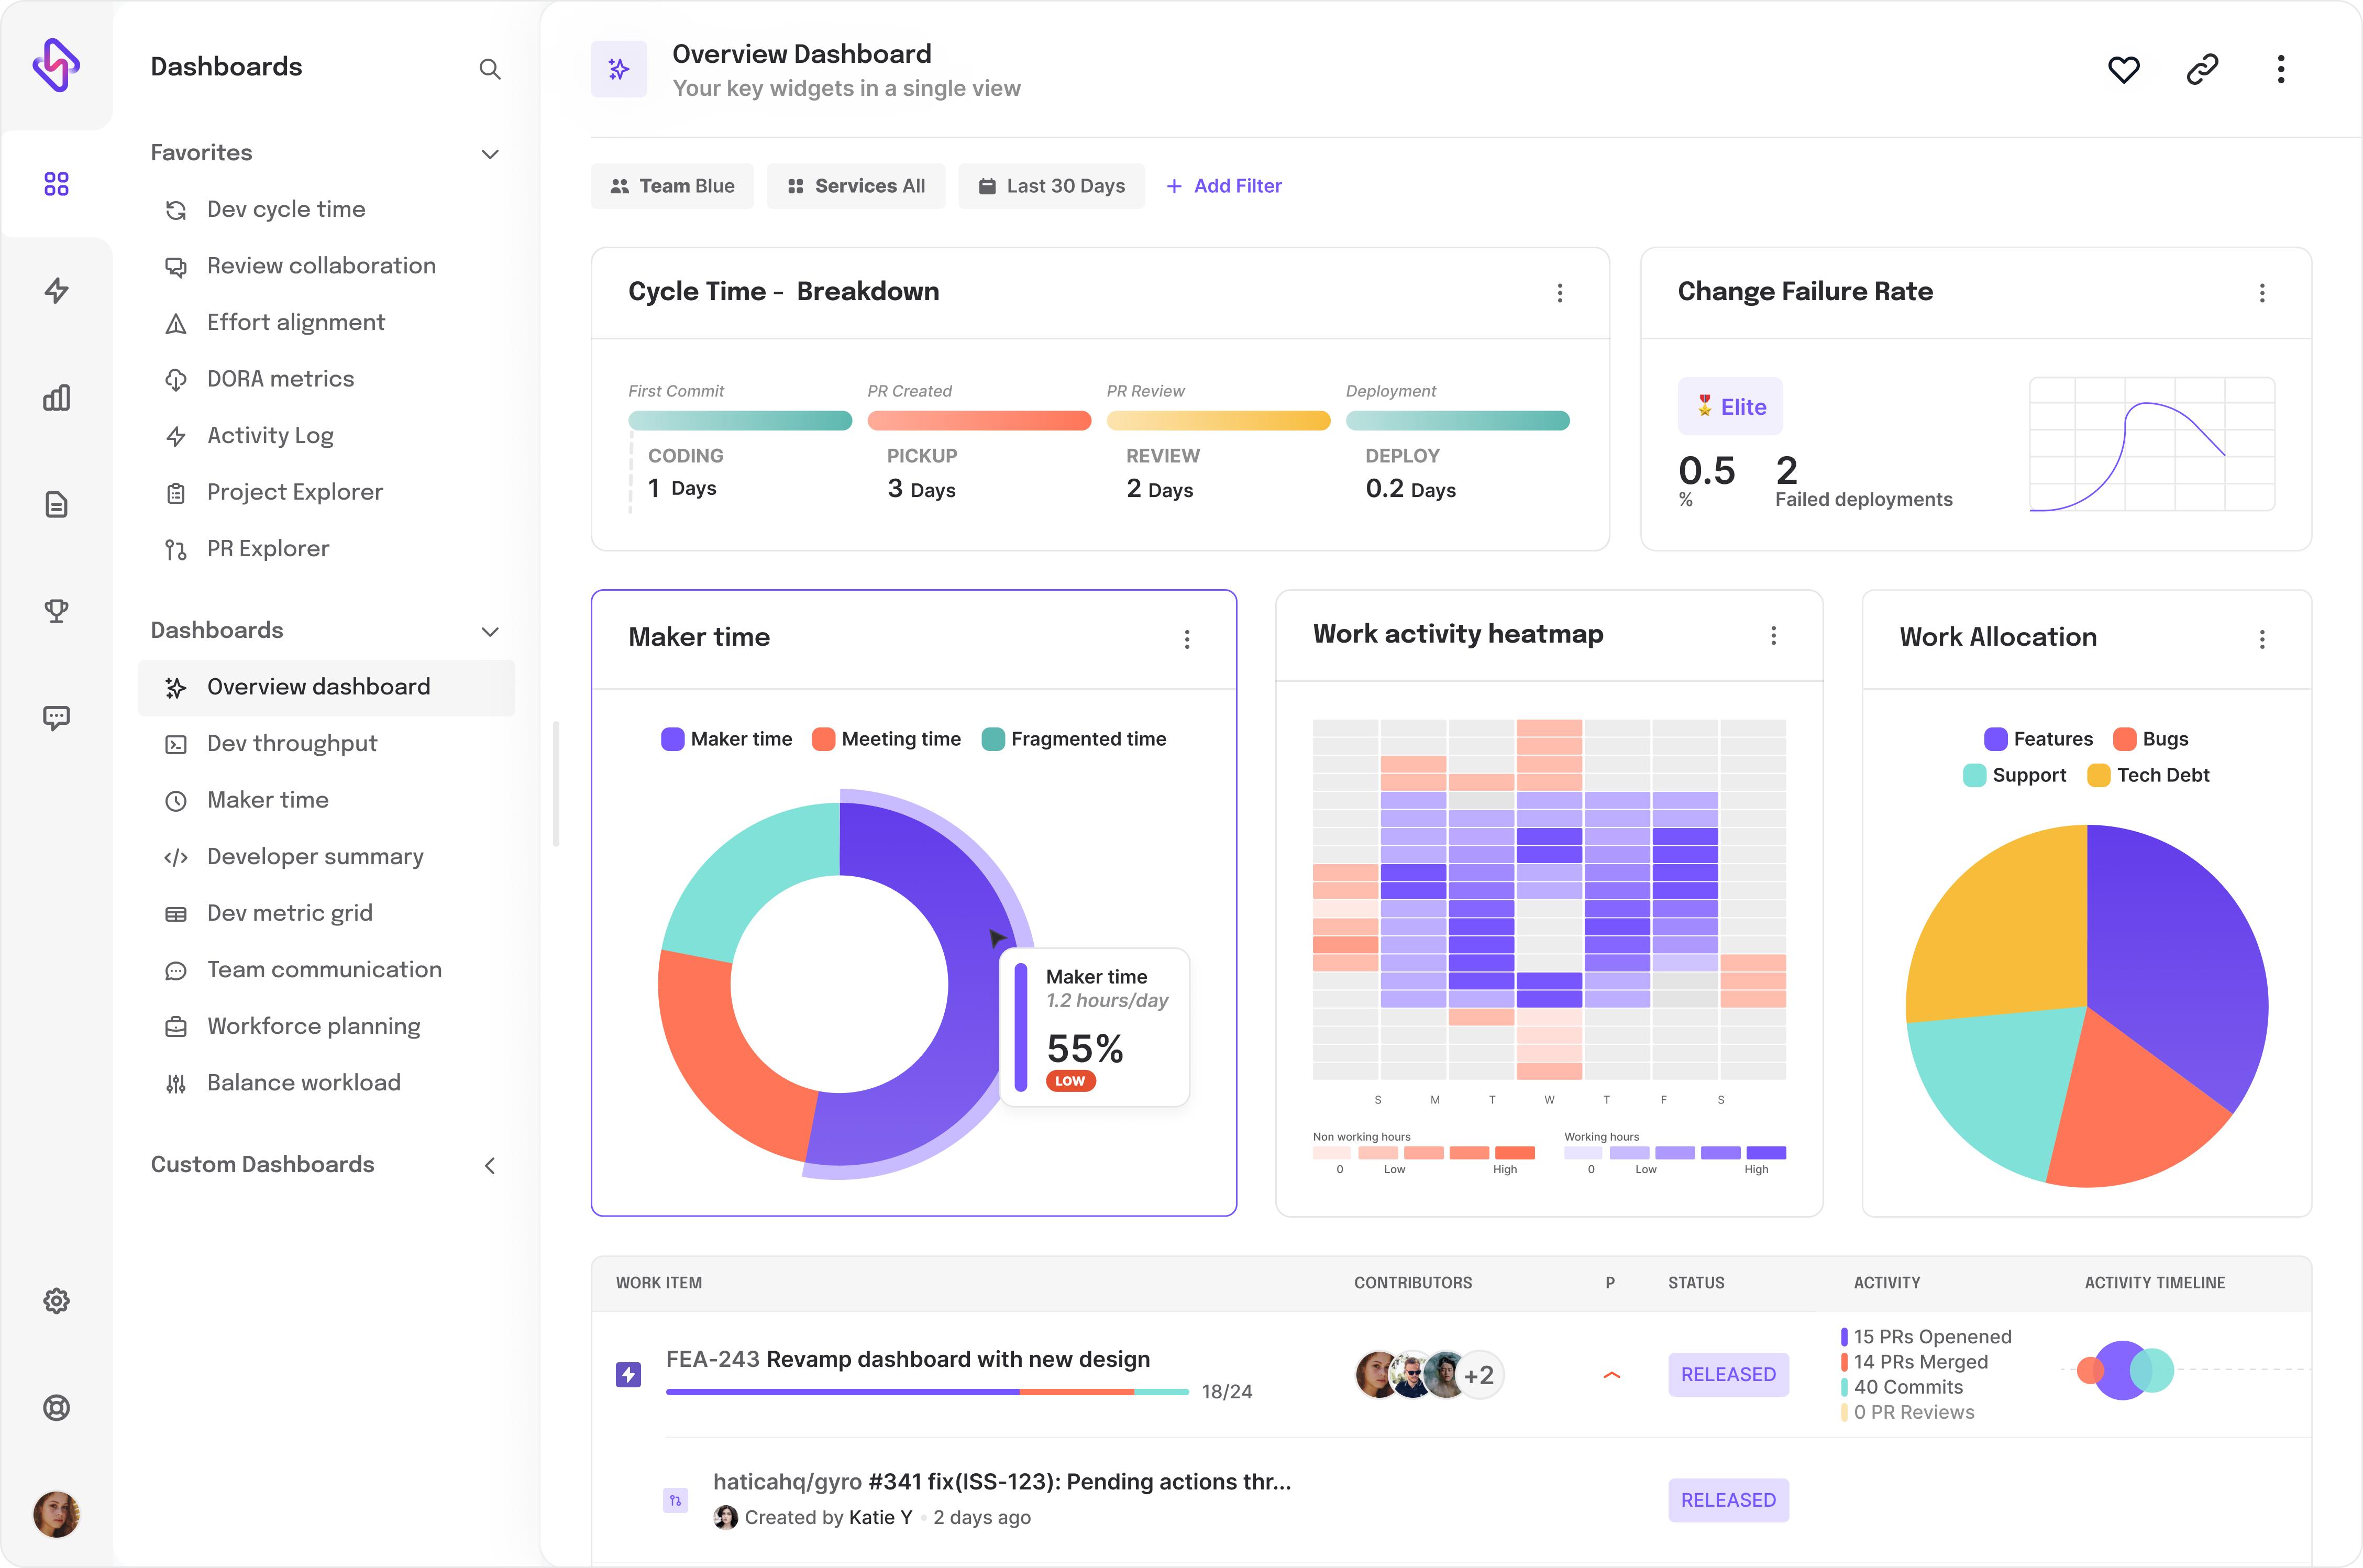
Hatica’s engineering management platform helps VPEs track, and even improve the ROI on engineering projects by understanding how much resources are being spent on the project, flagging underutilized resources so they can be allocated to the roadmap, and capitalizing R&D investments so they don’t become a drag on bottom line.

2. Customer Satisfaction

Have you ever heard a VP of Engineering boasting about the impeccable efforts his Director of Engineering and team puts into delivering high-quality products and projects? 

The chances are that he has received a good word from a customer lately. That’s the importance of a happy and satisfied customer. 

Customer satisfaction as a metric helps engineering, and business teams to align to projects delivering maximum value to customers in real-time. Moreover, it helps VPEs to justify the engineering investments to CTOs, and later to the board members who are looking to bring down costs on all fronts

Satisfied customers lead to repeat business, referrals, and ultimately, revenue growth. Understanding their pain points helps prioritize engineering efforts towards features and improvements that directly impact their happiness. 

The true success of an engineering team lies in how fast they can respond to customer needs and create the best possible experience. Quantifying CX is one hell of a challenge for a VPE, but here are a few metrics to track so you have a complete picture of the relationship customers have with the product developed: 

  • Net Promoter Score (NPS) surveys to understand, and improve customer loyalty and willingness to recommend your product.
  • Customer Satisfaction Score (CSAT) gauges satisfaction with specific interactions or experiences.
  • Effort score measures how easy it was for customers to interact with your product or support.
  • Customer churn to quantify the number of customers who cancel their subscriptions or services.

These metrics together are good indicators of ease of onboarding, product adoption, and stickiness of the customer with the product over a period of time. 

And this has been possible because of an engineering team whose efforts are well aligned with business goals, handling tech debt, and balancing it off with new initiatives and R&D. 

3. R&D Investment and Effort Distribution

As a VP of engineering, understanding where your R&D resources are going is crucial to drive transparency and bring strategic, and long-term alignment between engineering efforts and business priorities. 

As an engineering leader, this is only going to help you streamline efforts and maximize ROI for those efforts.

This metric is crucial for any growing engineering team, be it mature startups, or large-sized legacy organizations. But why? 

R&D is often the largest chunk of investment in an engineering budget, and C-suite executives need to see a strong return on investment for those dollars spent, and how it makes balance sheets healthier, and bottom lines stronger. The signal helps you understand the investment-effort breakdown of engineering activities: 

Feature vs. infrastructure: Are we building customer-centric products or just laying the foundation for one, is the resource utilization aligned with business expectations. 

Hatica's Resource Allocation Dashboard
  • Acquisition vs. churn: What we are building - is that going to attract new users or keep existing ones happy (thus just preventing churn)?
  • Spends over consecutive releases: Understand how much engineering efforts and investments are made in the ongoing release vs the previous one

The data gives a clear picture of whether there’s a chance or need to rightsize your engineering structure, cut corners wherever possible, and drive discussions around project prioritization, resource constraints, etc.

Once we have figured out the Alignment within an engineering organization, the next important metric to keep a close watch is Velocity. This is probably one metric that concerns everyone from a CTO to a developer in the team. 

4. Release Velocity

In today’s cut-throat competition of staying relevant, and delivering to customers consistently, even a delay of a few days/weeks means losing out to your competition, or worse, facing the risk of going obsolete. Despite this, many VPEs have little idea of how they measure up in this area: the speed of software development

Gartner’s CIO agenda report has been very vocal about how slower releases impact value delivery. 59% of digital initiatives take longer time to complete than what VPEs expect, while 52% of these projects take way too long to deliver the expected value. 

Measuring release velocity is one way to combat the phenomenon of delayed releases. It is the rate at which your team can successfully deploy new features or updates to production and directly correlates to your team’s ability to outperform the market, improve the customer experience, and accelerate innovation-led value delivery.

But how to measure release velocity for your engineering endeavors? Track release velocity using: 

  • Number of releases to capture how frequently you deploy new features or updates.
  • Deployment lead time measures the average time it takes to go from code commit to live production.
  • Release size includes the number of features, lines of code, or complexity of the changes included in each release.

Now that you know how to measure release velocity, how do you accelerate it to maximize the positive impact you create for customers?

Well, I am going to call out Hatica in this regard quite unapologetically. Hatica helps you aggregate data from all your work tools — VCS, project management, and communication tools to quantify engineering activities and gain deeper & complete visibility into your engineering processes so you can pinpoint where exactly your processes fell apart, and course correct using actionable data. 

5. Cycle Time 

Agile enthusiasts love cycle time for a reason. It's not just about measuring how long a task takes; it's about understanding the flow of your development process, and where exactly your workflows are blocked: is it an IC issue or a team issue, are code reviews slow, or whether devs are struggling to spent time on roadmap tasks over bugs and KTLO.

Cycle time is usually measured as the average time it takes for a single feature to progress from start to finish (e.g., ideation, development, testing, deployment). You get a panoramic view of your engineering efforts, seeing how work truly flows through the entire SDLC.

For Haticans, cycle time is our go-to metric, and we have a full-blown reason for it! A high cycle time for us means somewhere we might be failing to institutionalize best practices, and the integrity of our engineering processes is somewhere broken. 

Hatica's Dev Cycle Time Dashboard

The metric helps us plan with confidence by predicting delivery dates with greater accuracy, benchmark our cycle time to industry standards so we can continuously iterate, and improve, and most importantly spot areas slowing down our workflow, so we can deliver to our customers without fail.

Having looked at Alignment and Velocity - two of the four important pillars of engineering productivity - let’s take a look at Process and People Health. 

6. Security Metrics

Tracking security metrics is a shared effort between VPEs and CISO. However, there is quite an overlap between these roles in small and mid-size organizations. Engineering organizations have been bleeding money ($10.3 billion in 2023) due to a lack of security measures and future-proofed processes. Do we need any more reasons to undervalue security signals? 

The two security metrics you can rely on as a VPE are: 

  • Average patch rate: How fast are you plugging security holes? Track the time from patch release to deployment across business units. Faster patching equals reduced risk and higher customer confidence. 
  • Scan coverage: Shows what percentage of your systems you're actively scanning for vulnerabilities. Low coverage means you might be missing critical security gaps, leaving you vulnerable to unknown threats. 

7. Availability and Reliability

Every VP of engineering understands the critical impact of downtime. In 2023, organizations saw an average loss of $450,000 per outage, highlighting the importance of building trust and reliability within their systems.

Reliability is the signal of your operational performance and resilience and is the likelihood that the software can perform consistently under different circumstances. It also helps VPEs communicate risk realities with CTOs, and understand where extra resources and efforts are required. 

Tracking “reliability” and in this also availability, means: 

  • Having a data-driven methodology to predict, anticipate and prevent potential issues before they disrupt your customers.
  • Working as a heatmap for your software’s health to identify critical areas for improvement 
  • Streamlined development by prioritizing fixes effectively, avoiding regressions, and optimizing resource allocation for maximum impact.
  • Delivering a rock-solid customer experience, free from unexpected hiccups, and watching loyalty soar.

The key reliability metrics include: 

  • Defect Rate: Tracks the number of bugs discovered relative to code size. A decreasing defect rate suggests improved development practices and higher-quality software.
  • Change Failure Rate: Indicates the percentage of changes causing production issues. A low rate signifies stable deployments and reliable code releases.
  • Mean Time Between Failures (MTBF): Shows the average time between system outages. A high MTBF translates to reliable performance and minimal disruptions.
  • Mean Time to Resolution (MTTR): Measures the speed of bug fixes and reflects your team's responsiveness to issues. Lower MTTR means happier customers and less downtime.
Hatica's DORA Metrics Dashboard

I did cover some of these metrics in my previous blog on Measuring Engineering Effectiveness and ROI as a Director of Engineering as well. But in my experience when it comes to maintaining processes and people health, both of them share the concerns and ensure that no scope is left out in running an efficient system with productive people. 

You can also read the blog here to see how the overall productivity of the engineering team can be backed by data-driven insights using Hatica. This reminds me of the quote by a friend and CTO at Amenify - Danish who calls this out: 

Hatica gives Danish Chopra from Amenify the visibility into engineering teams

Bottom Line: Applying Metrics & KPI For Growth and Scale 

True business enablement in engineering goes beyond just shipping softwares on time. It's about delivering solutions that not only meet timeframes but also surpass quality expectations, and are in sync with executive-customer expectations. 

As a VP of Engineering, leveraging metrics and KPIs is your secret weapon. It's not just a way to show commitment to stakeholders; it's a testament to the perfect synergy between business and engineering. Plus, it sets the stage for cultivating a culture of high-performing engineering teams – a true mark of success in your role.

Being a VP of Engineering isn't just about steering your team; it's about paving the way for other engineering teams in the ecosystem. These metrics are your starting point, sparking data-driven conversations and laying the foundation for engineering excellence.

Enter Hatica – your toolkit for actionable insights.

Hatica equips VPs with the actionable information they need to make informed decisions, optimize resource allocation, and drive superior software quality. It’s time to future-proof your engineering team with our engineering management platform, so you: 

Stop drowning in data, start leading with clarity.

If you are a VP of engineering struggling to measure engineering effectiveness for your team, please feel free to reach out to us and our productivity experts can help you guide your way through. 

Subscribe to Hatica's blog

Get bi-weekly insights straight to your inbox

Share this article:
Table of Contents
  • The Importance of a Data-Driven Approach for a VP of Engineering
  • What are the Metrics That Drive Success For a VP of Engineering?
  • 1. Financial Metrics 
  • 2. Customer Satisfaction
  • 3. R&D Investment and Effort Distribution
  • 4. Release Velocity
  • 5. Cycle Time 
  • 6. Security Metrics
  • 7. Availability and Reliability
  • Bottom Line: Applying Metrics & KPI For Growth and Scale 

Ready to dive in? Start your free trial today

Overview dashboard from Hatica