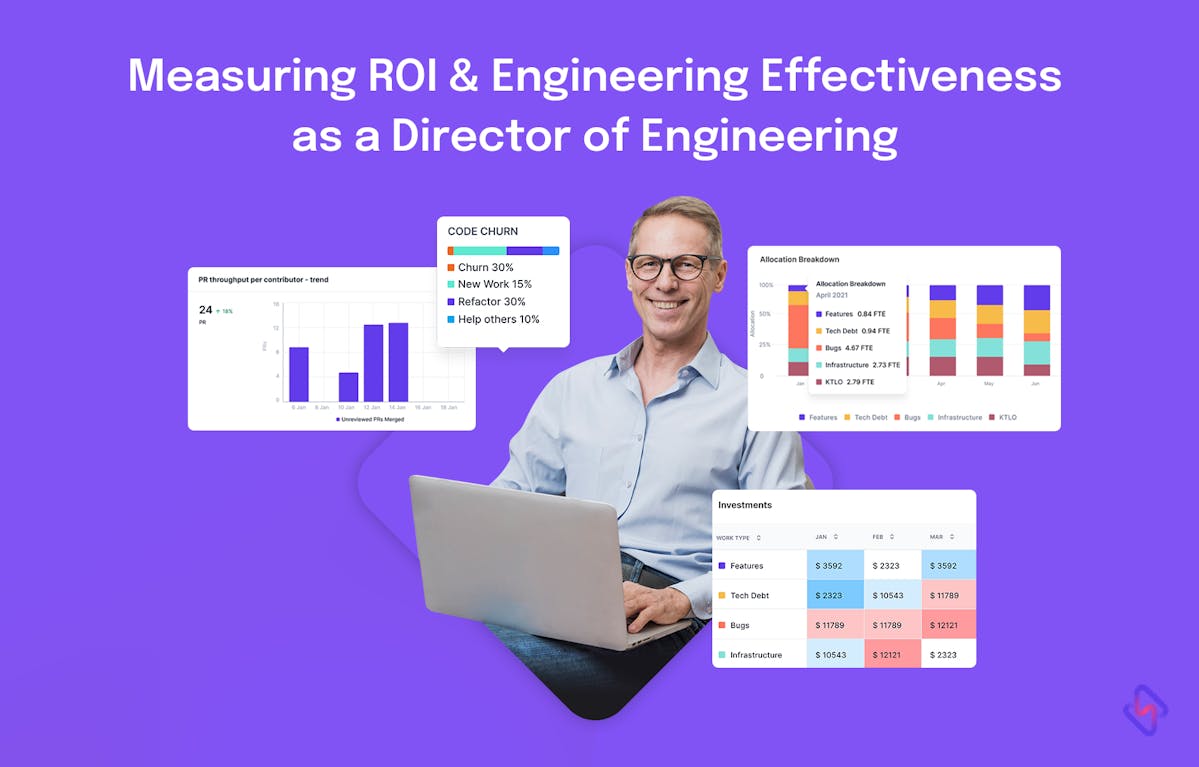
How can we ship better software faster?
One question that is encountered by every Director of Engineering in their conversations with both the ground team, and C-sec executives. The premise can be different but the question persists and often without a concrete answer.
These conversations often fall short of making any tangible difference - primarily because of a lack of quantifiable, leading, and actionable metrics crucial to spot bottlenecks, or map engineering efforts with business goals, or reduce development costs.
This lack of data topped with lack of workflow visibility is antithetical to the role of an engineering director – who is directly responsible for tracking, monitoring, measuring engineering effectiveness and delivering for overall engineering success.
Powerful leaders have historically backed their decisions with objective data, and that's where this blog comes in. In this blog we are going to walk you through key engineering KPIs and metrics that help define success for a Director of Engineering. This will give you a preview into metrics and actionable KPIs (derived from these metrics) that you must track and communicate to your team. We'll break down the blog into:
- How to define success with these engineering metrics by connecting the dots between data and team performance.
- Their impact on your engineering squad, and how data insights drive improvement.
- Objective tracking methods to leave no room for guesswork here
But, before we dive into the nitty-gritty of success metrics, let's take a quick detour to understand your role as a DOE.
Director of Engineering - The Role - Bridging Gap Between Development Teams and Leadership
A director of engineering is the architect of any organization's software strategy, and truly the voice of engineering.
But, how?
They translate the impact of engineering efforts into business outcomes, keep the teams under their purview productive and aligned, and ultimately deliver on goals set by the executive leadership.
Stepping into the role means bringing alignment into engineering teams by breaking down work silos, ensuring everyone understands the project's roadmap, and bringing clarity, and communication, between engineering, and business teams.
As much as alignment is a vital KPI for a DOE, they also have to juggle a high-wire act: Balancing delivery velocity, and software quality to produce bug-free, customer-centric and sustainable product in a given frame of time. The best of both worlds ensures that DOEs are able to maintain the pace of innovation, and keep their product ahead of the curve.
Over and above that, a thriving team fueled by high focus time is a DOEs' greatest asset, and they are responsible for maintaining it consistently working towards people's health. They invest in developer experience, to build an engineering culture of high focus time to their devs and address burnout before it becomes a performance drain.
The buck doesn’t stop here. The role of a Director of Engineering comes with its own share of operation hustle - from compliance, budgeting, hiring, to setting up processes and ensuring best practices are followed in delivering high-quality work.
However, as exhilarating and fancy as the title sounds, being an engineering director isn’t easy. It's demanding, it's challenging, and it's constantly evolving. Given the constant pressures engineering teams face, the role of a DOE keeps getting more specialized, and evolved.
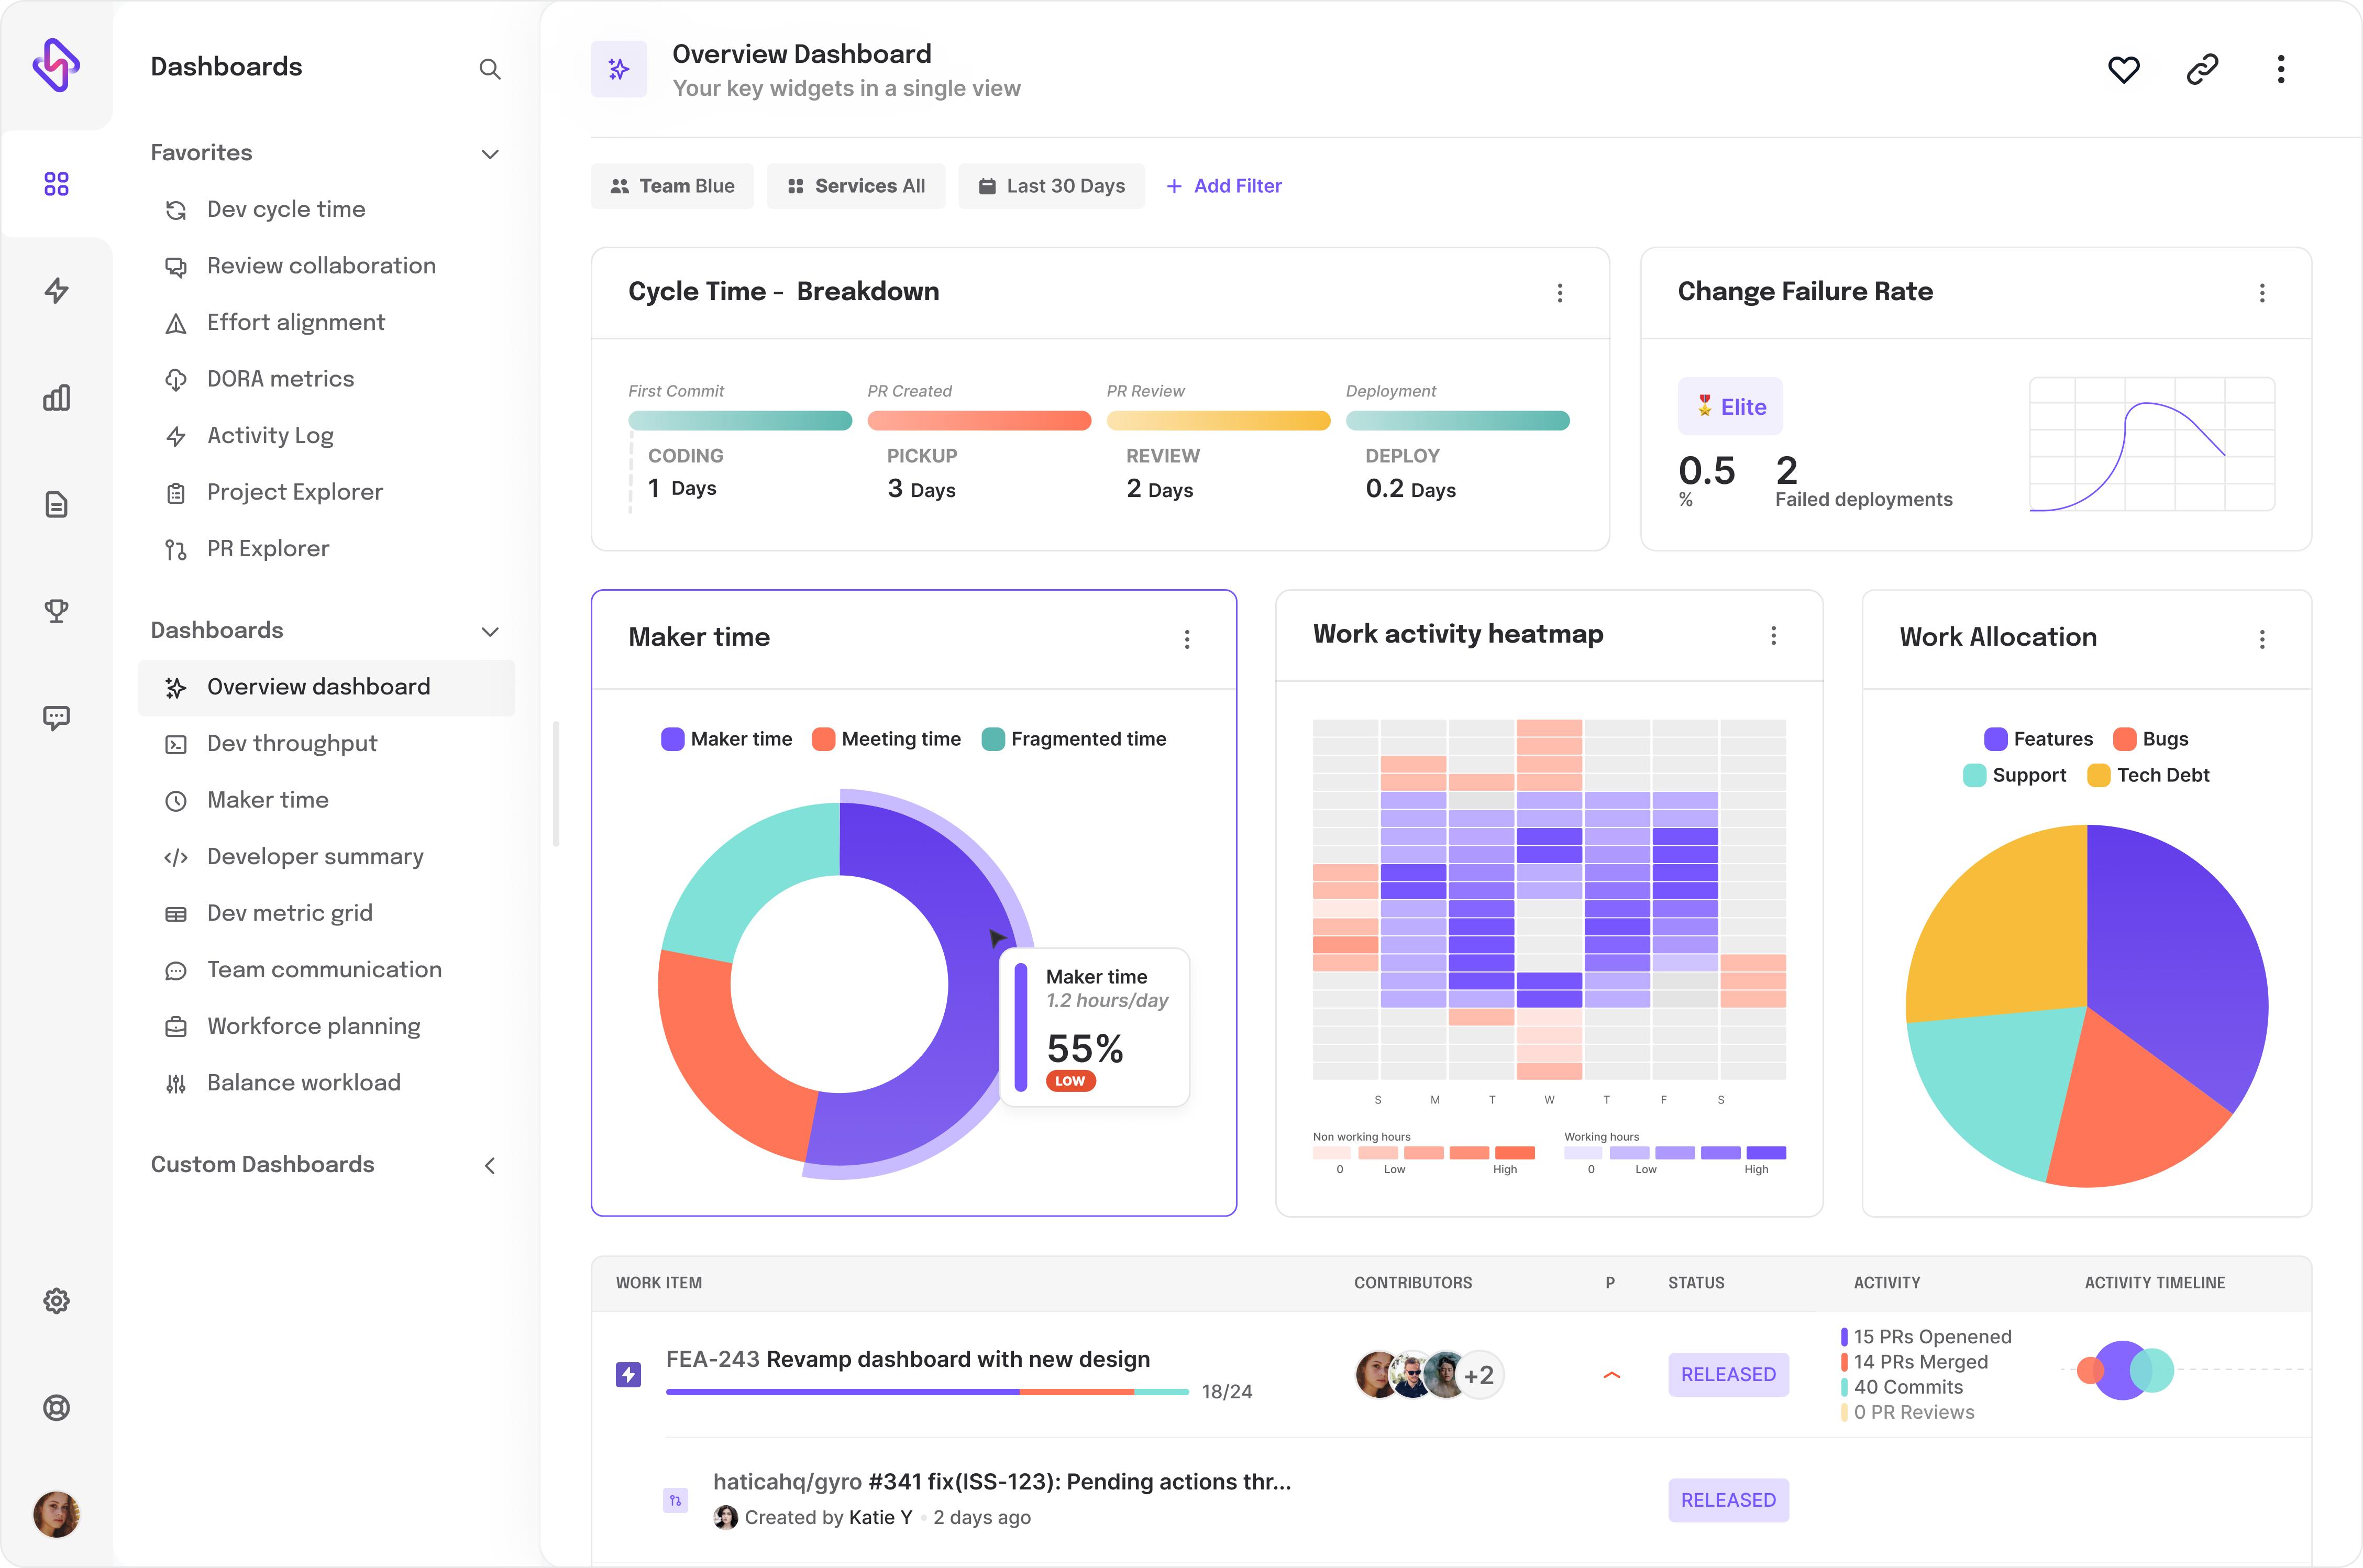
This effectiveness in the delivery pipeline hinges on proactive visibility. Can you pilot a high-powered rocket, blindfolded? That's what managing the delivery pipeline feels like without a data-driven engineering culture. Without having a clear picture of where your SDLC is moving, DOEs will keep seeing high divergence in planned vs delivered tasks, impacting both quality and velocity of the code being shipped.
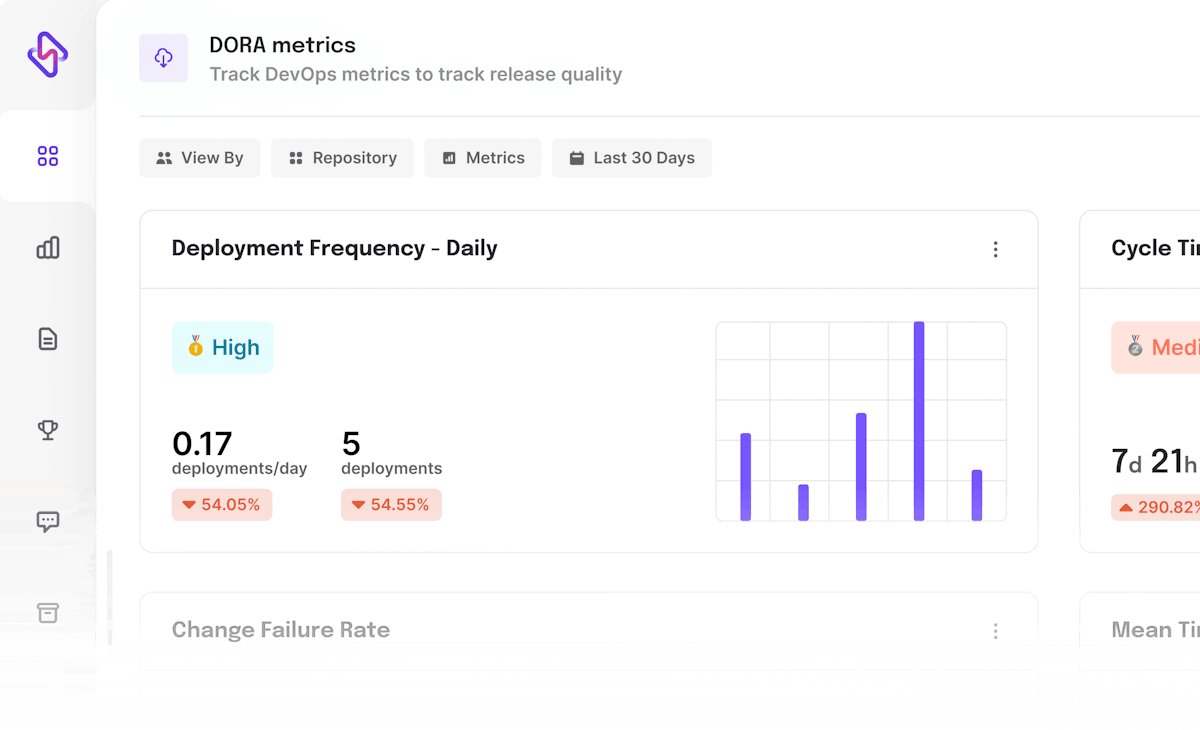
And that’s where adopting a data-driven approach for engineering kicks in. So, here we put together the top software metrics that DOEs could track to make data-informed decisions, and define success for their engineering teams.
We have further classified these metrics into 4 Key categories (that we call Pillars of Engineering Productivity):
- Team Alignment
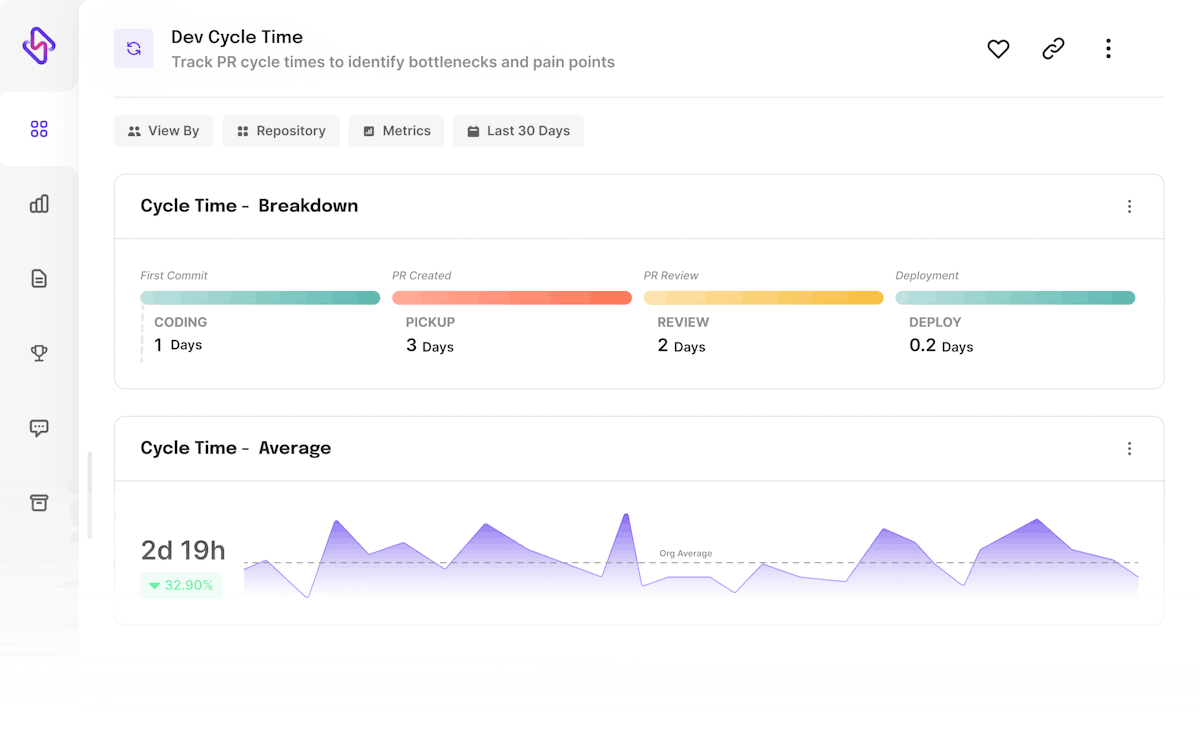
- Velocity
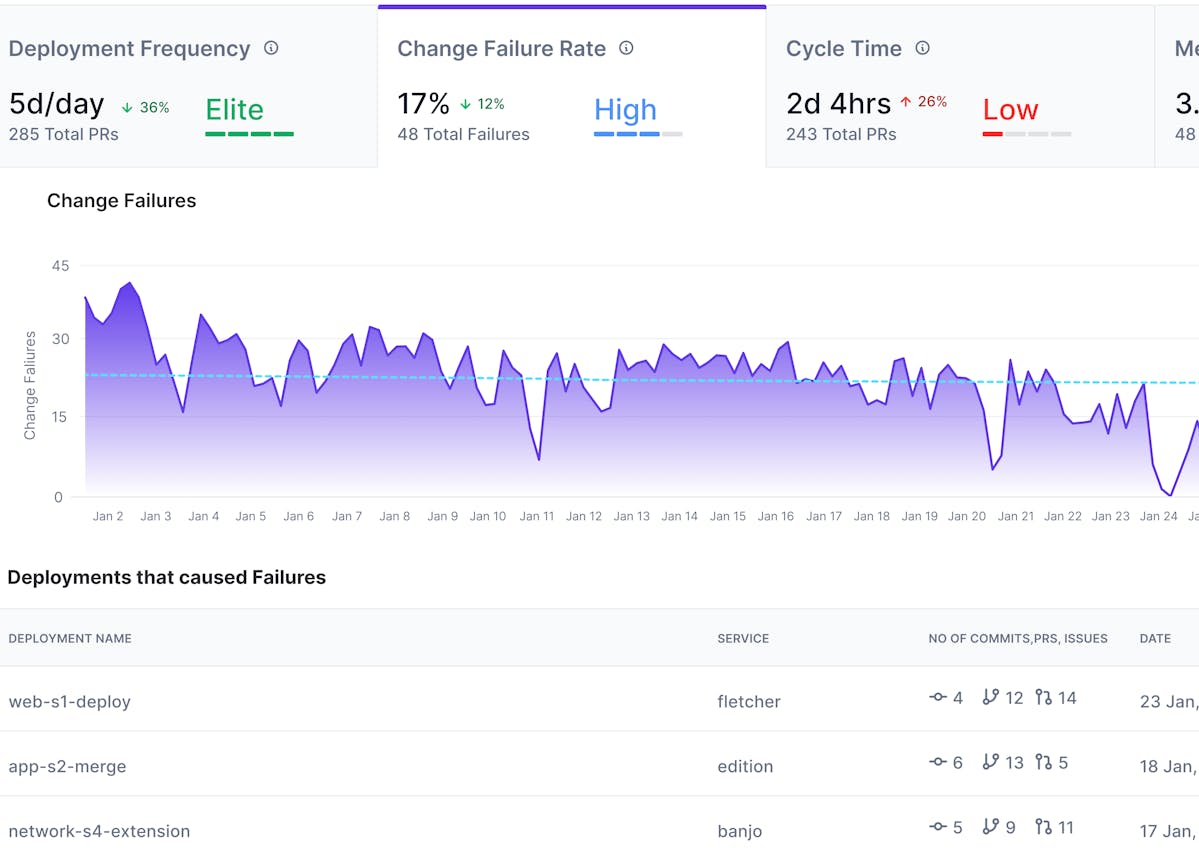
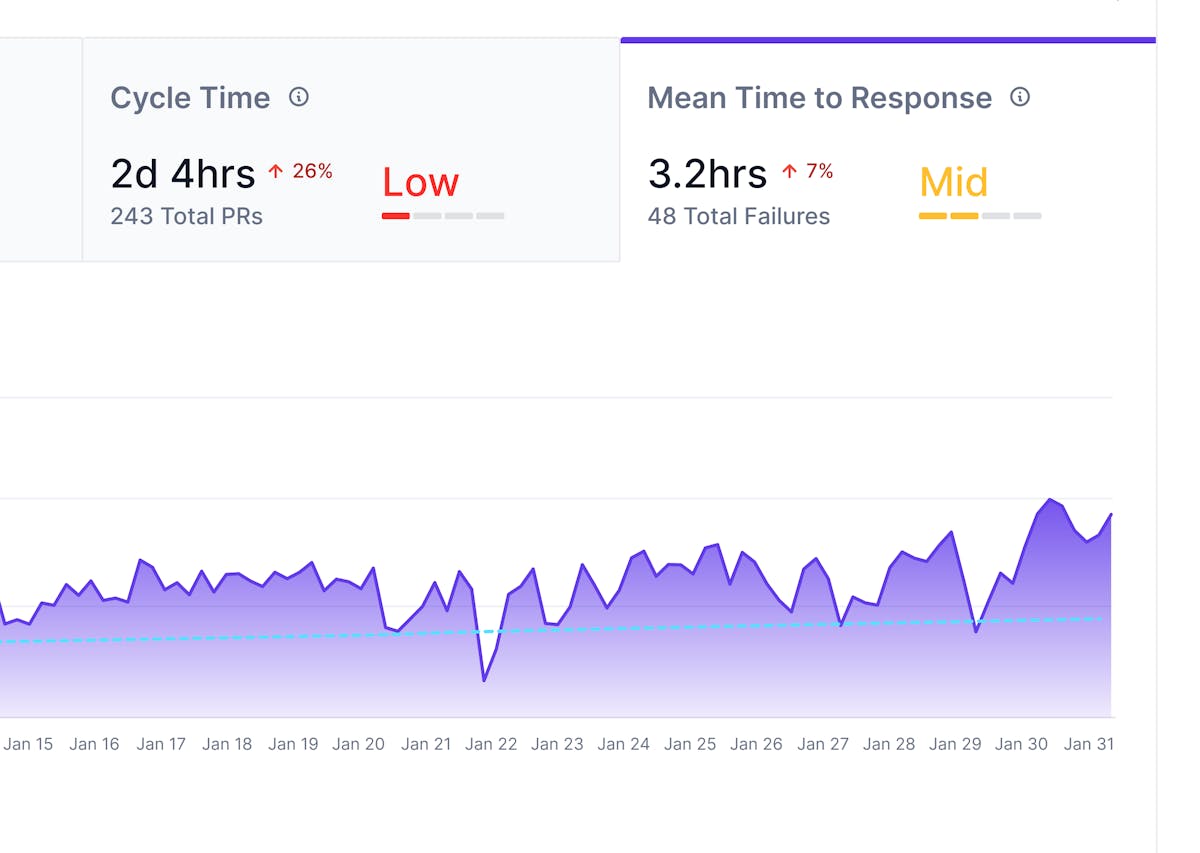
- Code Quality
- People and Process Health
1. Team Alignment
With the engineering team often being the biggest investment in your company, ensuring every dollar drives maximum impact is crucial, making it all the way important to align all teams involved in product development:
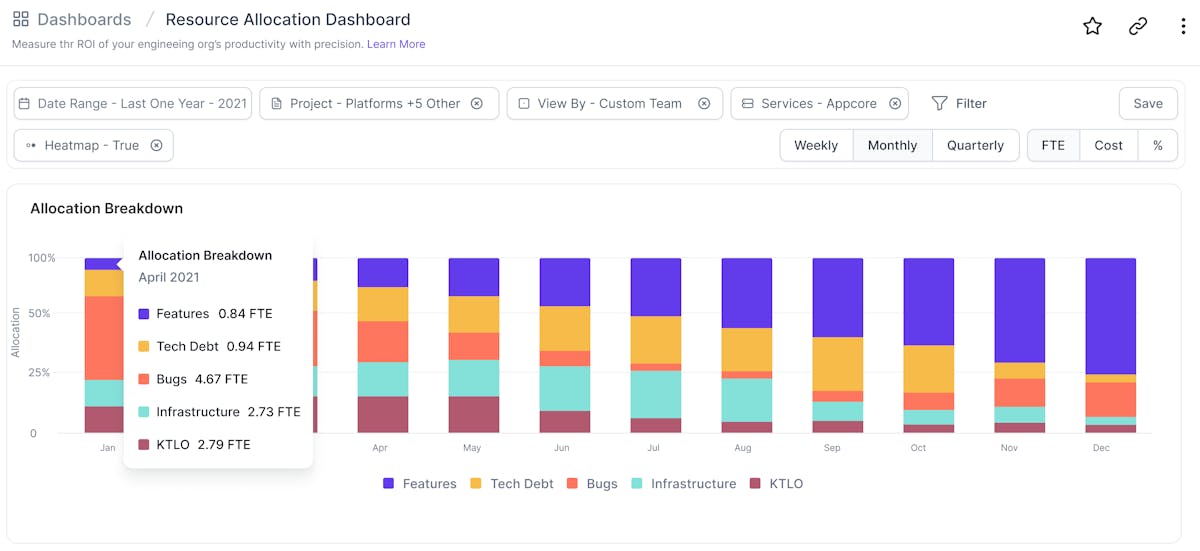
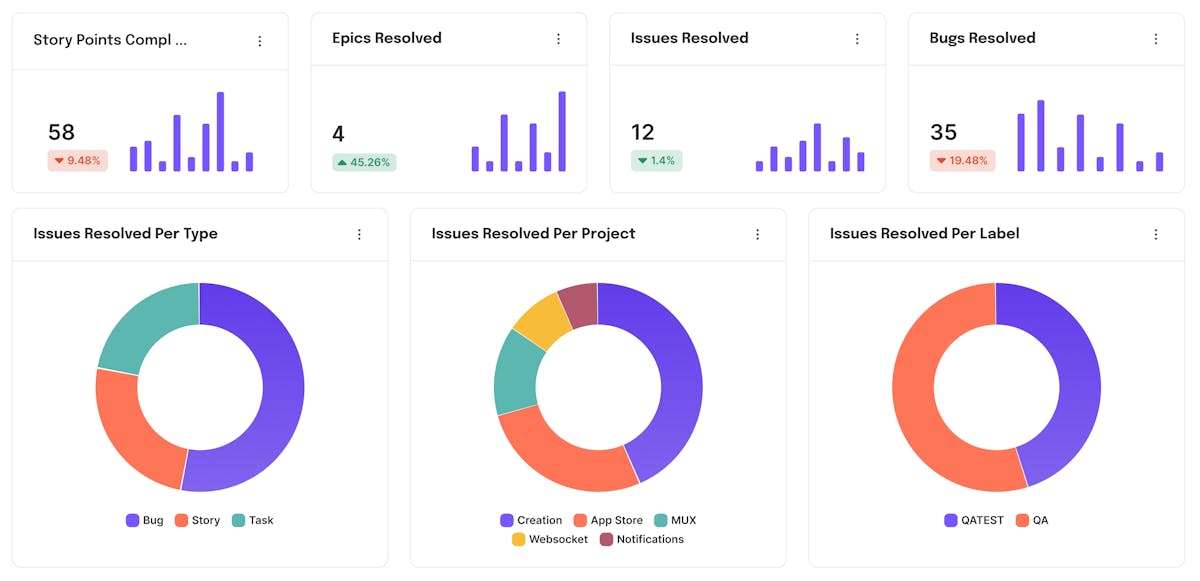
Resource Allocation
The metric tracks the ROI of your engineering investments and how much of them is actually spent building business-critical roadmap vs hunting bugs, KTLO, and technical debt. It essentially ties engineering activities to business requirements.