Picture this: Your SRE team worked day and night to launch a feature release. However, the big news wasn't a successful release, but the bugs resulted in high crash rates. To cope up, your team raised a PR to fix the bugs. And boom! It all went haywire. The failure was one of many crash that happened in the last few months. The application crash rate is at an all-time high, and customers have been asking to revoke their subscription.
Well, isn’t this situationship nightmarish, and yet pretty common in the IT universe? Crashes, cyberattacks, bugs, and rollbacks are the norm in IT. But you must strive to keep them at minimal levels to make your business/startup survive. That’s where DevOps, GitOps, Software test automation, Predictive software maintenance, and other SDLC practices kick in— with promises of streamlining & safeguarding your infrastructure.
In this never ending quest for customer delight, survival, and tech excellence, metrics play a crucial role. They are nothing less of a guiding light. For DevOps, this guiding light is DORA metrics.
Continuing the norm, this blog delves into the nuances of Change Failure Rate DORA metrics.
Read this blog to understand-
- What’s the change failure rate DORA metrics with example?
- How to calculate it using the change failure rate formula?
- How to improve change failure rate for DevOps success?
Let’s understand it in detail.
What is Change Failure Rate?
Change Failure Rate is one of the key software delivery performance metrics that measure the percentage of changes in the production environment that you make to the core application or software you are working on, which results in degraded performance, availability, or functionality of the software to the extent that you need to respond immediately and address the issue. The remediation techniques could be a rollback, hotfix, fix forward method, a patch, coldfix (for unexploited critical vulnerability/threat), etcetera.
In simple words, Change Failure Rate DORA metrics help you quantify the quality of software your team is deploying. The reliability and stability of the software delivered. It’s akin to the canaries in the coal mine and signals you of the broken DevOps-led SDLC processes & practices before they prove disastrous and fatal for the organization.
How To Calculate Change Failure Rate?
The change failure rate formula is very simple and we discuss that next. But calculating CFR in software development isn’t that straightforward. There is no standard definition of software failure, and thus the onus is on the organizations to define on their own what constitutes failure.
For instance, the AWS team was working on the Billing system, and a mishap (typo) happened which resulted in 4 hours of S3 outage and impacted enterprises as large as Quora and Trello. Now, this was indeed a failure but neither the new code deployment nor the bugs in the older deployments triggered it. Instead, it was due to a typo from one of the members working on the Billing system, who accidentally entered a parameter value in the command that took offline a larger set of servers than intended. Though this resulted in failure, it cannot be counted for the Change failure rate calculation.
To clear the misconceptions and ambiguity around change failure rate, let’s untangle the phrase.
Change Failure Rate is about how often ‘deployment changes’ result in ‘degraded service’ that cannot continue in the same state, and needs immediate remediation to address the issues on-priority. So, code refactoring PRs couldn’t be considered a deployment failure. While code refactoring that introduces bugs in a previously deployed version would be considered a deployment failure.
Clear? Cool.
Let’s now define the formula to calculate the change failure rate.
Change Failure Rate Formula
CFR = (Count of deployments that resulted in degraded services / Total deployment count) * 100
Change Failure Rate Example: A typical change failure rate example could be the incident that brought down the Knight Capital Empire.
Something very tragic happened to Knight on the morning of August 1, 2012. Because of flawed software delivery processes, they ended up deploying a piece of code that wasn’t supposed to go to production. They were manually deploying fresh code for automated algorithmic trading. But it went awry. Rolling back to the old code on all servers further exacerbated the problem. As it wasn’t the latest code that had the issue, but the older one. Long story short, by the time the development team could spot the exact issue (SMARS algorithm), and turn it off on all servers, the bug had already cost them $440Mn+. All in a blink of an eye. Okay, 30 minutes to be specific.
This is a real-world change failure rate example, a deployment scenario that demonstrates what qualifies as degradation in service.
Now let’s take a hypothetical change failure rate example.
Let’s say, you work for an eCommerce company. Your team had sprints planned to release 3 backlog items every week. Your team released 8 small features in about a month. Ideally, as per the cadence you should have released 12 features. But it was 8. This is because 3 out of the 8 features had vulnerabilities that crackers could have exploited and incurred heavy losses for your eCommerce company. So, the team had to roll back those deployments, rework them to fix the glitch, and then redeploy it. So, as per the change failure rate formula, your CFR is-
Deployments that resulted in degraded service = 3
Total Deployment count = 8
CFR = (3/8)*100 = 37.5%
Change Failure Rate Misconceptions
- A major misconception is about what can be considered as deployment failure. There could be multiple approaches to defining this.
For example, you can configure your incident management & observability tool (e.g., PagerDuty, Status page, Data dog) to observe and track your deployments and trigger alerts for incidents that you have labelled as “critical” or “high” severity i.e., incidents that need immediate resolution. Incidents that force you to roll back the deployment to previous versions are a failure.
For example, deployments that result in service unavailability, aka outage, or introduce a major vulnerability/threat and seek immediate hotfix/patch is also a definite failure.
- Another misconception is that fix-only deployments that result in failure need not be considered to calculate change failure rate.
It’s evident from how Google defines change failure rate in the state of DevOps 2022 report that every deployment attempt needs to be counted under total deployments, and of those the ones that resulted in failures in production are to be counted under failed deployments, be they regular or fix-only deployments.
- One more misconception is when failure happens in the build pipeline.
Depending on how you configure your incident management tool, this can be factored into the change failure rate calculation. But from our discussion so far, it should be crystal clear that only changes in the deployment are considered for CFR calculation and nothing else.
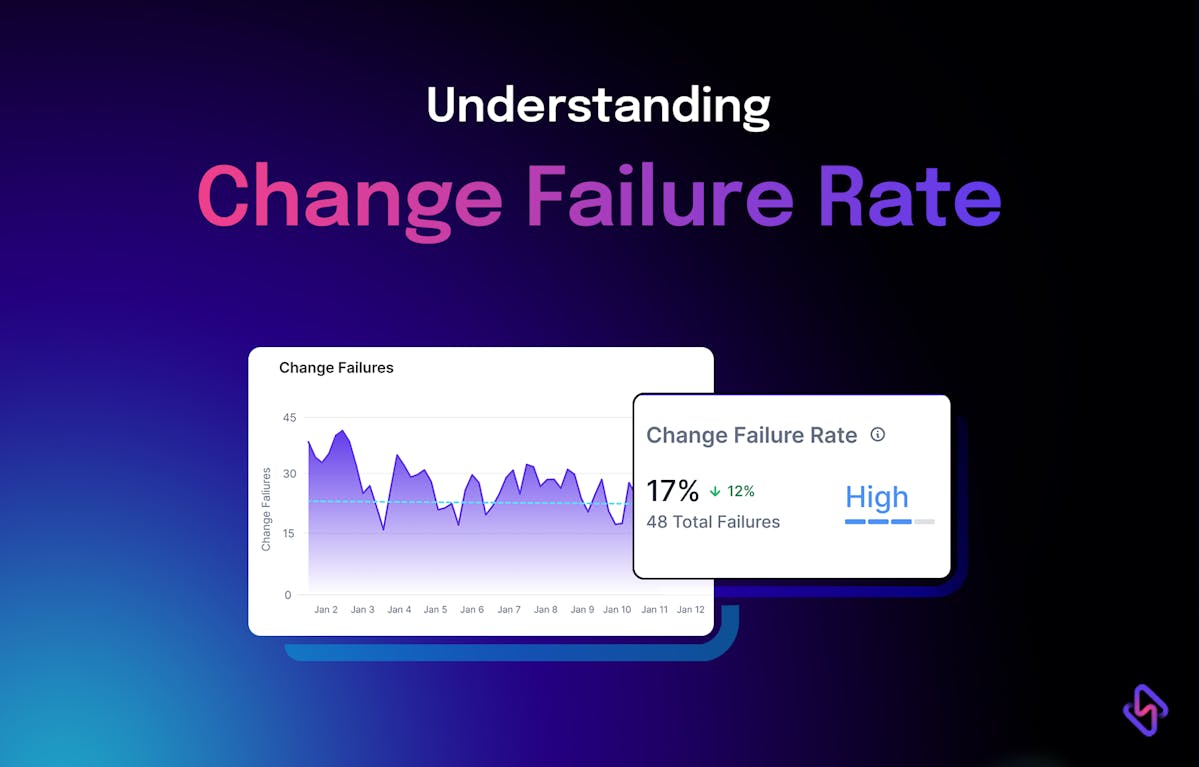
What’s A Good Change Failure Rate?
To be honest, 0%.
However, deployment failures in software engineering are almost inevitable.
DevOps practices are normally segmented into 4 performance buckets in the State of DevOps 2022 report.
As per the report, the ideal CFR is in the range of 0%-15%. But the Accelerate State of DevOps Report 2023 shares more concrete numbers.
So, as per the latest data, if Elite is your DevOps performance destination, a 5% Change failure rate should be your goal. But the same report also mentions Goodhart’s law, which states that when a measure becomes a target it ceases to be a good measure. So, make sure that you or your team do not desperately attempt to game the metrics. Instead, channel your efforts toward improving SDLC processes to improve both- software delivery performance and operational performance. So, let’s discuss how you can improve change failure rate and belong to the DevOps Elite performers.
Why Measure Change Failure Rate DORA Metrics?
DevOps is indeed a value driver for tech-led organizations. As per DORA’s white paper on the ROI of DevOps, if large organizations (technical staff count as much as 8500) who are DevOps high-performers could only avoid code rework by just 1.5% to earn the DevOps Elite performer status, on their course, they would be saving more then $27.5 Million.
The same report shared how AOL leveraged DevOps to bring down their deployment time from 6 hours to a mere 45 minutes, and how Intuit raked 50% higher conversions from the DevOps enabled high development velocity.
But not everyone is getting to taste the success of DevOps.
Puppet reports that 80% of the organizations remain in the middle of their DevOps journey, experiencing only a moderate degree of success, that too not on all fronts.
Such DevOps practitioners have a substantial scope of improvements to make so that they can grab the low-hanging fruits. Esp, the Low Performers.
But how do such organizations get to know what are the bottlenecks, and what needs to be fixed?
That’s exactly the problem that DORA metrics help address. The four key DORA metrics enable you to measure software throughput (Lead Time, Deployment Frequency) & software quality/stability (Change Failure Rate, Mean Time To Recovery). Measuring & improving these metrics is the first step toward improving the outcomes you reap from DevOps adoption. And Change Failure Rate is one of the critical metrics that tells you how robust or resilient are your engineering processes, and how well you’ve imbibed the essence of DevOps into your engineering culture.
How to Improve Change Failure Rate For DevOps Success?
Any SDLC activity that improves code quality would help improve the change failure rate.
As per State of DevOps Report 2023, CI/CD implementation, loosely coupled architecture, and trunk-based development help improve software delivery performance, aka MTTR and CFR. In general, enhancing technical capabilities positively impacts delivery performance.
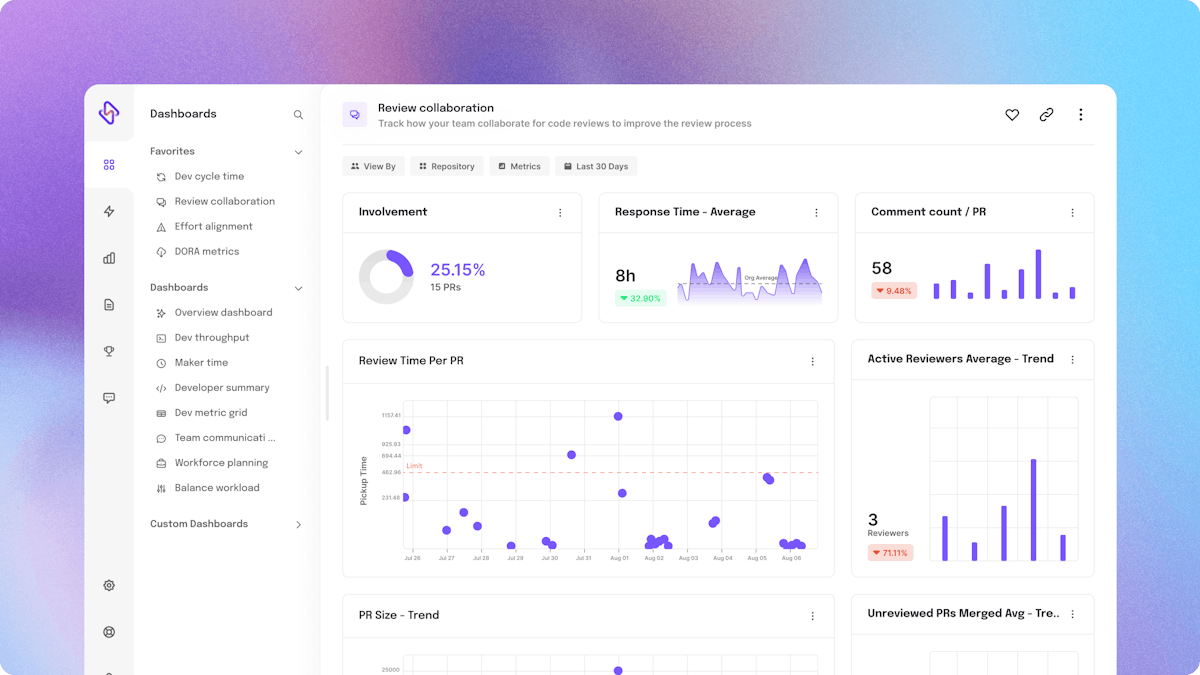
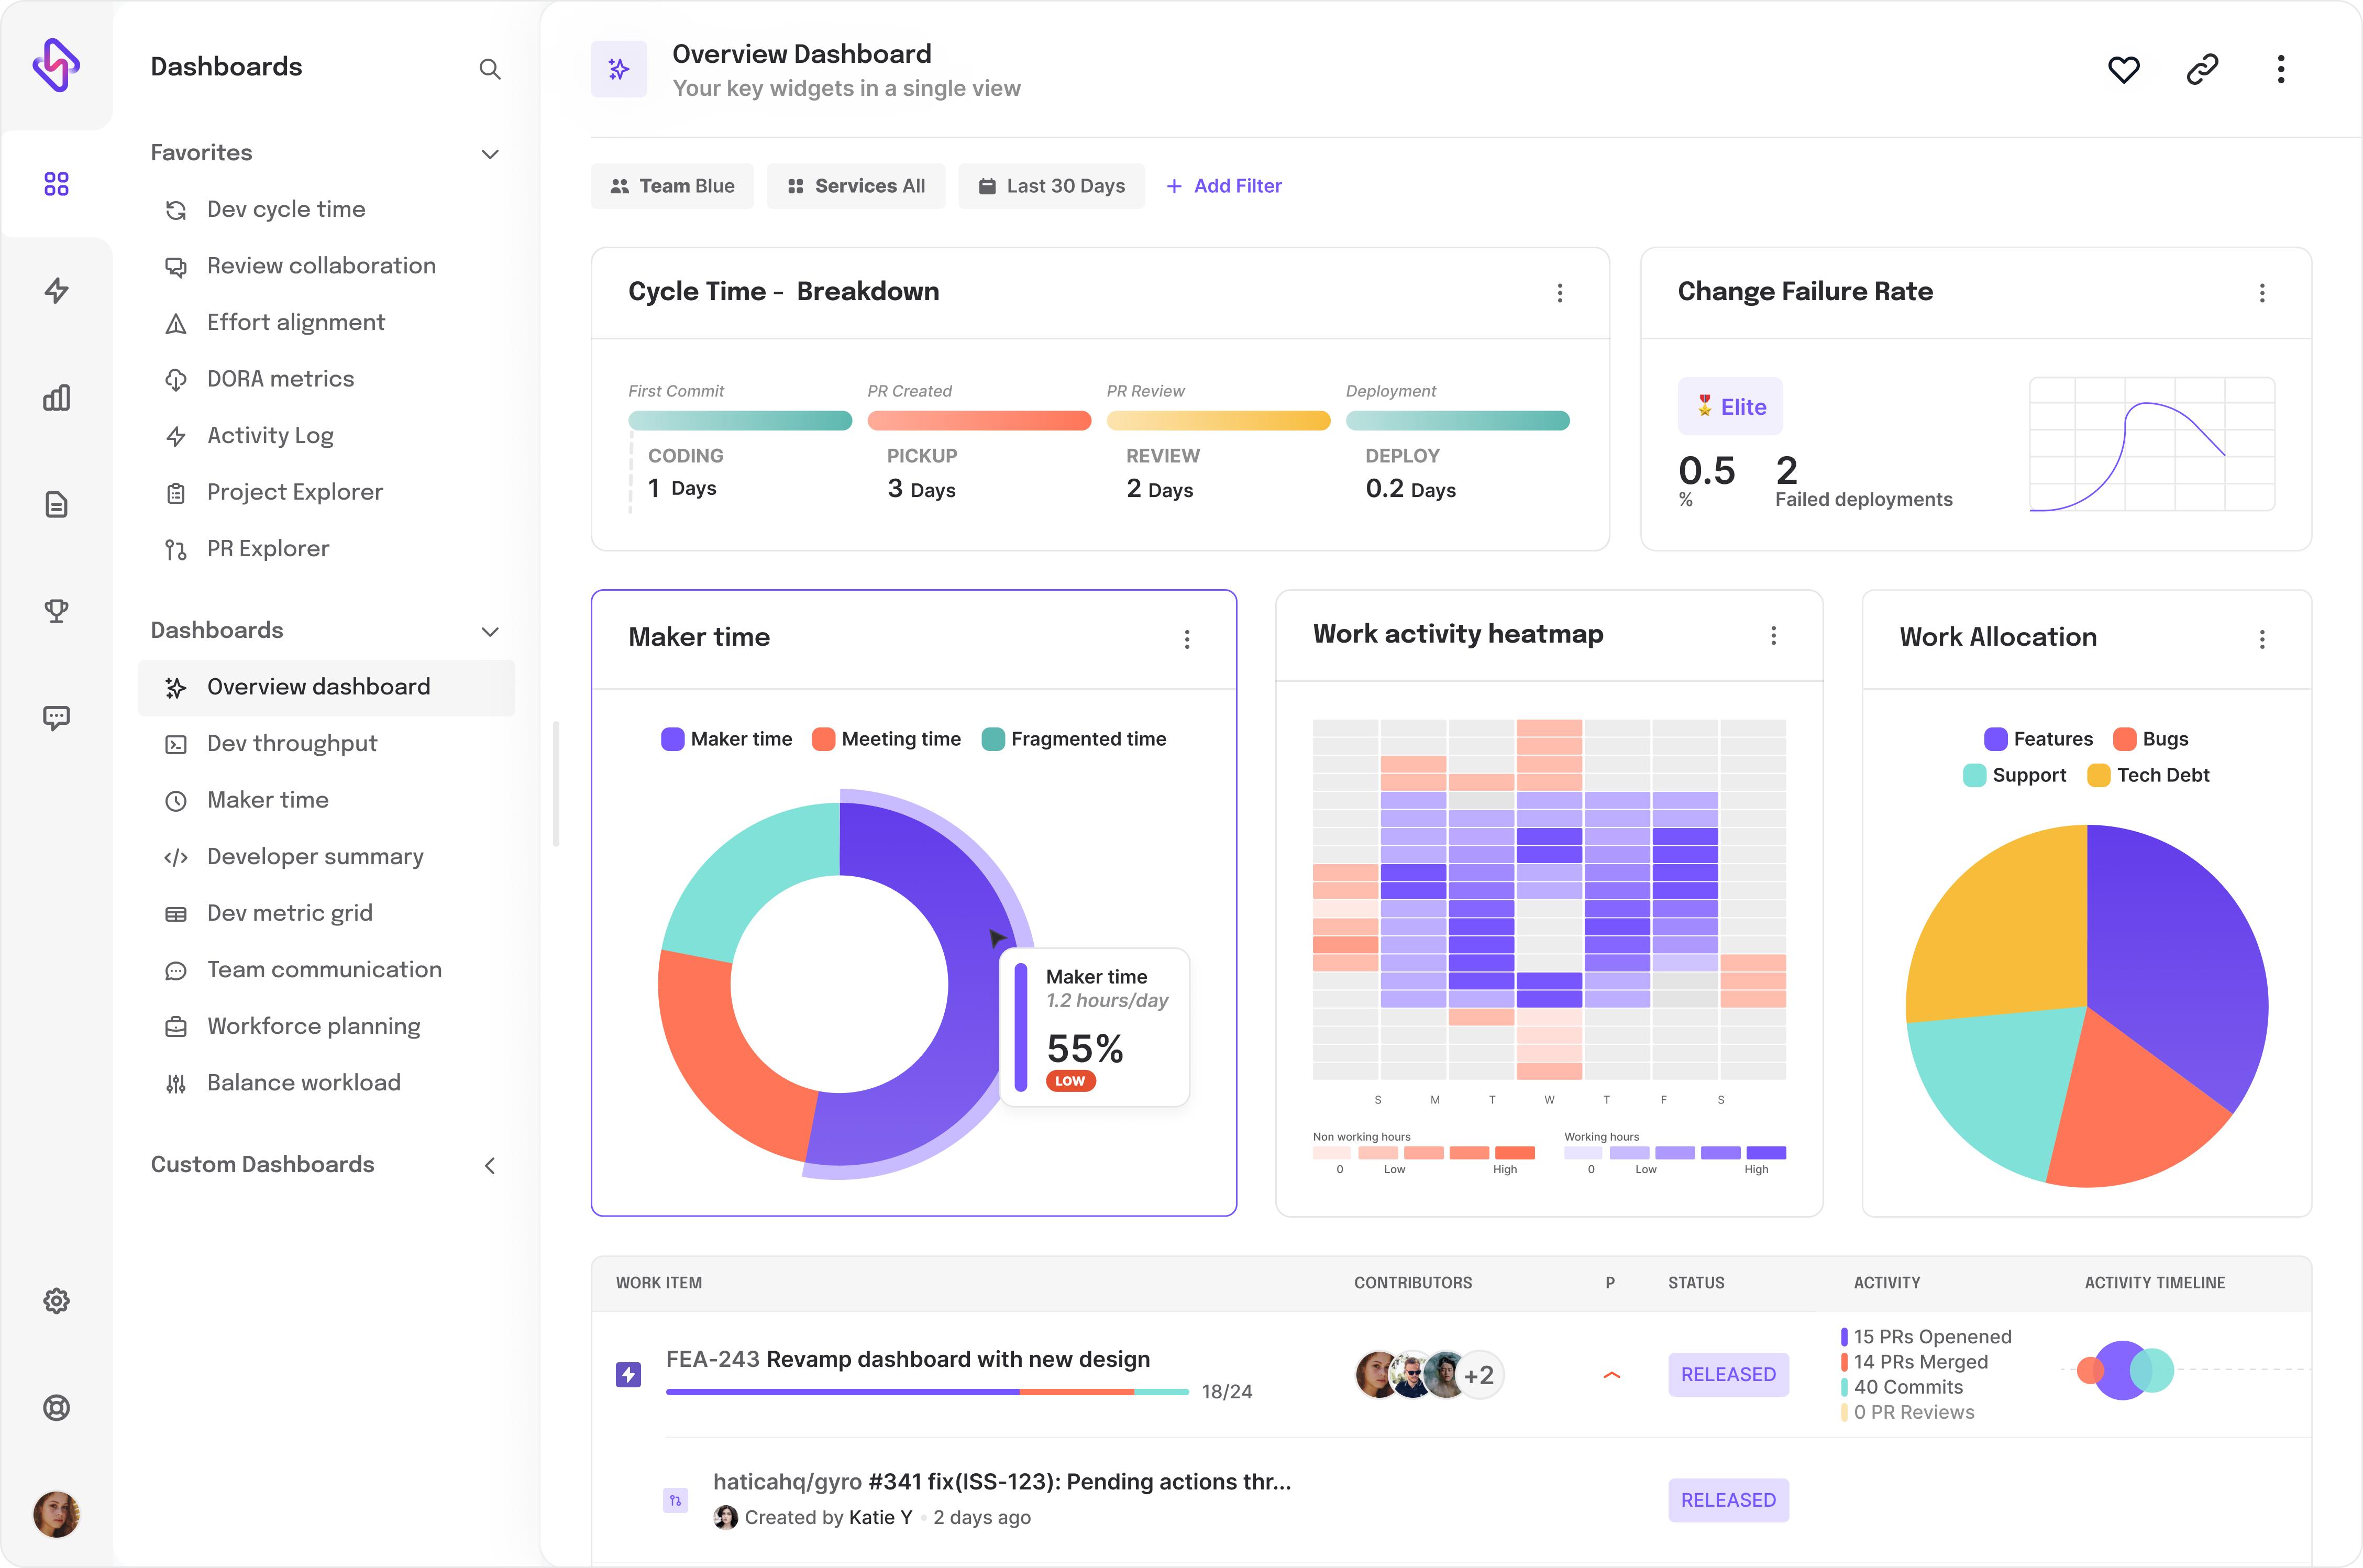
The real hero is code review speed. Faster code review speed significantly improves change failure rate DORA metrics. Are Code Reviews the barrier to your DevOps success? Well, if you’re using Hatica as your engineering analytics tool, you can gauge whether Code Reviews are your bottleneck or not by tracking the following engineering metrics in your Hatica dashboard.