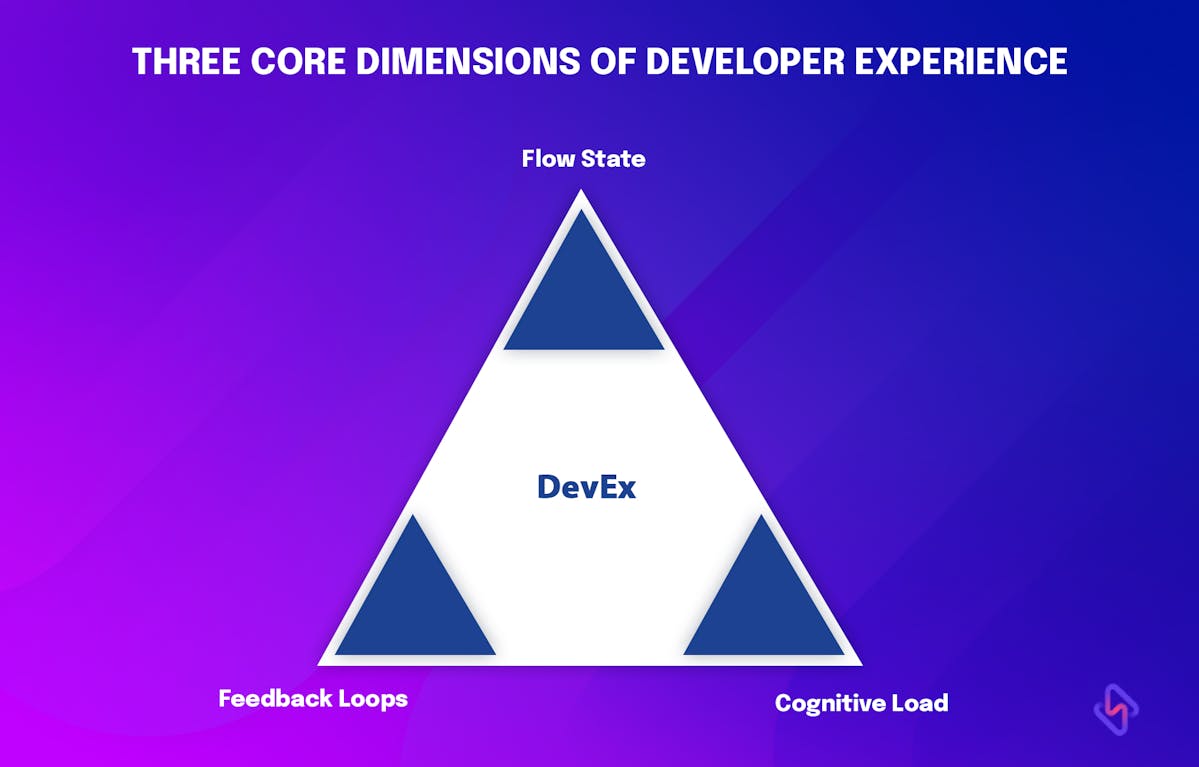
1. Feedback Loops
This refers to how fast developers receive inputs/feedback in response to their actions.
This also encompasses the quality of such feedback.
Instances, where feedback plays a crucial role, include code reviews, CI/CD pipeline build status updates after a PR, test reports and bug/issue status reports, usability, security, performance, and user feedback reports.
Faster, actionable, and continuous feedback can help developers work effectively with minimal friction.
It will also help the leadership to identify areas where tool upgradation or adoption, process intervention/ optimization, and streamlined procedure establishments for the hand-off of responsibilities/ deliverables can be established with an intent to improve the developer experience.
This could safeguard developers from frustration, and delays.
2. Cognitive Load
It refers to the mental effort, and processing capacity required by developers to code effectively.
Developers often need to develop complex software systems. Their working memory and problem-solving skills need to be at their best to yield the best outcome.
And for that, it is essential that they do not get uninterrupted, or else their attention/focus will suffer, reflecting poorly on their productivity.
Engineering managers & leaders must endeavor to minimize interruptions and streamline things for delivering the best developer experience.
It means, establishing processes to minimize complex code structures, ensure comprehensive documentation of the code, safeguard them from timeline and delivery pressures, and reduce the context-switching instances that mostly result from multitasking.
3. Flow State
From a developer's perspective, flow state refers to a joyful mental state of deep concentration, heightened focus, and optimal performance while engaging in coding or software development activities.
It is often described as being "in the zone", and represents a highly productive and enjoyable state of work.
When in the zone, developers become fully absorbed in their tasks. Developers in the flow state exhibit an intense and unwavering concentration on their coding challenges. They are fully immersed in coding, blocking out distractions and maintaining a laser-like focus on the problems they are solving.
Frequent engagement in the flow state is conducive to improved productivity, innovation, and individual growth.
Research has demonstrated that developers who derive satisfaction, and those who are happy with their work are more likely to produce higher-quality code/products. Therefore, it is crucial for teams and organizations to create an environment that fosters a flow state, promoting developer well-being and happiness.
In general, measuring and evaluating metrics within each of the aforementioned three dimensions would unsurfaced the various sources of friction encountered by developers. Accordingly, leadership & the team can respond proactively to re-align & re-prioritize efforts to maximize the organization’s desired outcomes.
Although developer experience is a multifaceted and nuanced concept, teams and organizations can make significant strides towards improving developer experience by employing the DevEx framework and focusing on these three key areas.
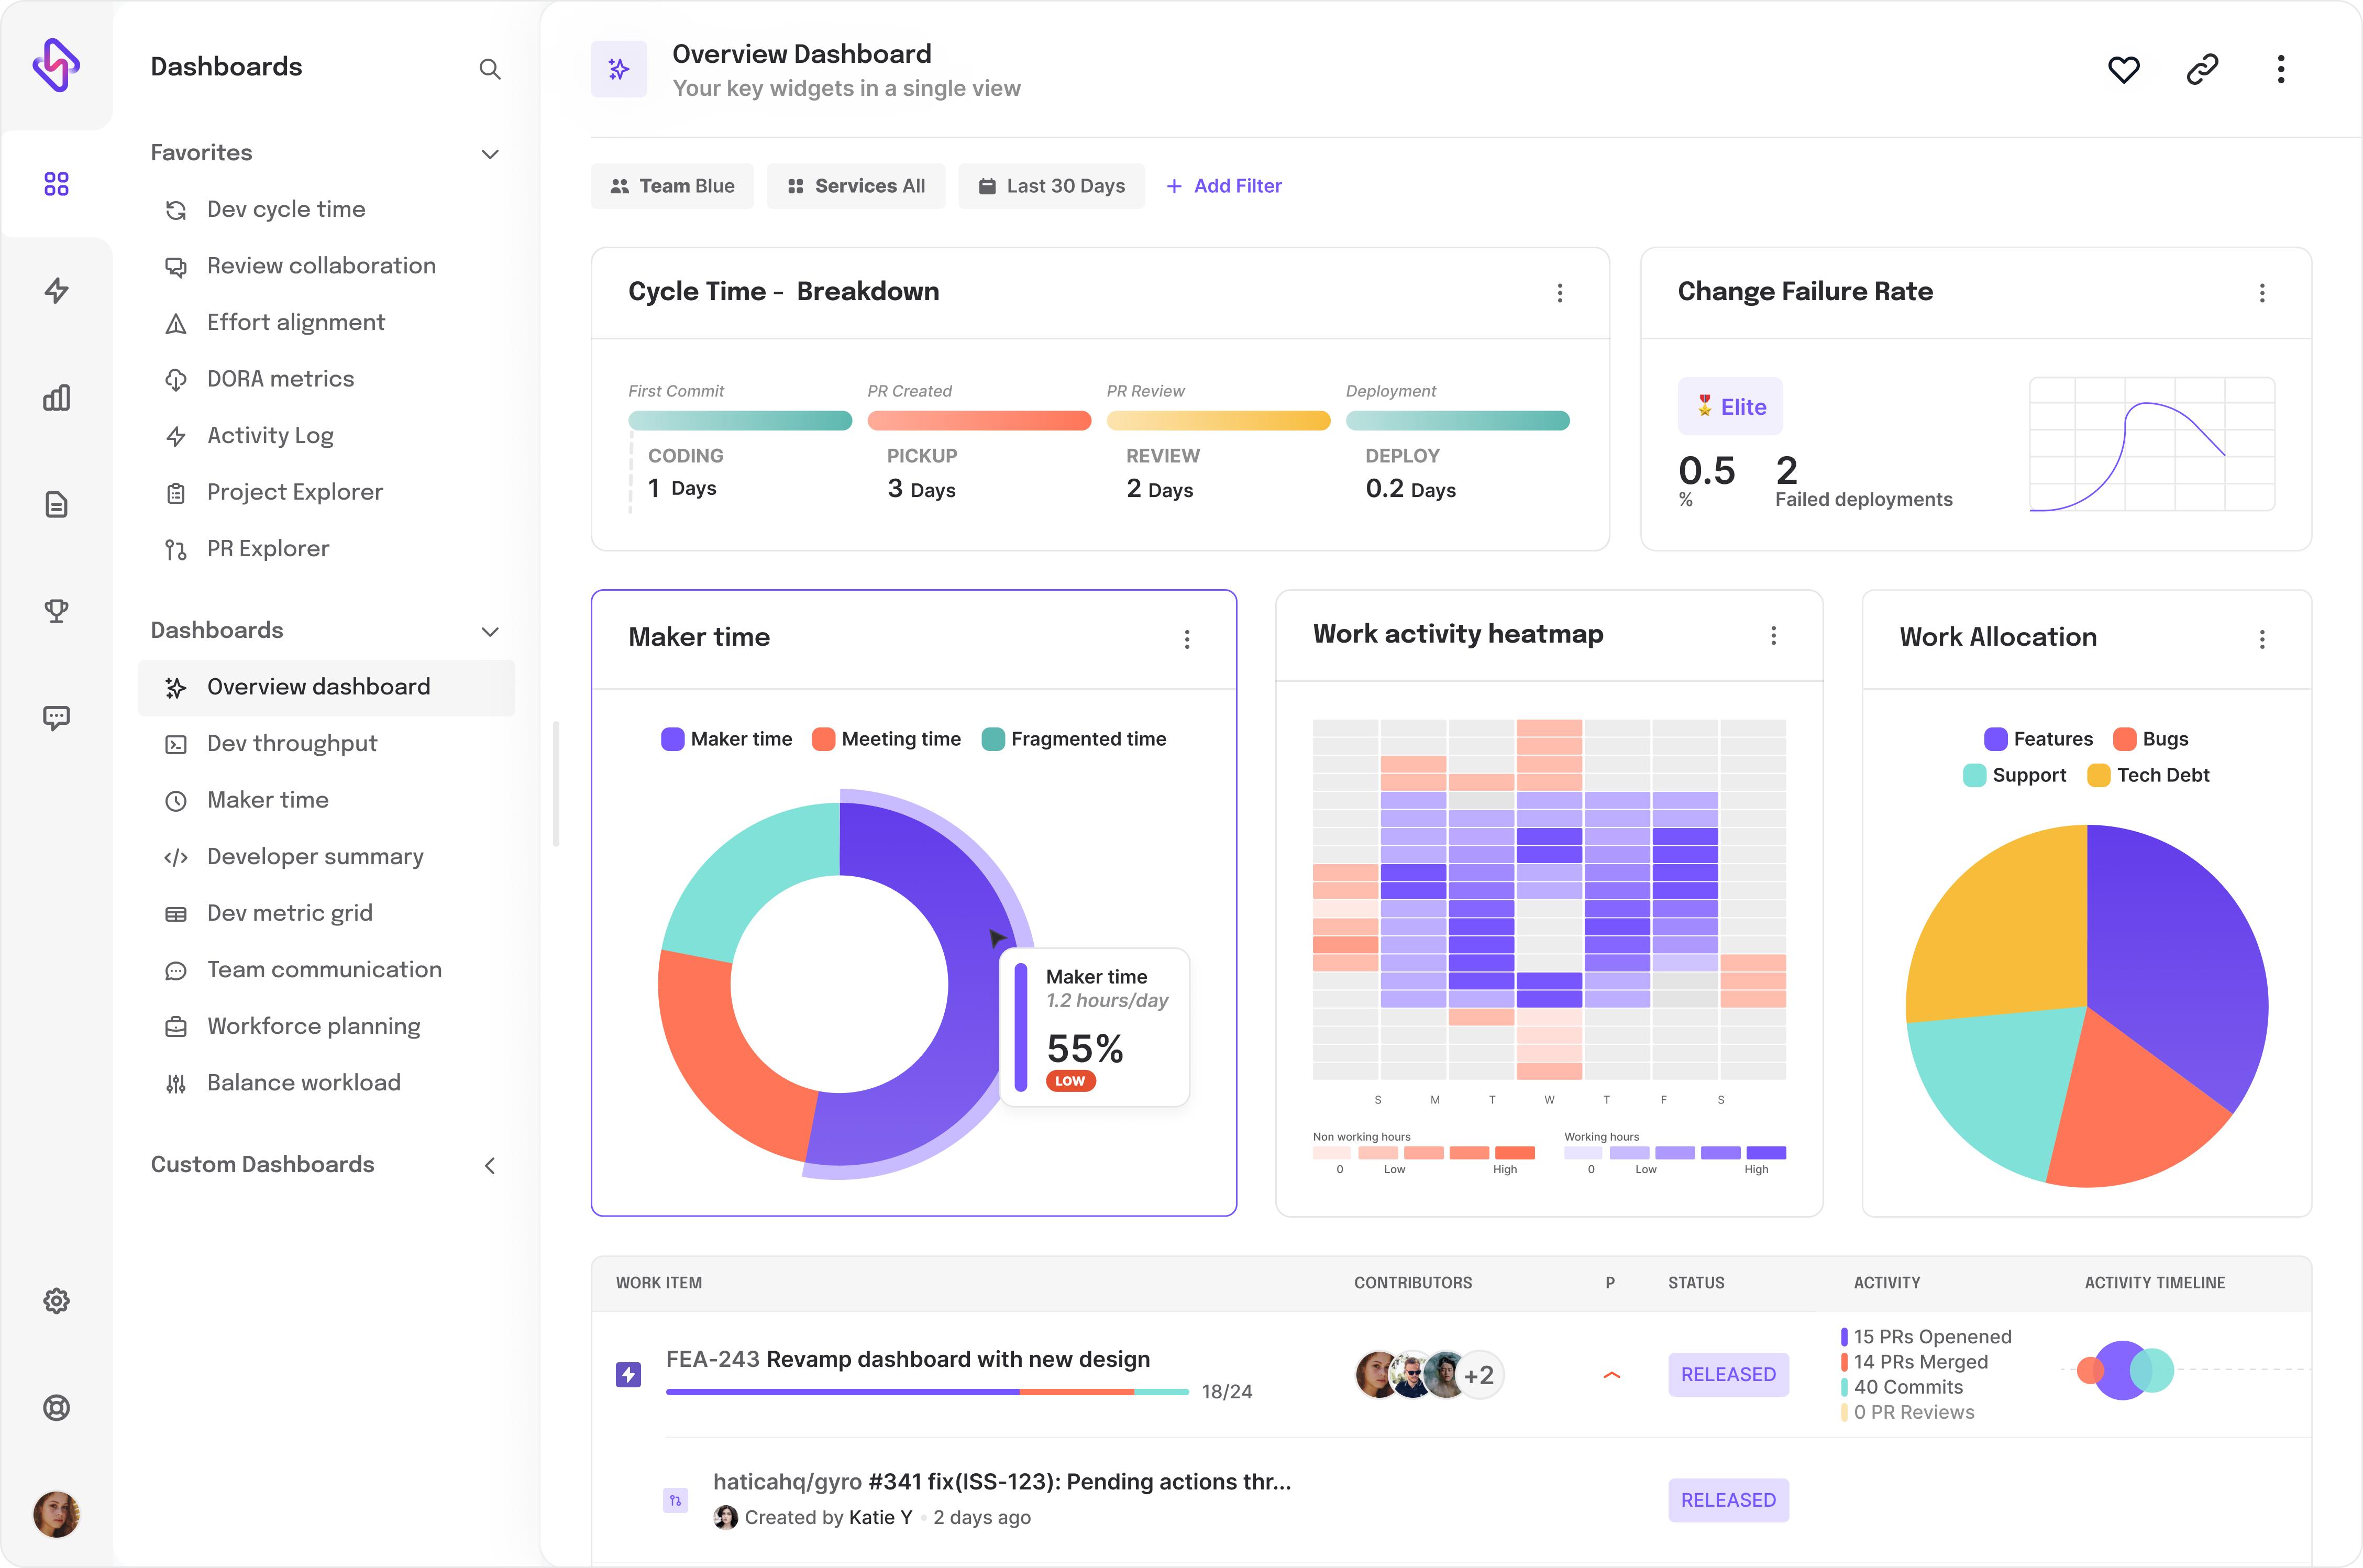
What to Measure for Improving Developer Experience?
Organizations should be focused on measuring perceptual and workflow metrics, and also the north-star metrics i.e., the KPIs. Identify where friction exists by measuring topics across the defined 3 dimensions of the DevEx framework.
For instance,
Signals to Measure the Effectiveness of Feedback Loops
A shorter MTTR could mean that bugs & issues are being resolved quickly, thus indicating an efficient feedback loop in place.
Similarly, quick code review turnaround time also signifies streamlined feedback loops for developers to iteratively improve code quality. Hence, boosting the developer’s self-confidence, and overall experience.
Lower bug reopen rates, higher deployment frequency, and shorter cycle time are some other engineering metrics that could reflect the robustness of feedback loops in your organization/ project.
While these are mostly workflow and technical metrics, engineering teams must also put effort towards measuring perceptual metrics such as
- How happy a developer is with the collaboration tool to exchange ideas and discuss aspects of the received feedback?
- Developer’s satisfaction with the testing methodologies, processes, and results reporting.
- Timeline for a CI/CD pipeline to generate results for the PR.
And so on
Here are some more DevEx metrics examples to spot areas of improvement: