Why Engineering Metrics Are Important?
Imagine trying to measure the health of your body without scales or a thermometer. Metrics act as those gauges for engineering teams. They quantify progress towards goals, identify areas for improvement, and track team performance over time.
The world of software development is the one with constant changes, therefore, relying solely on intuition or guesswork can lead to inefficiencies and missed opportunities.
Engineering metrics provide a crucial foundation for effective decision-making and continuous improvement. Because software development can often feel subjective, with discussions about progress or quality hinging on individual perspectives, engineering metrics can provide objective data points that remove bias and facilitate clear communication.
But we're ready to quantify the importance of engineering metrics with a few tangible benefits in the next section of the blog. Keep reading for more.
What are The Benefits of Engineering Metrics?
Engineering metrics are the antidote to uncertainty. They provide a crucial foundation for effective decision-making and continuous improvement. Here's why they are essential:
1. Data-Driven Decision Making
Engineering metrics empower teams to move beyond intuition and gut feeling. By providing a quantitative picture of performance, metrics enable data-driven decision making. This ensures resource allocation, project planning, and prioritization are all based on objective data.
2. Improved Transparency and Communication
Metrics establish a common ground for communication between engineering teams and stakeholders. Engineering leaders can effectively showcase progress and challenges using data, fostering transparency and trust.
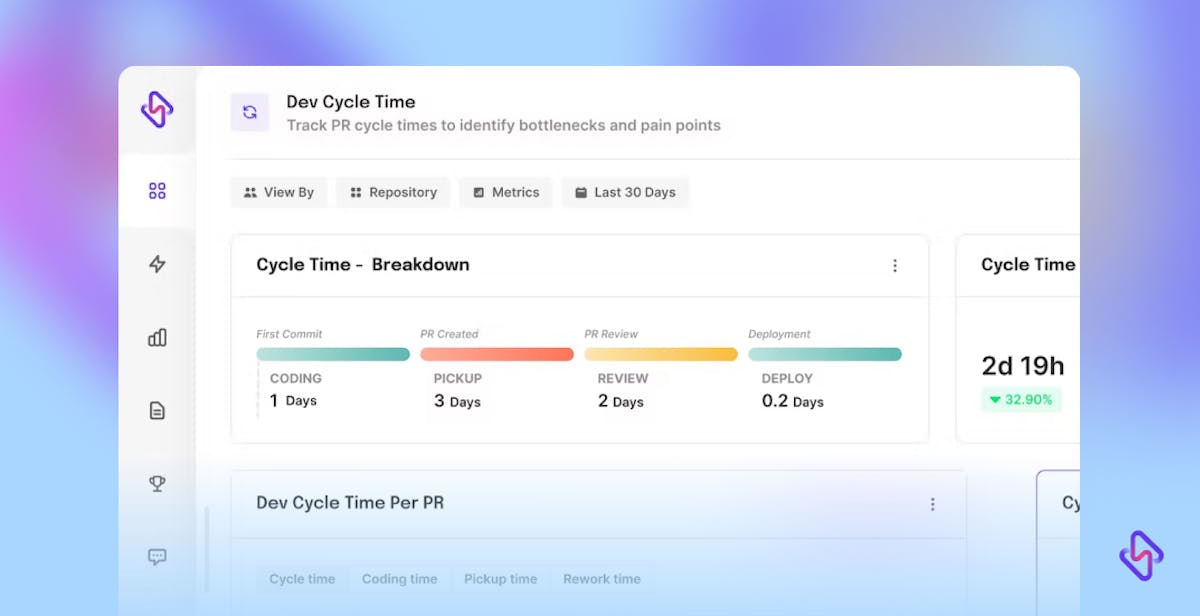
3. Identifying Bottlenecks and Optimizing Processes
Metrics act as early warning signs for potential roadblocks. By tracking metrics like cycle time or defect rates, bottlenecks in the development process can be identified and addressed proactively. This allows for continuous process improvement and optimization.
4. Enhanced Product Quality
Engineering metrics play a crucial role in ensuring high-quality software. Metrics like code coverage or defect escape rate help identify areas where code quality might be compromised. This empowers teams to focus on preventative measures and deliver robust, reliable products.
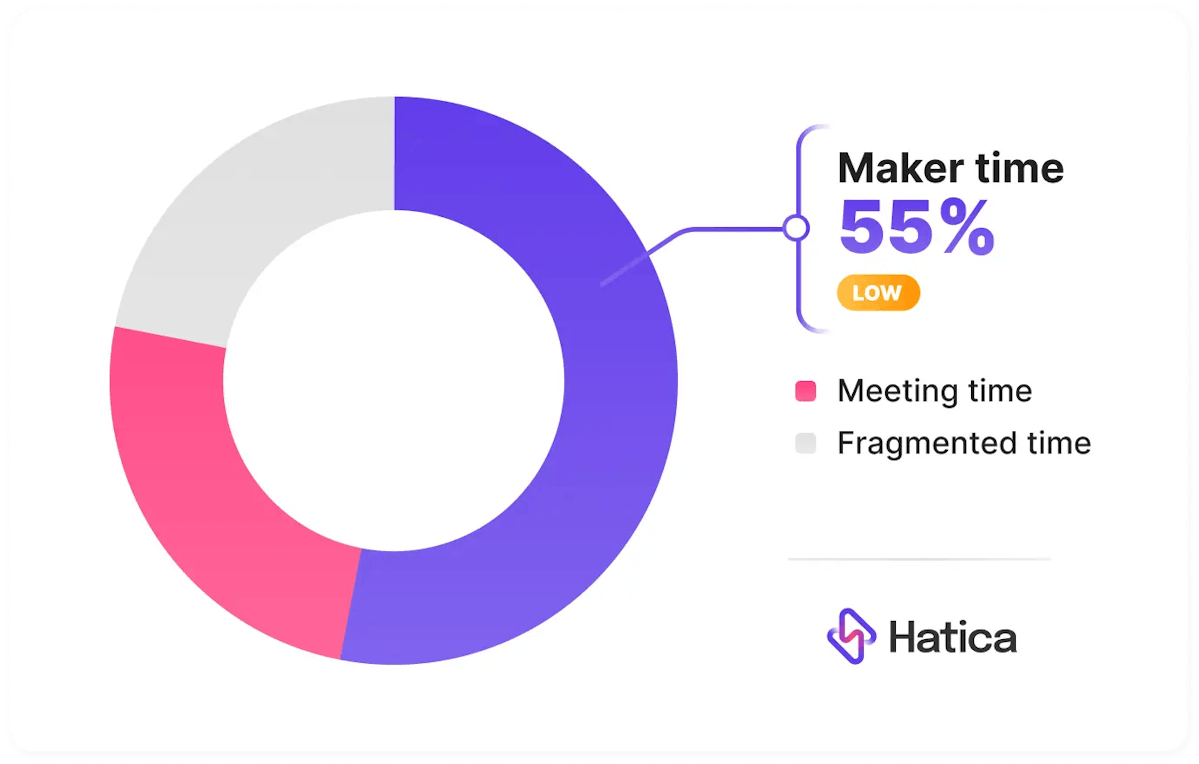
5. Increased Team Productivity and Efficiency
Metrics provide valuable insights into team performance and workload. Engineering managers can utilize this data to identify opportunities to streamline workflows, eliminate redundancies, and optimize resource allocation. This ultimately leads to a more productive and efficient engineering team.
6. Demonstrating Business Value
By translating engineering metrics into business language, engineering teams can effectively communicate their impact on the organization's goals. Metrics highlighting faster release cycles, reduced costs, or improved customer satisfaction showcase the value engineering brings to the table.
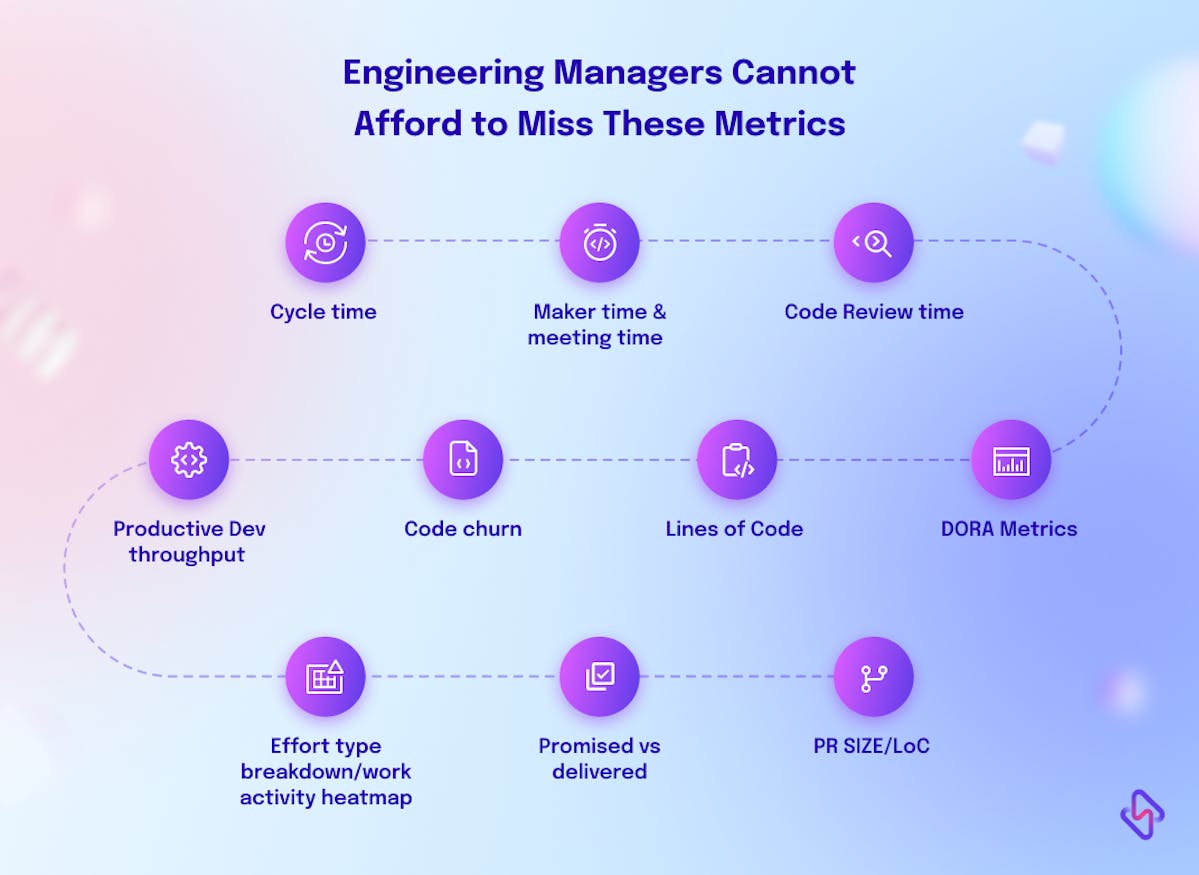
Leveraging Software Metrics For Engineering Success
Now that we are clear about what metrics engineering teams should track; it finally becomes easier for engineering managers to answer: How is the release pipeline going?
These engineering metrics when armed with data helps facilitate continuous improvement in teams. Looking at these metrics in consonance is more or less similar to finding the missing pieces of your SDLC equation- blockers that have plagued your team since ages, or unproductive work that hampered team workflow.
With enough context, engineering managers can translate these technical metrics into a common business language, so all leaders across the hierarchy feel involved in the engineering processes.
“We are deploying 2x faster than last quarter without any additional cost to the organization. Our last release was a high velocity, zero downtime release. We are still working and excelling on the same budget as last year.”
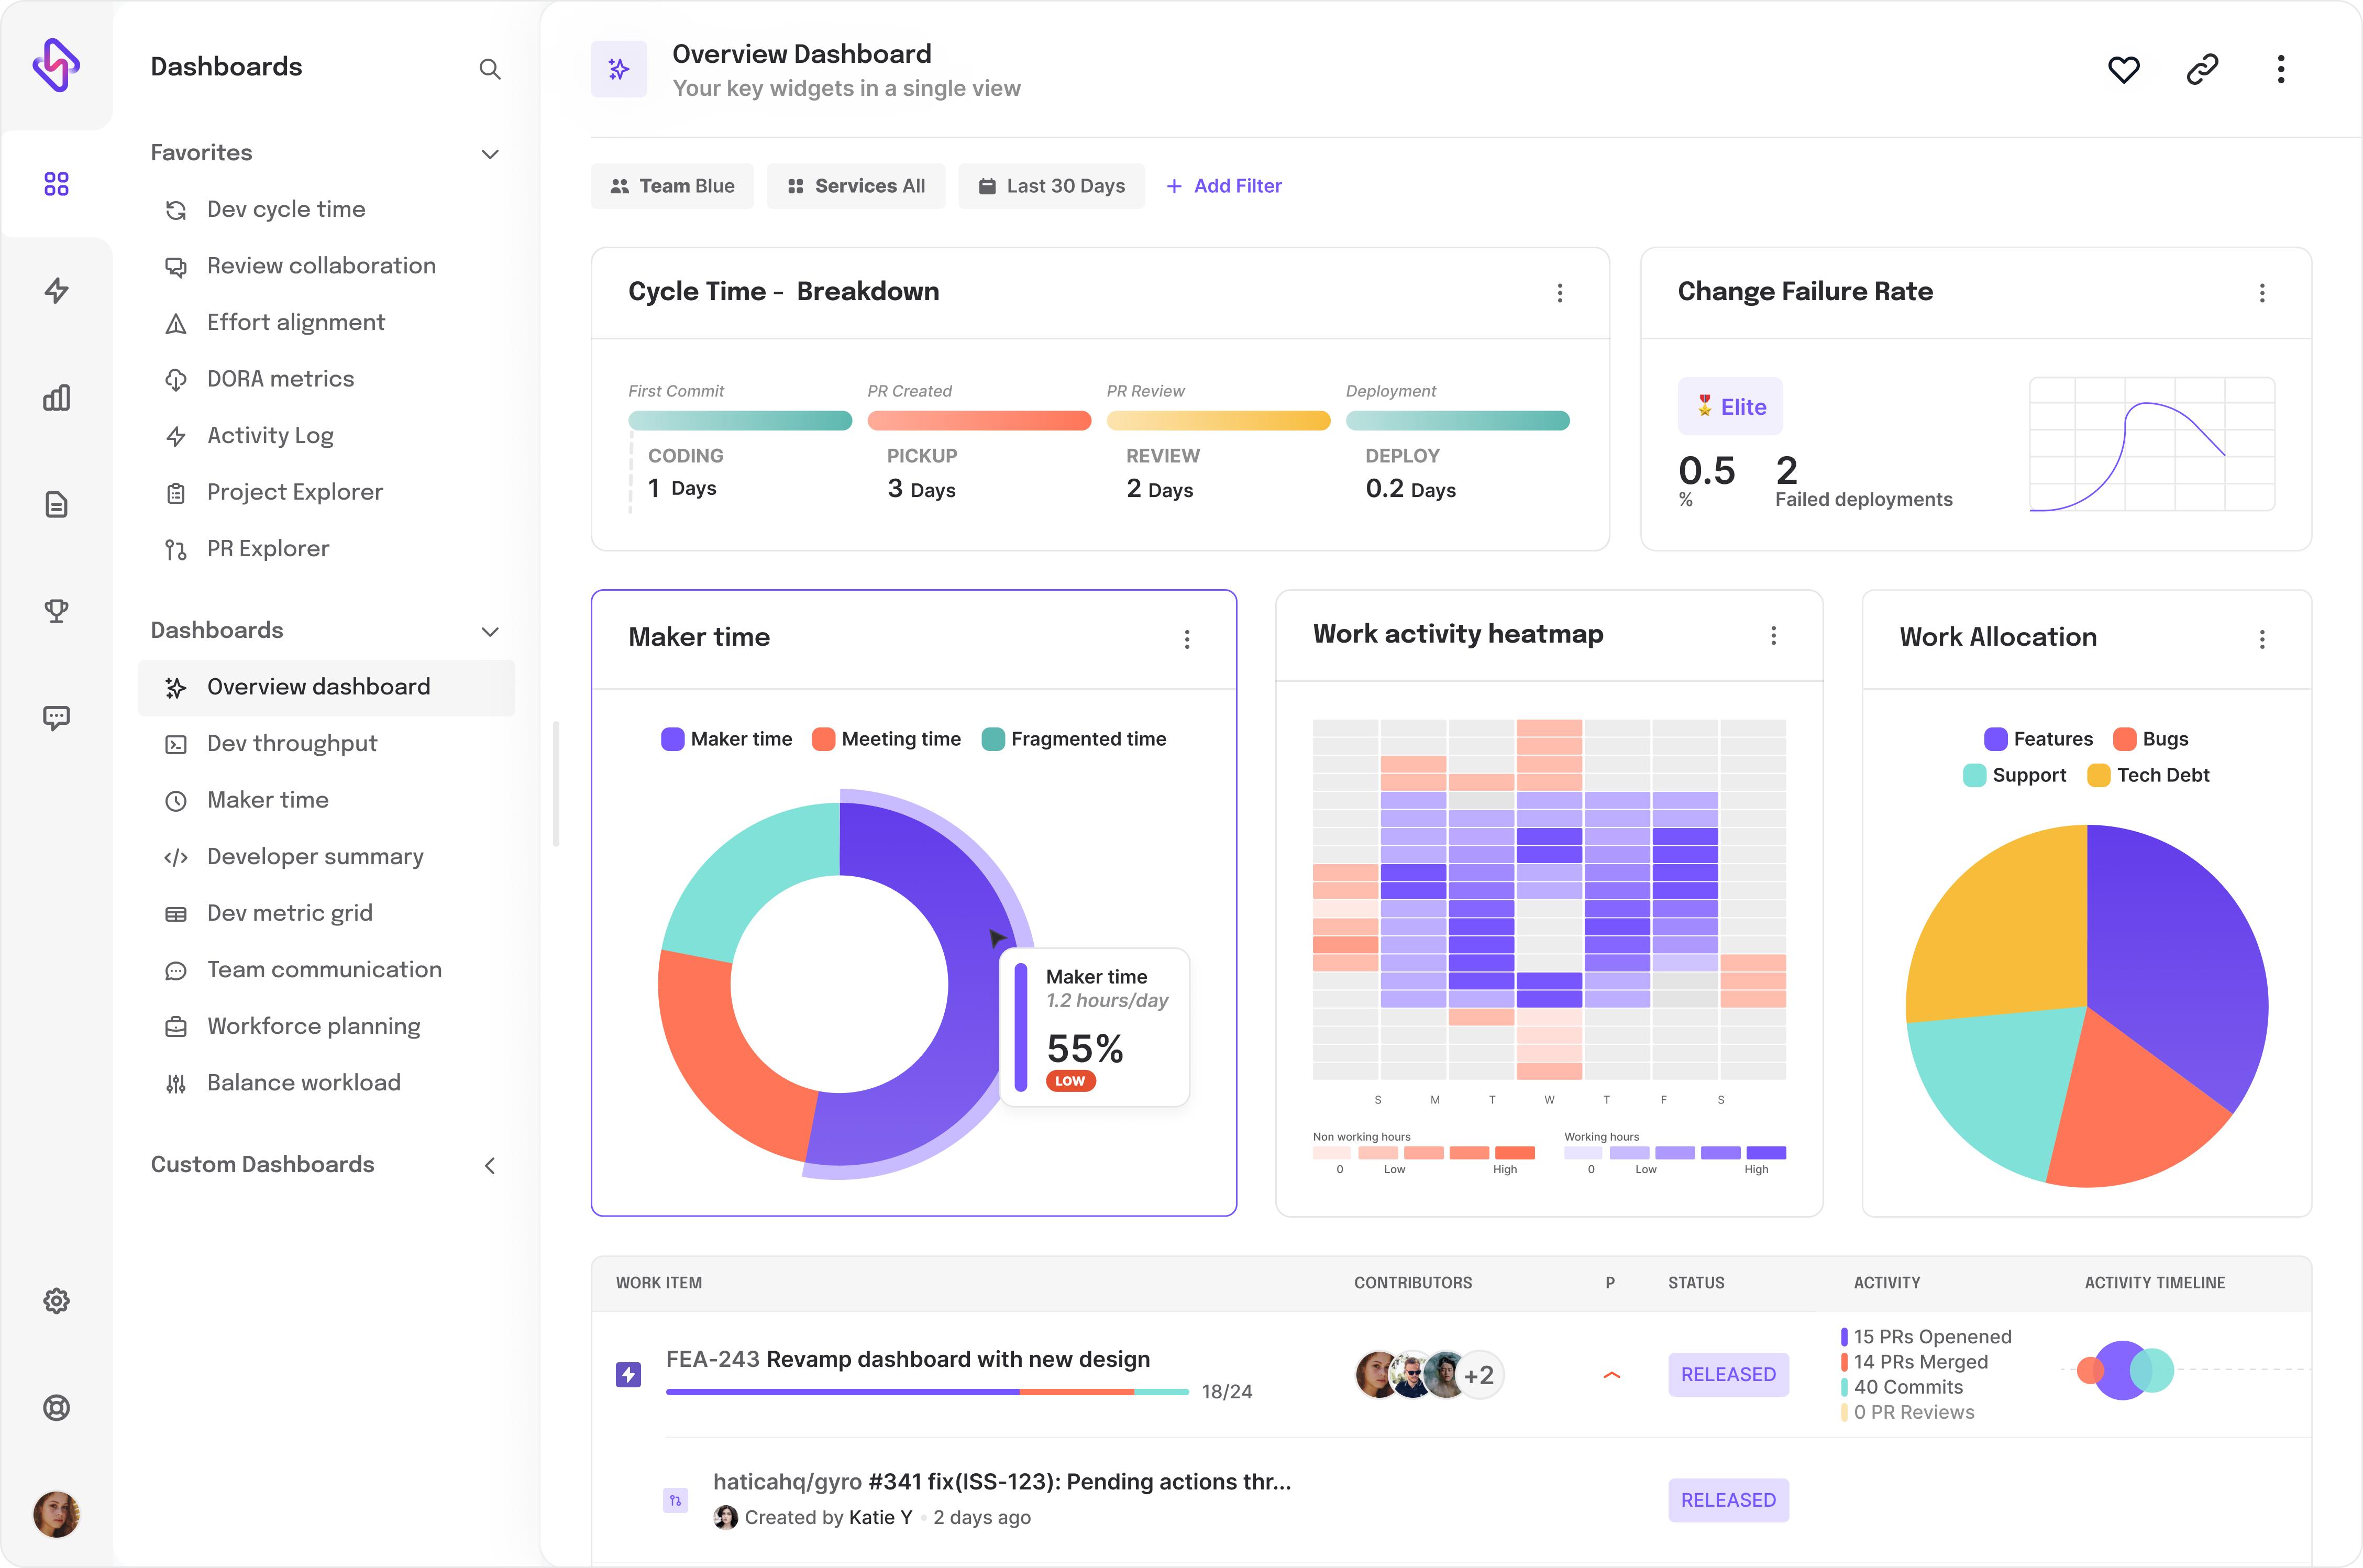
Extracting actionable insights from metrics becomes a child’s play when EMs are equipped with an engineering analytics tool. Hatica helps engineering managers realize the bigger picture of their development process: higher productivity, greater engineering effectiveness, and continuous collaboration.
💡 Engineering managers use Hatica to drive engineering success, and boost productivity. Learn how we can help you build a data-driven culture for your teams.
Subscribe to the Hatica blog today to read more about unblocking developers, and boosting productivity with engineering analytics.
FAQs
1. Why are software metrics crucial for engineering managers?
Software metrics provide valuable insights into the performance and quality of software development. They empower engineering managers to make informed decisions, optimize processes, and ensure successful project outcomes.
2. How can software metrics help identify potential issues?
By tracking software metrics, engineering managers can detect anomalies, bottlenecks, or inefficiencies in the development process. These metrics act as early warning signs, allowing managers to take proactive steps to address issues before they escalate.
3. How can I start implementing these software metrics in my engineering processes?
Begin by identifying the specific metrics relevant to your projects. Incorporate them into your workflow gradually, making adjustments based on the insights they provide. Regularly analyze and refine your approach to optimize your software development practices.
4. How Do You Measure Success as an Engineering Manager?
Success for an engineering manager involves setting KPIs, analyzing project delivery effectiveness, evaluating team collaboration and communication, and monitoring individual and team development.
5. What Should an Engineering Manager Know?
An engineering manager should have a solid engineering background and be skilled at sharing their knowledge through mentoring and training.