When the backbone hurts — an individual’s productivity, body posture, physical & mental activity level, enthusiasm, everything suffers! AND so it demands immediate medical attention. The situation in an IT environment is not much different. Developers are the backbone of any software team/organization. In the absence of the right tools, processes, and organizational culture, their productivity too can suffer, and it gets reflected in the overall health of the organization, especially the financial health. That's where value stream metrics kicks in. This helps identify bottlenecks & optimize processes for better outcomes.
By monitoring value stream metrics (data points), you can gain valuable insights into the entire lifecycle of a software development project — including the processes, tools, individuals, and teams involved — from ideation to deployment.
Read this insight to understand how value stream metrics unlock developer productivity, streamline workflows, and inculcate a culture of delivering higher-quality software products to customers.
What Are Value Stream Metrics?
Value stream metrics are quantifiable data points used to measure the efficiency and effectiveness of a software development process, be it Agile or DevOps-led agile. These metrics provide insight into the flow of work through an organization and help identify areas for improvement.
By tracking value stream metrics, organizations can gain visibility into how efficient their processes are, identify the loopholes/gap, and fix them.
Most Common Metrics Related To Value Stream Management
- Lead time i.e., Time elapsed between the moment a feature ideation begins to the moment it goes into the hands of users
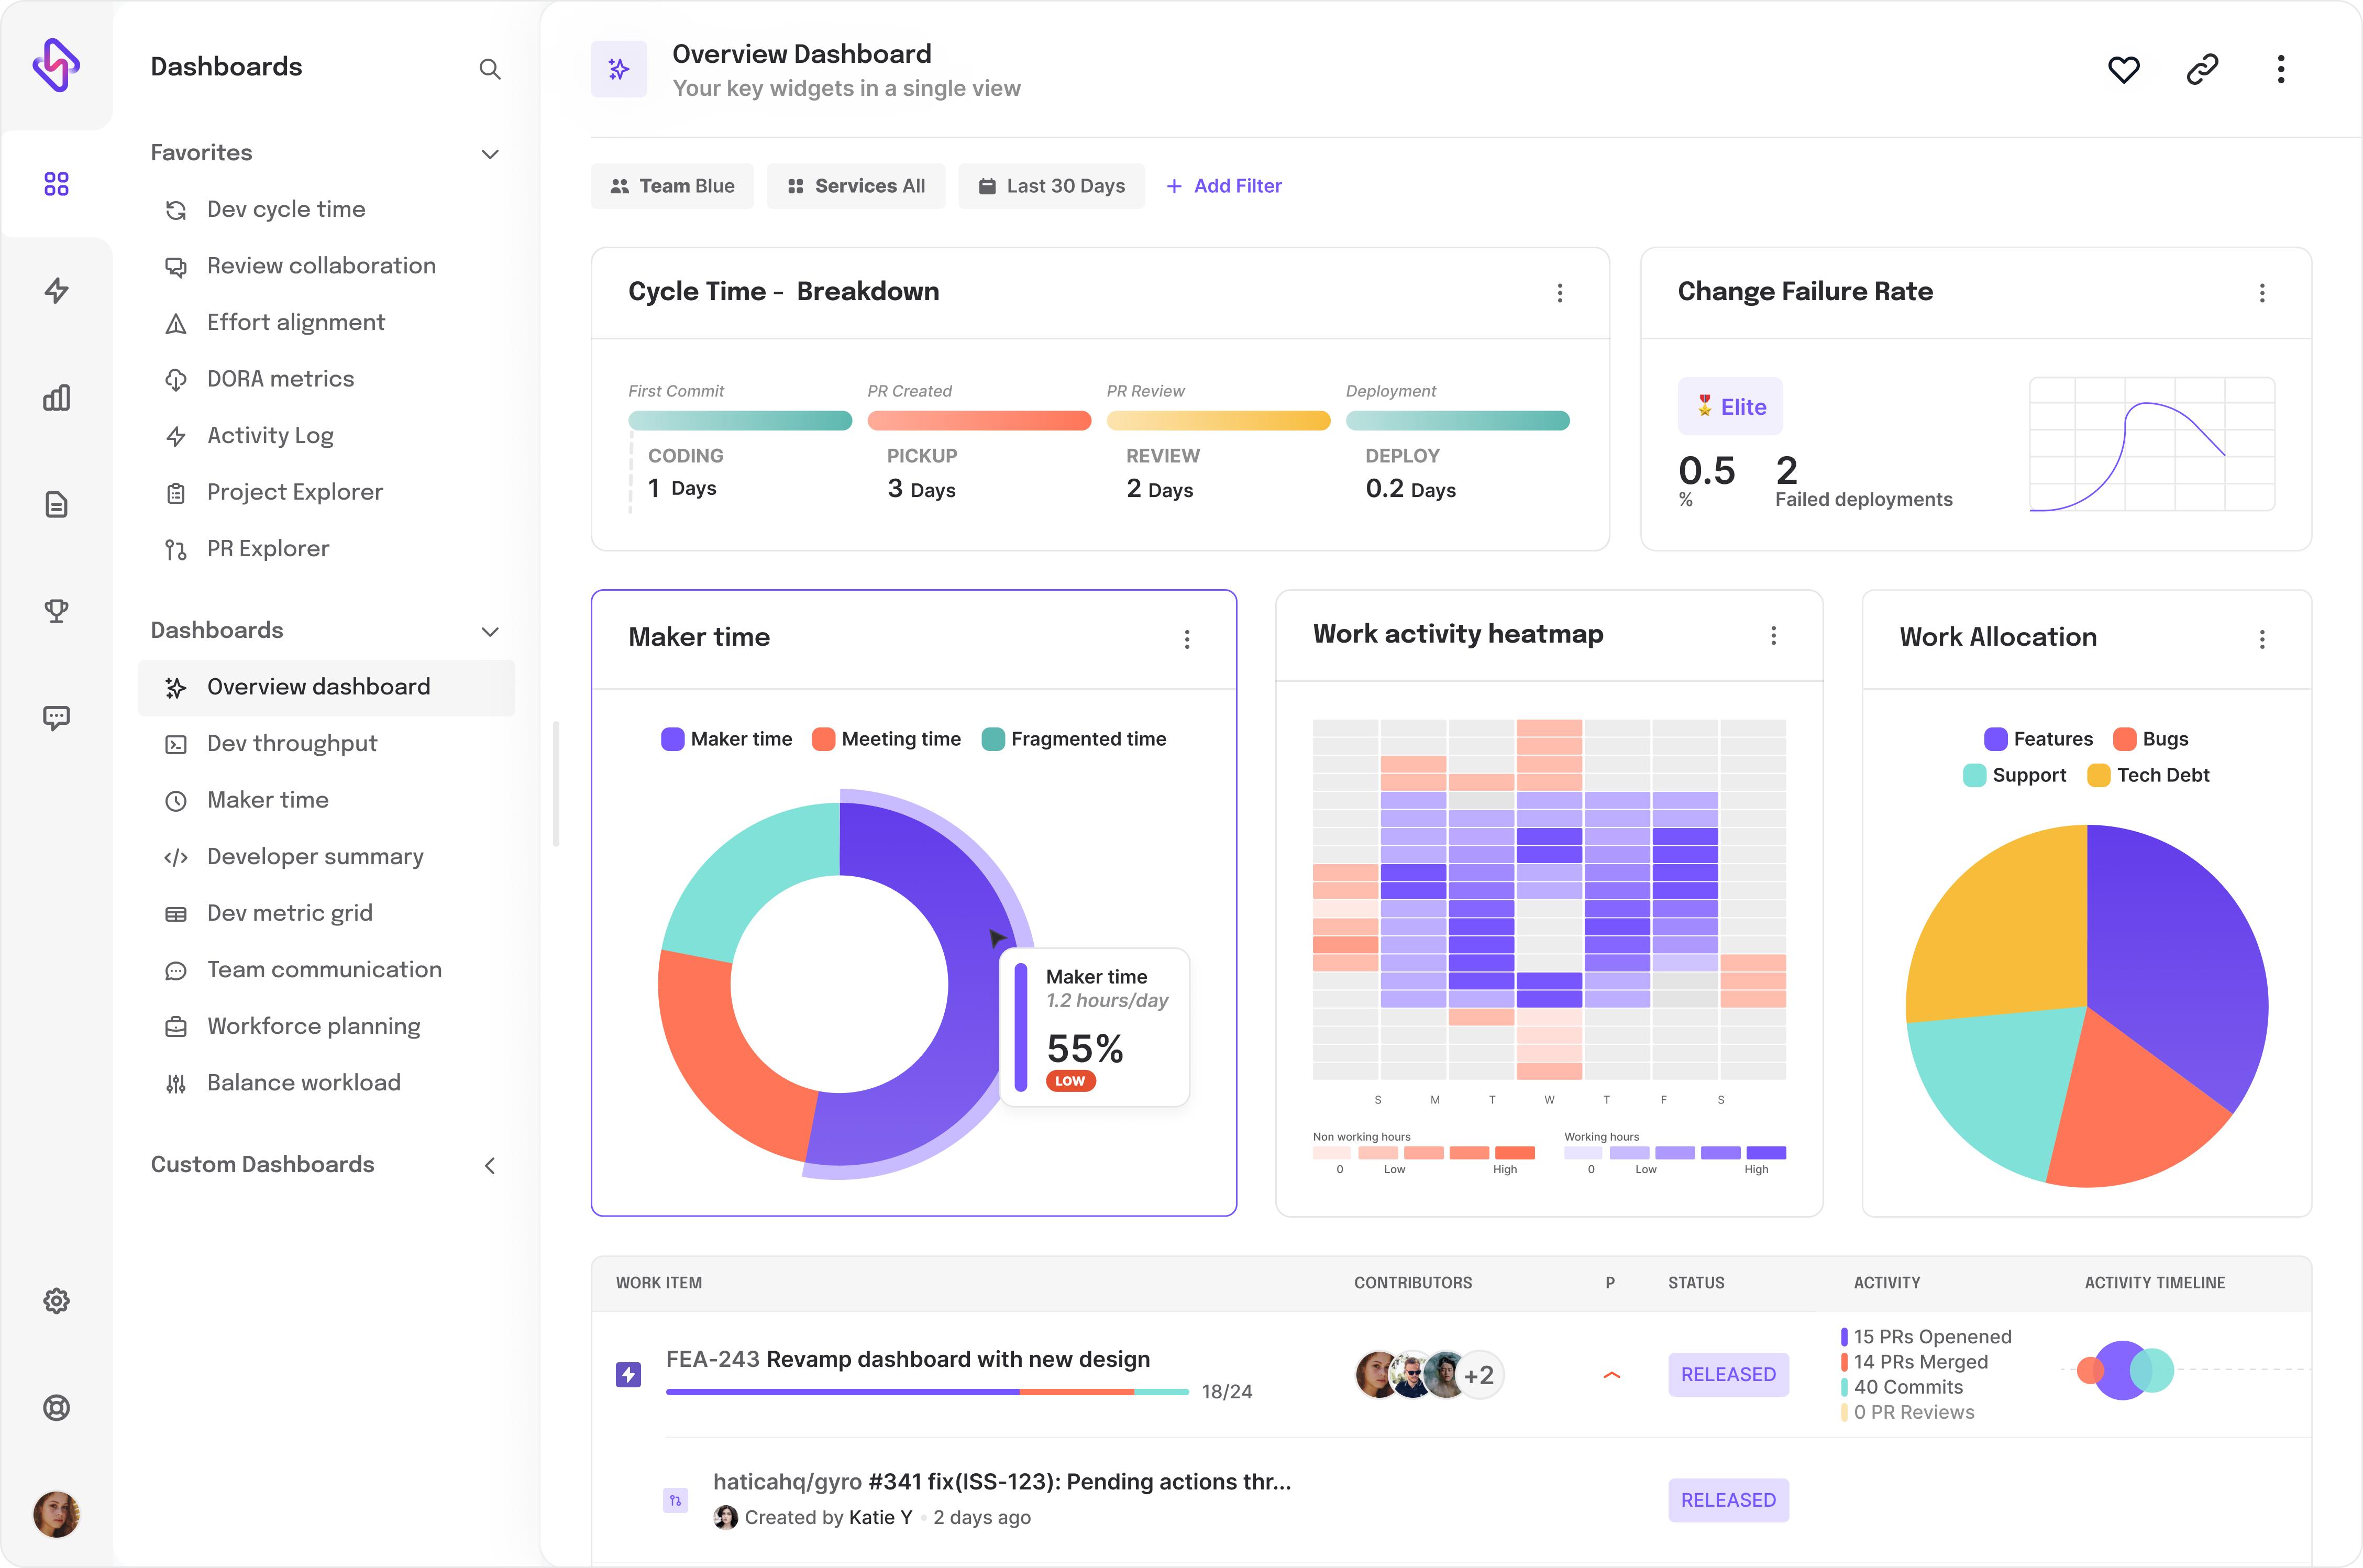
- Cycle time i.e., Median time for a feature, aka backlog item to move through individual SDLC stages
- Throughput i.e., Number of stories, aka features delivered in a sprint cycle (for agile projects) or in a fixed time frame (weekly/monthly)
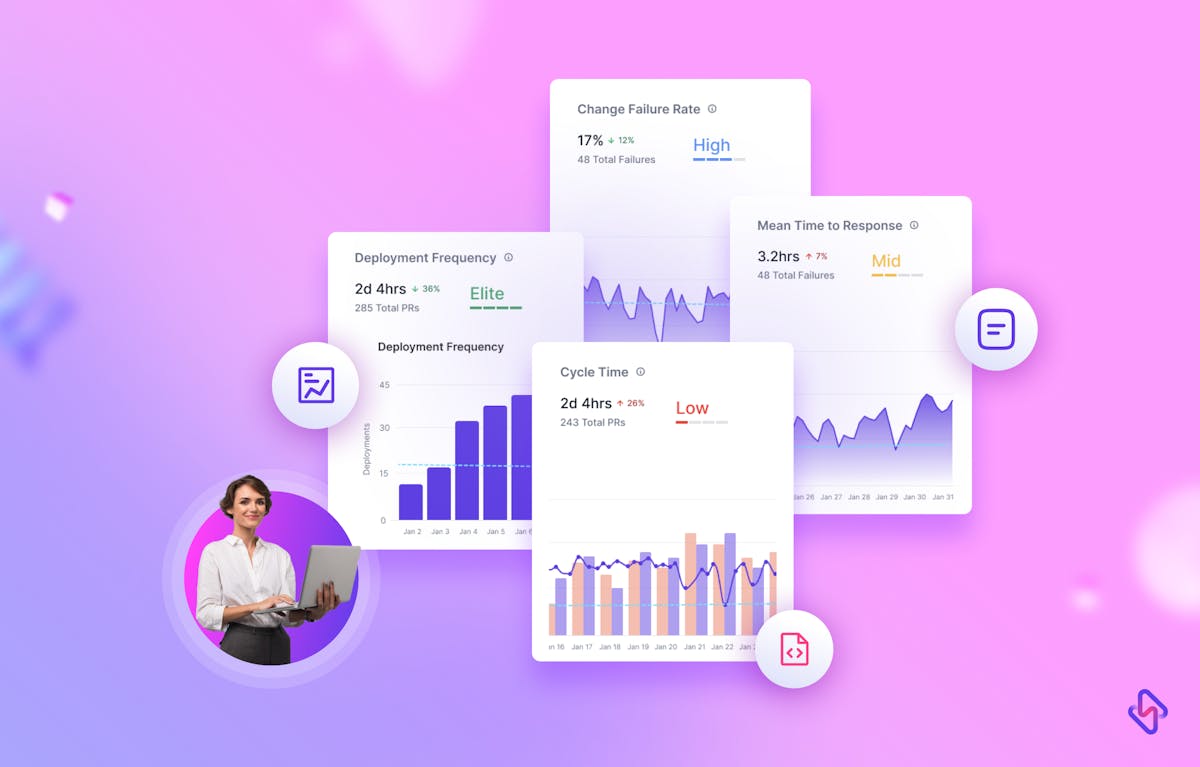
- Deployment frequency i.e., How often you push code to production
- Escaped Defects i.e., Total defects shipped to the end-user for whatsoever reasons
- Touch time i.e., Active amount of time developer(s) spends working on a feature
- Flow efficiency i.e., percentage of time a team spends actively working on a project rather than waiting for resources
- First-time pass rate i.e., Features making it through rigorous testing, integration, and deployment stages without requiring any rework
- Change failure rate i.e., How often a change or code push results in defects
- Mean time to repair (MTTR) i.e., How efficient are the team and the processes involved in fixing defects
- Mean time between failures (MTBF) i.e., How reliable is the system, the time it takes for the system and/or an individual component to fail
These engineering metrics are crucial for understanding how work is flowing through an organization and can help teams make data-driven decisions to improve their productivity and efficiency.
But not all these qualify as core value stream metrics. Some fall under DORA metrics. And some are useful only when they are clubbed and analyzed together with the core value stream flow metrics. It is sometimes useful to also look at ‘work efficiency, work in progress, and work breakdown’ project management KPIs to get a better understanding of value stream flow.
Skimming Value Out Of The Value Stream Metrics
You can use value stream metrics to:
- Estimate time for feature delivery in upcoming sprints/projects.
- Get insight into the velocity of the ongoing project.
- Identify & address the bottlenecks & inefficiencies that are slowing down the entire SDLC process.
- Visualize & optimize workstreams to deliver continuous value to the end-users by quickly responding to bugs & pending merge requests.
Let’s take some example scenarios to understand how you can make sense of value stream metrics.
The Scenario
Let’s say that you’re running an e-learning startup.
Your competitors are implementing features where-
- Random learners can compete with each other via quizzes.
- Top quiz performers can win brand swags & surprise gifts worth INR 2k.
- Learners can even form small & virtual learning groups for peer-to-peer learning and discussions.
- The learners of the app can even share their earned swag in the virtual group.
Now, you wanted to implement that as well in your app and had raised a request for the same to the product manager (PM). The PM (who also acted as the project manager for this feature) discussed the same with the engineering manager and ideated the plan with the design & development team.
So, we have three features & multiple functionalities within each of them:
- Quiz feature
undefinedundefinedundefined
- Top quiz performers' lucky swag winners
undefinedundefined
- Group learning feature
undefinedundefinedundefinedundefinedundefined
Case: Deployment Frequency For The Quiz Feature Is High, But The Throughput Is Low.
This means developers are raising merge requests (MR), but the feature is not getting completed i.e., high cycle time and lead time as well. If this is the case, you need to look at other metrics like touch time, change failure rate, and escaped defects to zero in on the bottlenecks and fix them.
- If touch time is low, and escape defects remain high — perhaps the developer & QA is not spending enough time fixing defects. Maybe, the developer is not available. If you’re using any engineering analytics tools — maybe look at the available bandwidth of the developer or the RACI matrix
- If touch time is high, and escape defects are high too — probably the team is not prioritizing critical defects and working on trivial ones. This is an engineering management issue and the team lead may need to intervene and help the QA & development team
- If the change failure rate is high, it means holistic QA is not being done right, thus resulting in failed components thus low throughput. Maybe, an engineering manager or engineering lead can facilitate the QA in gathering the right resources to identify the bugs.
Case: Perfect Lead Time for Quiz Feature and Cycle Time For The Group Feature, But Terribly High Lead Time For The Group Feature
It’s easy for engineering managers to read the wrong signal and think that the team allocated to develop the Group feature is slacking, but to surface the truth, you need to look at the whole picture by finding the missing pieces i.e., the value stream metrics of the SWAG winners algorithm.
Remember, value stream metrics are not just useful for analyzing individual teams, but they can also be looked upon as an aggregate of the different moving pieces of a project, especially the interdependent ones to look for efficiency and effectiveness at team level..
Here, we had one feature in the group component which had a dependency on the SWAG feature. So, if we only look at the value stream metric of the Group backlog item, we will be doing it all wrong.
Maybe, the cycle time for the SWAG algorithm feature is high, and so, the Group feature has a high lead time despite having a good cycle time because it is dependent on the SWAG feature.
If the SWAG feature has a low lead time, then you need to again look at touch time value stream metrics, as low cycle time means individual SDLC stages have no flaws. So, it could be a developer productivity/availability challenge.
Conclusion
Help bottom-up adoption of value stream metrics across your development teams to sustainably deliver value to end-users and safeguard your projects from rafting into the Bermuda Triangle. Equip your engineering teams with Hatica, which helps you improve some key value stream metrics like Cycle time by > 50%. Not just that, it helps you aggregate data points from multiple sources like Git, Slack, Jira, and Jenkins, and analyze engineering signals to unlock developer productivity and set you on the path to success.
Subscribe to the Hatica blog today to read more about unblocking developers, and boosting productivity with engineering analytics.