[

🎉

G2 Winter 2024 Report] Hatica Recognized as Momentum Leader with Best Estimated ROI!Read More ->

4 Key DevOps Metrics for improved efficiency and performance

Enhance DevOps efficiency with key metrics: Deployment Frequency, Lead Time, Change Failure Rate, MTTR. Improve software development practices.
4 key devops metrics to track for improved efficiency and performance

We’re seeing an increasing number of organizations renew their focus on adopting and improving their DevOps practices to help optimize their software development life cycle and improve their delivery velocity to reach markets and cutomers faster. Here’s all you need ot know about the four key DevOps metrics and how teams can use these metrics to improve dev efficiency and performance to build better and faster products for their customers.  

What are DevOps metrics? 

DevOps metrics are the data points used to measure the performance and efficiency of a team’s DevOps software development process. Since DevOps integrates the functions of both development and operation, the metrics should be able to measure and optimize the performance of both the processes and people involved.

Measuring and gathering insights from DevOps metrics can help managers gather actionable insights into their team’s processes and bottlenecks and take swift remedial actions in case of blockers. Thus, DevOps metrics enable temas in the successful completion of goals. 

The four key DevOps metrics:

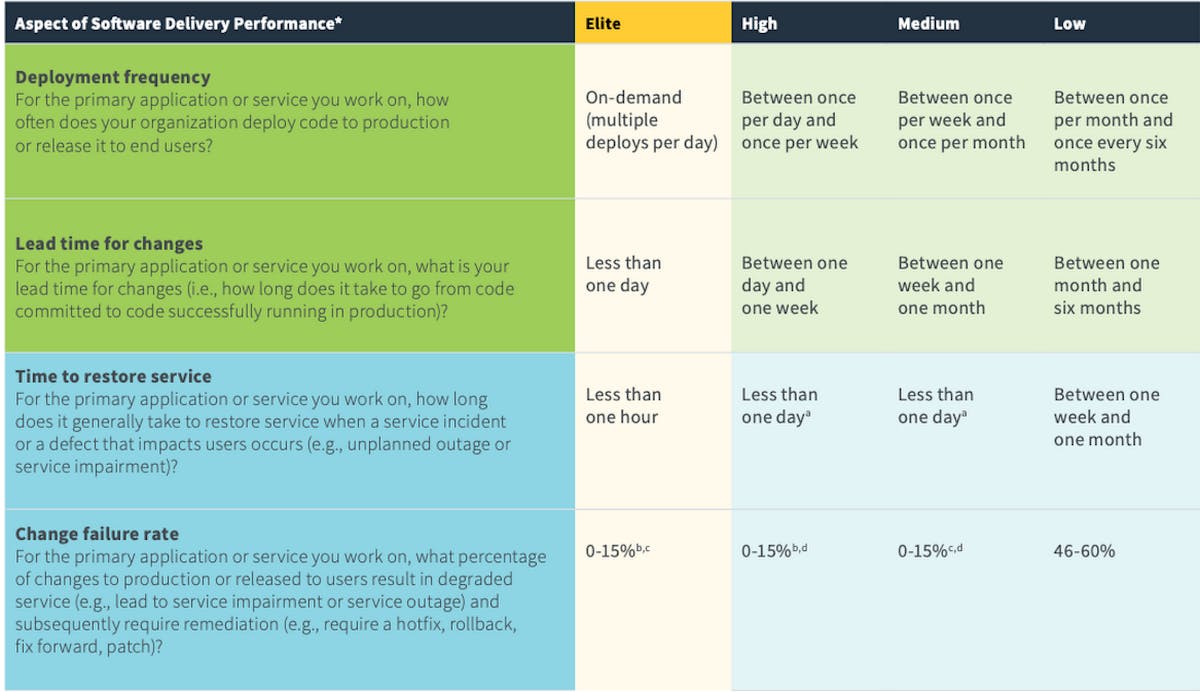
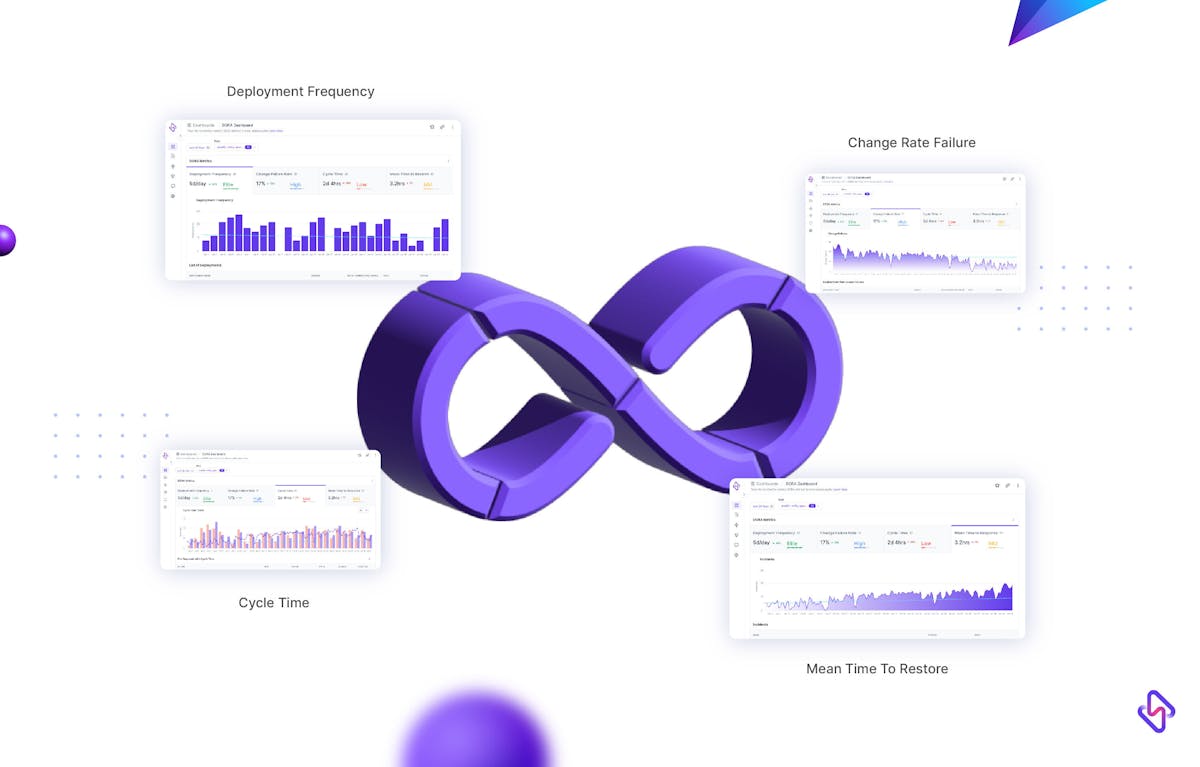
Google's DevOps Research and Assessment (DORA) team has identified four crucial metrics that can indicate and optimize the health of DevOps performance. The DORA Four Keys project aims at generating valuable data and gathering insights to amplify engineering productivity surrounding DevOps practices. Below are the four core DevOps metrics, known more commonly as DORA metrics

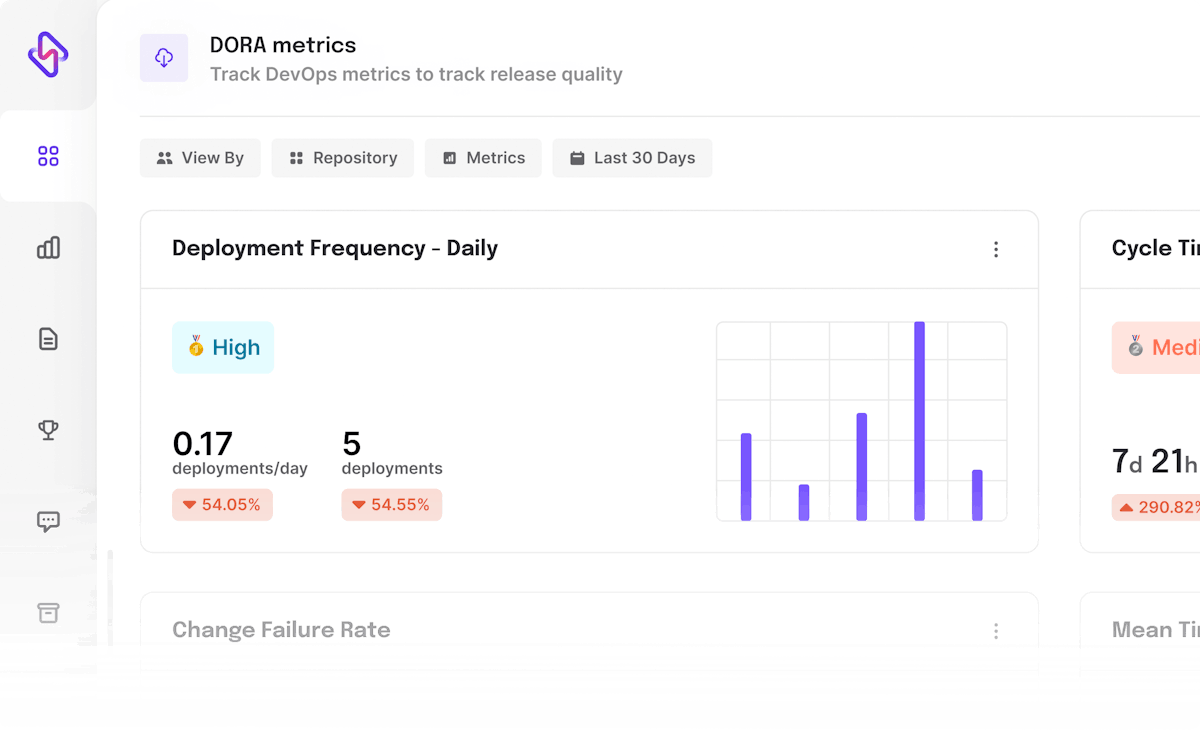
  • Deployment Frequency - Measures how often a team successfully releases changes to production, indicating the speed with which the team delivers software
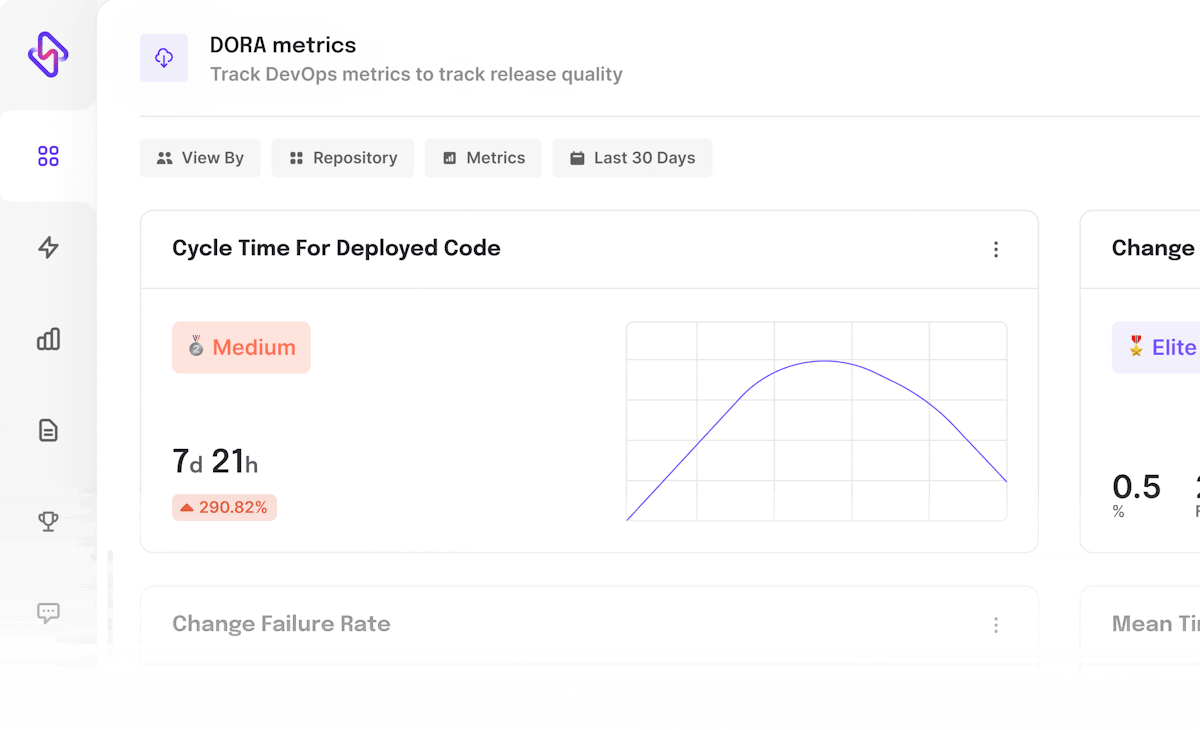
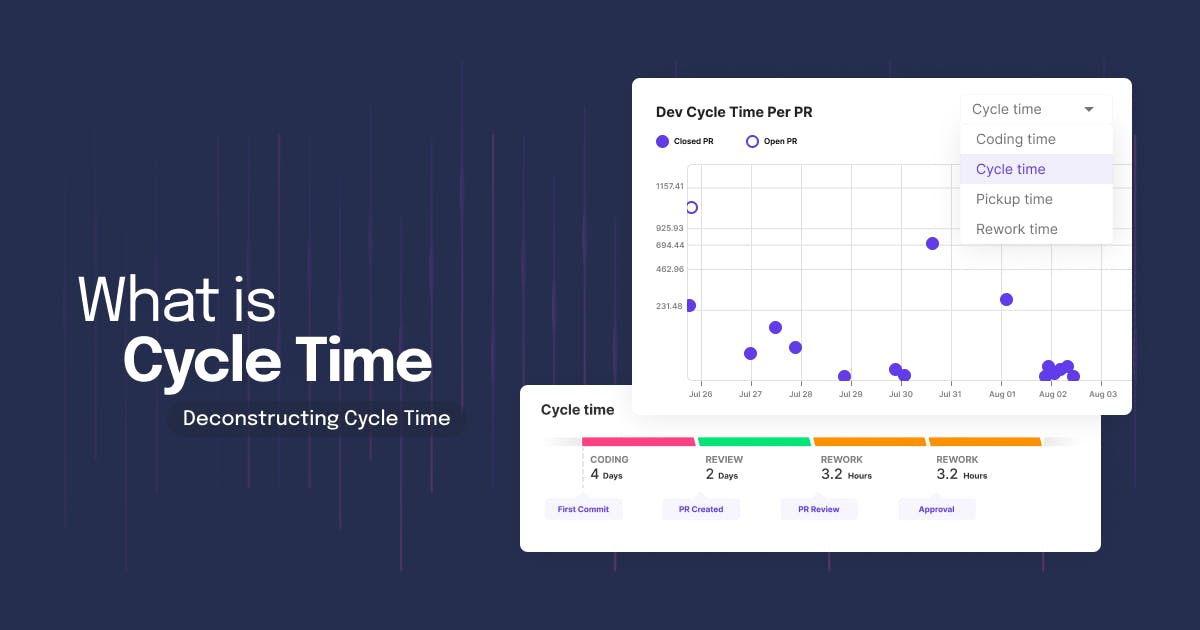
  • Change Lead Time: The time from when the work on a change request begins to when it is put to production and consequently given to the customer is known as Change Lead Time. Teams use lead time to determine the efficiency of the development process
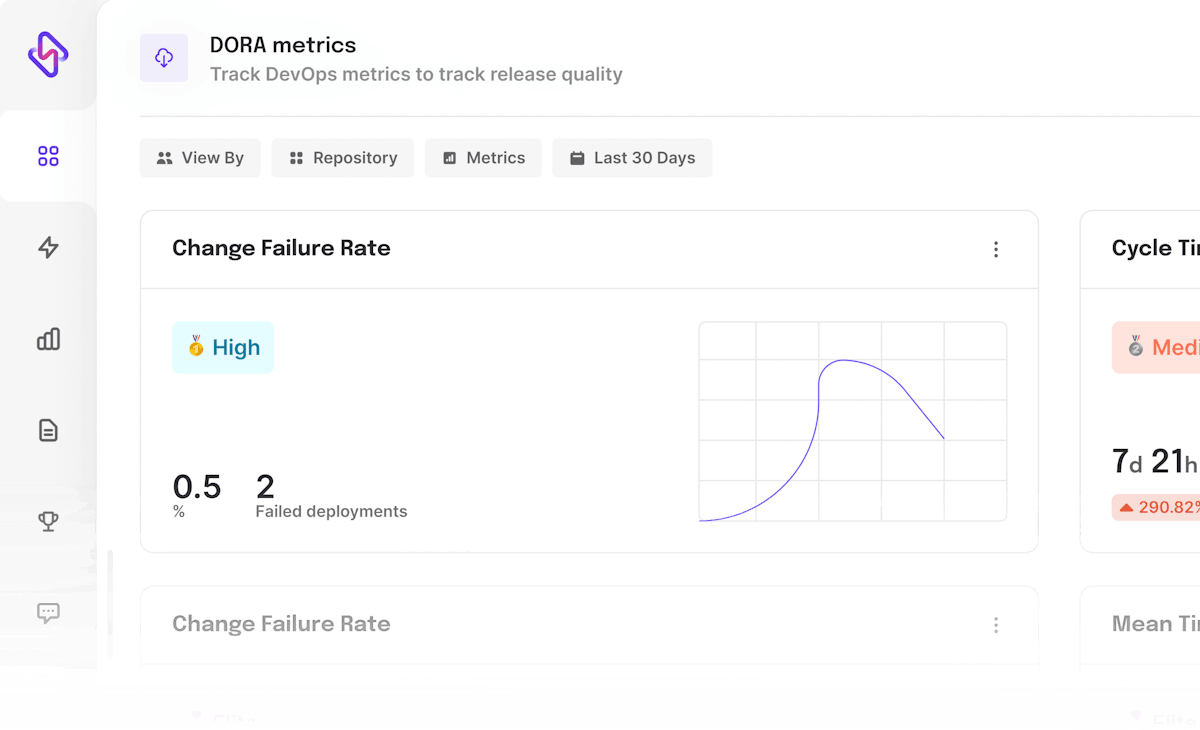
  • Change Failure Rate: Measures the rate at which production changes cause a failure after release. It is an indicator of the quality of code produced by a team.
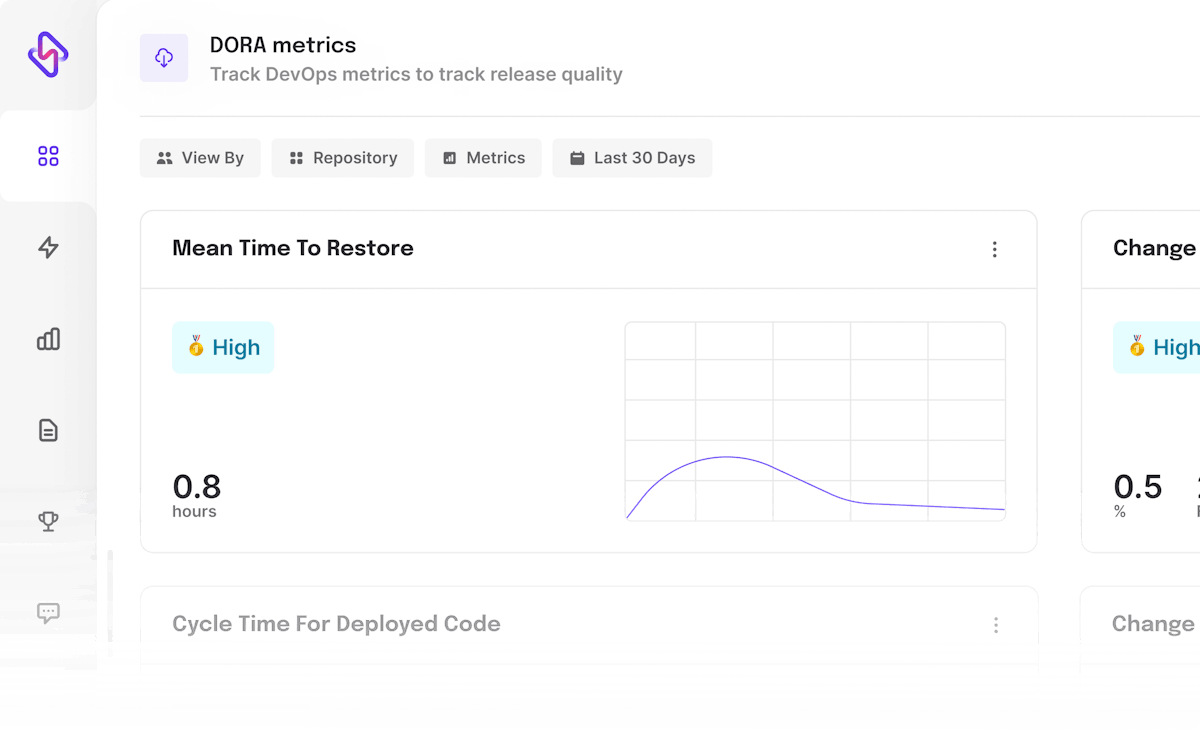
  • Mean Time to Restore: Measures how long it takes for an incident or failure to be resolved through a production change. 

While the measures of Deployment Frequency and Change Lead Time calculate the velocity of a team, the Change Failure Rate and Mean Time to Restore metrics focus on the stability of the software. 

According to the 2019 Accelerate State of DevOps Report, this format of the DevOps metrics analyzes and categorizes teams into Low, Medium, High and Elite performers, with the latter being twice as likely to meet or exceed their organizational performance goals. By employing these indicators, organizations can track and improve the teams' performance and effectiveness of the processes.

Deployment Frequency

Deployment Frequency from DORA Metrics dashboard - Hatica

The Deployment Frequency of a team directly translates into how fast it is in deploying codes or releases to production. This DevOps metric can vary across teams, features, and organizations. It also depends on the product and the internal deployment criteria. For instance, some applications may commit to only a few big releases a year, whereas others can make numerous small deployments in a single quarter.

How Deployment Frequency Impacts Business:

A higher deployment frequency ratio might indicate that the teams are tracking or improving or rolling out new features to the market faster. A higher deployment frequency also paves the way for a constant feedback loop between the customers and the team that translates to beter versions of the product being released to the end-user. The research by Google on DORA also suggests that proactive teams have higher deployment frequencies, meaning they can deploy on-demand consistently.

How to measure it:

Tracking the deployment frequency over an extended period of time can help track the change in velocity, trace bottlenecks, and take corrective actions quicker. An effective way to measure Deployment frequency is by gathering data from GitHub, Jira, and others to identify if the codes planned are shipped. Doing this not only allows managers to track the deployment frequency, but also weed out blockers as the regular focus on Deployment Frequency shines a light on the missed deployments and understands the pattern and reason behind the same.

Tips to achieve higher Deployment Frequency:

  • Automate repetitive tasks in the deployment process and set up and configure Continous Delivery pipelines
  • Make continuous improvements to the releases to optimize the end result
  • Get constant feedback on improvements only when necessary 
  • Be clear on the requirements and expectations, leaving no room for unwanted scope creeps
  • Optimize the cycle times to be more efficient to ensure the deployments occur at the regular intervals

Change Lead Time

Teams use change lead time (not to be confused with cycle time/lead time) to determine how efficient their development process is. Long lead times might be caused by an inefficient procedure or a bottleneck in the development or deployment pipeline.Teams often aim for shorter lead times, but a higher lead time may not always be a sign of trouble. Some releases can be complex and may require more time to deliver. 

Cycle time from DORA Metrics dashboard - Hatica

How Change Lead Time Impacts Business:

The LTC metric helps track the inefficiencies in the process. One of the primary aims of lead time optimization is to increase deployment through automation, mostly the testing process, to shorten the overall time to deployment. Like deployment frequency, lead time can also vary across teams and products. Hence, organizations should track, set benchmarks, and compare individual team performances over time rather than compare them with other teams. 

How to measure it:

Lead time is calculated by measuring the time between the initial commit and the date the release goes into production. Since lead times consist of multiple stages in the development cycle, teams should calculate the time at every stage of the development process to identify bottlenecks. Keeping track of the cycle time can help understand the different steps in the development process, identify the problematic areas and perform RCA of the same. Doing this consistently helps uncover bottlenecks and strategize better in any future development cycles.

Tips to optimize Lead Time:

A crucial factor in arriving at a shorter lead time is improving the collaboration between the testing and development teams to improve quality assurance. This helps the manager to gain a better understanding of the DevOps cycle time.

  • Automated testing can eliminate the duplicate effort and trivial changes that eat up the developer's time. 
  • Working in small increments to stay on top of the current module to ensure there are no errors that may require rework in the future.
  • Make the changes to the duplicate version so that the primary code is not compromised.

Change Failure Rate

Change failure rate measures the percentage of deployments that fail in the production, requiring a bug fix or roll-back. This DevOps metric checks the number of deployments made against the number of failures to decode the efficiency of the DevOps process. 

Change Failure Rate from DORA Metrics dashboard - Hatica

How Change Failure Rate impacts the development process:

Change failure rate metrics tracks the time spent on remedying problems instead of developing new projects. This helps managers understand where their teams are spending their efforts and helps to align teams and processes towards spending more time in writing new code rather than dealing with errors and rework. 

How to measure it:

Dividing the number of deployment failures by the total number of deployments gives the CFR. Teams should ensure that changes failures rates are at a minimum. But this also does not mean spending too much time building and testing each module, as it could impact the delivery time. 

Tips to optimize Change Failure:

Change failure does not always indicate that a code is executed poorly. Sometimes, external factors like unclear requirements or minor bugs can cause the program to fail.

  • Ensure the codes are written, reviewed, and tested as per the sprint plan
  • Keeping the sprint velocity and code churn metrics in check can provide insights into the changes made and the reason behind it

Mean Time To Recovery (MTTR)

MTTR is the measure of the time taken for counter-measures to resolve an issue after deployment. A team’s ability to quickly recover from a failure is dependent on their ability to recognize a failure (MTTD) as soon as it occurs and release a remedy or roll back any changes that caused the failure. This is normally accomplished by continuously monitoring system health and notifying operations personnel whenever a failure occurs. 

MTTR from DORA Metrics dashboard - Hatica

How MTTR impacts the development process:

MTTR tests the speed at which a team is able to solve bugs or incidents. High-performing teams recover fast from incidents whereas lower-performing teams can take up to a week or longer to recover. Measuring the MTTR  is a crucial practice to ensure resiliency and stability.

How to measure it:

MTTR can be measured by calculating the time between when the incident occurrs and when it gets resolved. To resolve incidents, operations teams should be equipped with the right tools, protocols, and permissions.

Tips to optimize MTTR:

To achieve quick MTTR metrics, deploy software in small increments to reduce risk and deploy automated monitoring solutions to preempt failure.

  • Building more robust systems that are tested before a release
  • Better logging provides the data to diagnose and find the issue faster in case of failure
  • This can be achieved by constantly checking for errors and blockers 
State of devops report - 2021

Strategies to improve DORA metrics

Focus on the framework

Simply having the DORA metrics in place does not improve the development process. Managers should also draw up strategies on how to leverage and boost the DORA metrics. The best way to do this is to benchmark the team’s current standing and draw a roadmap of the goals and plans for the project. Two main factors to be focused on while defining goals and deadlines are Project Allocation and Project Planning Accuracy

Managers should identify the teams and allocate projects based on the business priority. An optimized project allocation process also helps ensure the engineering teams are working on the right project at any given time and make amendments if needed. 

Project Planning enables managers to stay on top of the timeline and ensure the target is met sprint on sprint. Measuring this consistently helps identify and tackle blockers that hinder progress. Here, metrics such as cycle time, code churns and sprint velocity provide the support needed to hit the goal for every sprint and meet the deadlines.

Foster collaboration

Defining goals and aligning the team towards the achievement of the goals can help achieve better outcomes. One effective way to do this is to conduct daily stand-up meetings to bring the team together and make the objectives clear. Stand-up meetings also keep everyone in the information loop of who is working on what, but more importantly, it helps teams identify blockers and plan roadmaps to resolve them. To make stand-up meetings efficient and effective, managers can adopt asynchronous stand-up meetings that not only serve the purpose but also preserves the focus time of the engineers and documents information for future reference. 

Build better workflows 

Managers should focus on creating data-based workflows. They should have the means to gather various software engineering metrics such as pull request metrics, developer focus time, team cycle time, code churn, and other metrics to devise a data-enriched process that is high on quality and has low chances of failure.

A call for CI/CD

Continuous Integration and Continuous Delivery combine the practices of both continuously integrating all written codes in a shared repository, triggering automated testing, and finally providing the means for continuous delivery. CI/CD automates most or all the manual intervention needed to get new code from a commit into production. This includes the stages of building, testing, and deployment. With a CI/CD pipeline in place, developers can rework and make changes to the codes, which are automatically tested and pushed for deployment. This promotes higher development frequency and lead time for changes while also limiting the room for change failures.

Conclusion 

💡 Measuring and using DevOps metrics can help teams deliver high-quality software continuously. Hatica equips dev team with the ability to measure and track performance across lead time for changes, change failure rate, deployment frequency, and MTTR allowing teams to accelerate velocity and increase quality. Request a demo →

Share this article:
Table of Contents
  • What are DevOps metrics? 
  • The four key DevOps metrics:
  • Deployment Frequency
  • Change Lead Time
  • Change Failure Rate
  • Mean Time To Recovery (MTTR)
  • Strategies to improve DORA metrics
  • Focus on the framework
  • Foster collaboration
  • Build better workflows 
  • A call for CI/CD
  • Conclusion 

Ready to dive in? Start your free trial today

Overview dashboard from Hatica