[

🎉

G2 Winter 2024 Report] Hatica Recognized as Momentum Leader with Best Estimated ROI!Read More ->

How to Use and Not Use DORA Metrics for Tracking Software Delivery?

DORA metrics play a vital role in tracking software delivery. Learn how to use and not misuse DORA metrics tracking software delivery.
Dora Metrics for tracking software delivery

The DORA metrics are one of the most talked about coding efficiency metrics in the software development world, besides Microsoft's SPACE. The metrics by Google are known to help teams with continuous improvement; yet most engineering leaders are unable to exploit DORA till its maximum best.

While a lot of engineering teams know that DORA is the solution, most of them struggle putting DORA into the right use. In this blog, let’s see how to use and not misuse DORA metrics for assessing project progress along with the software development lifecycle.

What Are DORA Metrics?

DORA is a combination of four DevOps metrics that helps engineering executives track throughput (velocity), quality, and stability of software delivery. In a nutshell, the metrics are:

  • Deployment frequency: The pace at which software is delivered, and code changes are shipped to production.
  • Change lead time: Total duration right from when a change request is raised till it's in production, and finally reaches the customer.
  • Change failure rate: Percentage of failed deployments, rollbacks, and patch fixers from total deployments
DORA Metrics overview by Hatica

Google has also added Reliability as the fifth DORA metric to track operational performance, in their latest State of DevOps report. Most engineering managers also like to couple cycle time as an additional benchmark for more accurate insights. The metrics offer a magnified look into the performed work items, the effectiveness of value stream management, and drive teams toward continuous improvement.

However, here’s a downside. DORA has been overly used by teams to measure positive performance, rather as an indicator of the health of the development process. DORA metrics, when used in a limiting context do not offer much insights into the ‘hows’ of your engineering process (we all have been here!). So, how to effectively use the four indicators then? The answer is here.

How to use DORA metrics the right way?

One way is to manually organize the team's data, find patterns, and trends during subsequent planning stages. However, the process is too good to be true, especially for large-sized teams. An engineering analytics platform takes care of the problem by automating the tracking process.

And that's where Hatica comes into the picture. Hatica does the heavy lifting in collating all team data at one place via integrations across VCS, CI/CD toolstack, REGEX for failure tracking, messaging and conferencing apps. The DORA dashboard takes into account deployments occurring in your code base and the way fixes are implemented, through analyzing repository, change failure, and deployment base.

DORA DevOps Performance Metrics

The data, when presented with enough context in the DORA dashboard, helps teams see the missing pieces of their SDLC equation. Hatica helps teams cross their logistical barrier by mentioning additional context around: deployment times, PR, progress status, and industry-accepted DORA benchmarks for continuous improvement.

Hatica then collates all data based on deployment size, PRs, code churn rate, productive throughput and more. Once DORA metrics are calculated, Hatica helps you to go the extra mile with additional inputs like cycle time, effort type breakdown, project delivery, sprint over sprint trends, and work allocation across members. Now that teams have all SDLC data at one place with full context and greater visibility into development impediments, it becomes easier to plan next steps in optimizing workflows, and bringing engineering excellence.

However, DORA, if measured in isolation, can only offer limited value to teams. Leaders now have to move beyond the DORA numbers, recognize patterns, and have a complete picture of each variable affecting SDLC. For instance, if a team's cycle time fluctuates and exceeds 3 days, while all other metrics are performing constantly, then managers need deeper visibility into deployment issues, PR pickup times, review practices, or slowdown in a dev's deep work. If the dev's coding days are fewer, then what causes them? Is it because of much technical debt, context switching, or something else that hasn't caught attention yet?

Hatica answers all these questions by aggregating data across 13 dashboards with added focus on overall team well-being, project delivery timelines, and software development success.

DORA dashboard from Hatica

With putting the dev metric grid, and DORA dashboard at one place, EMs can find patterns where one metric drives the other; low deployment frequency might be the result of high coding time, a high coding time owed to high interview load, or low maker time, and so on.

DORA dashboard and Dev Metric Grid by Hatica

With an extra layer of visibility into CI/CD, PRs, and merge time, it is easier for devs to work out the code-to-prod inefficiencies, and thus improve velocity and stability- all at once.

Common Misuses of Dora Metrics

The DORA team initially was looking to see what constitutes great developer teams, and discovered trunk based development. But it wasn’t enough, they wanted to measure the development process, and that’s how the four metrics were born. As the metrics got due recognition, organizations wanted to adopt DORA to teams anyhow, and replicate the value offered.

Most teams today are misusing DORA by thinking them to be the answers to their developmental bottlenecks. Measuring progress via metrics is fine, but the purpose of using them in the first place is to help you ask the right questions, and figure out workflows that work for your team. Using DORA in isolation, without considering variables that affect devs, their flows, and overall SDLC, will become counterproductive in the long run. Tracking DORA metrics due to the fear of missing out without understanding how to translate DORA metrics for their business is a pitfall that most teams might suffer.

How to use DORA metrics the right way?

DORA can only produce snowballing results if the team has enough context on why they want to use the metrics, and what they are measuring. The DORA results of two teams- one large and one small with similar deployment patterns, could be the same, so how do they move ahead? How to use the data to advance your team- that’s a question teams should ponder on, rather than just looking at numbers as absolutes. For example, if the change lead time is high, then you should think about bottlenecks in your onboarding process, or the devs are burdened with non-core work. These insights should come up only when you combine DORA with other engineering analytics, and have a complete picture of the development process- who does what, and how the work is done.

Another challenge with DORA comes with poor interpretation of data due to lack of uniformity. Two metrics, CFR, and MTTR talk about failed deployments, but don’t define what failure is. How can teams measure failure, if they don’t know what it is? Teams then use custom information to make sense of results, but usually fail. On the same lines, deployment time to staging suffers from contextual challenges as DORA only talks about changes in production, and leaves all other code changes to user discretion. The DORA metrics only tells us to focus on delivery discipline to improve software health, but how teams fix their software delivery to work daily?- this is something DORA cannot answer.

What’s more is the isolated data can only give leaders an added insight into the velocity and stability: both considered highly quantitative benchmarks. But what about the quality of work done, the productivity of developers, or the excess incident workload? The correlation is necessary to create an impactful difference in optimizing the whole dev process, and in turn, both developer, and final consumer experience. On top of it, just tracking DORA cannot help in realizing the business side of things. While EMs want to push for lead time or deployment frequency as a team's success criteria, the people at the top tier might be more interested in defining success based on features released per quarter/month/week.

These four metrics can only produce astounding results when implemented with a lot of subtlety and context. Even the Accelerate book talks about implementing the 24 behaviors of Appendix A first, before focusing on the metric outcomes. The broad focus of engineering leaders should still be on continuous improvement, product management, developer satisfaction, and everything, and anything impacting value delivery.

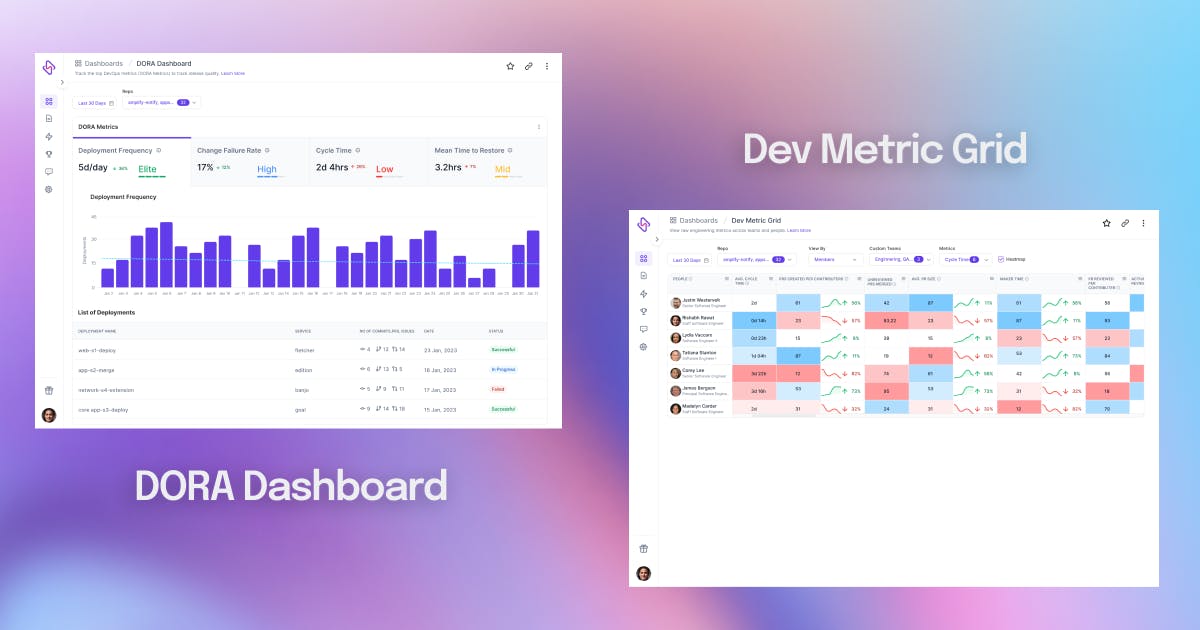
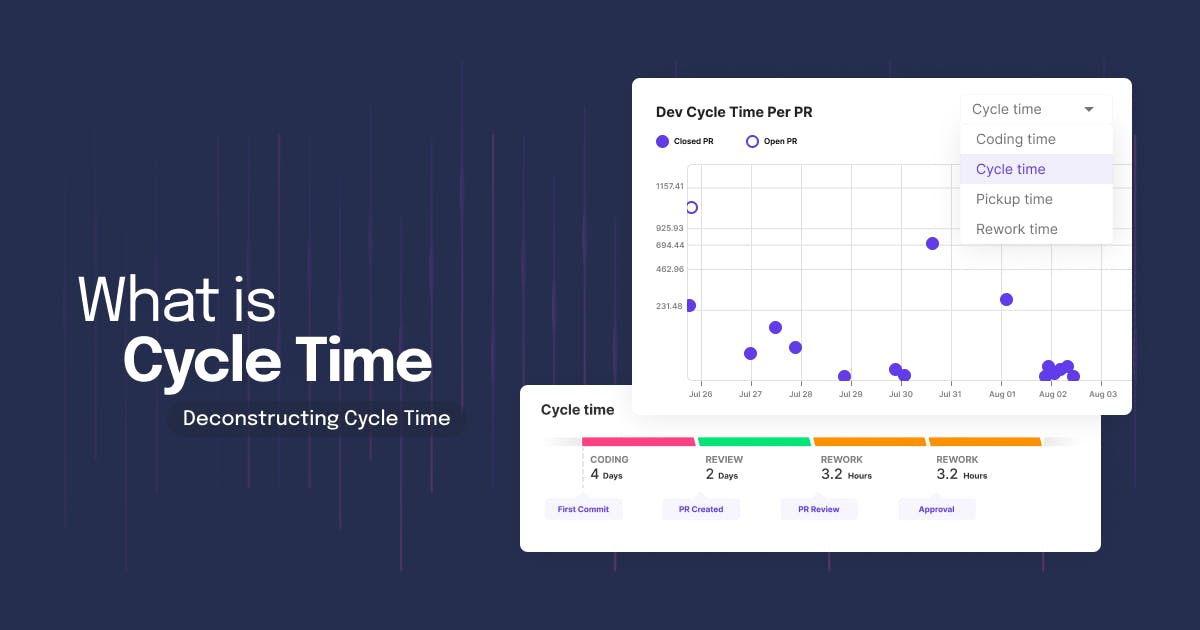
All of the above factors make a pressing case for the use of additional indexes for a proactive response, qualitative analysis of workflows, and SDLC predictability. Most organizations fail with DORA as they might have data for the four metrics in hand, but don't have the clarity to correlate with other critical indicators like review time, code churn, maker time, PR size, and more.

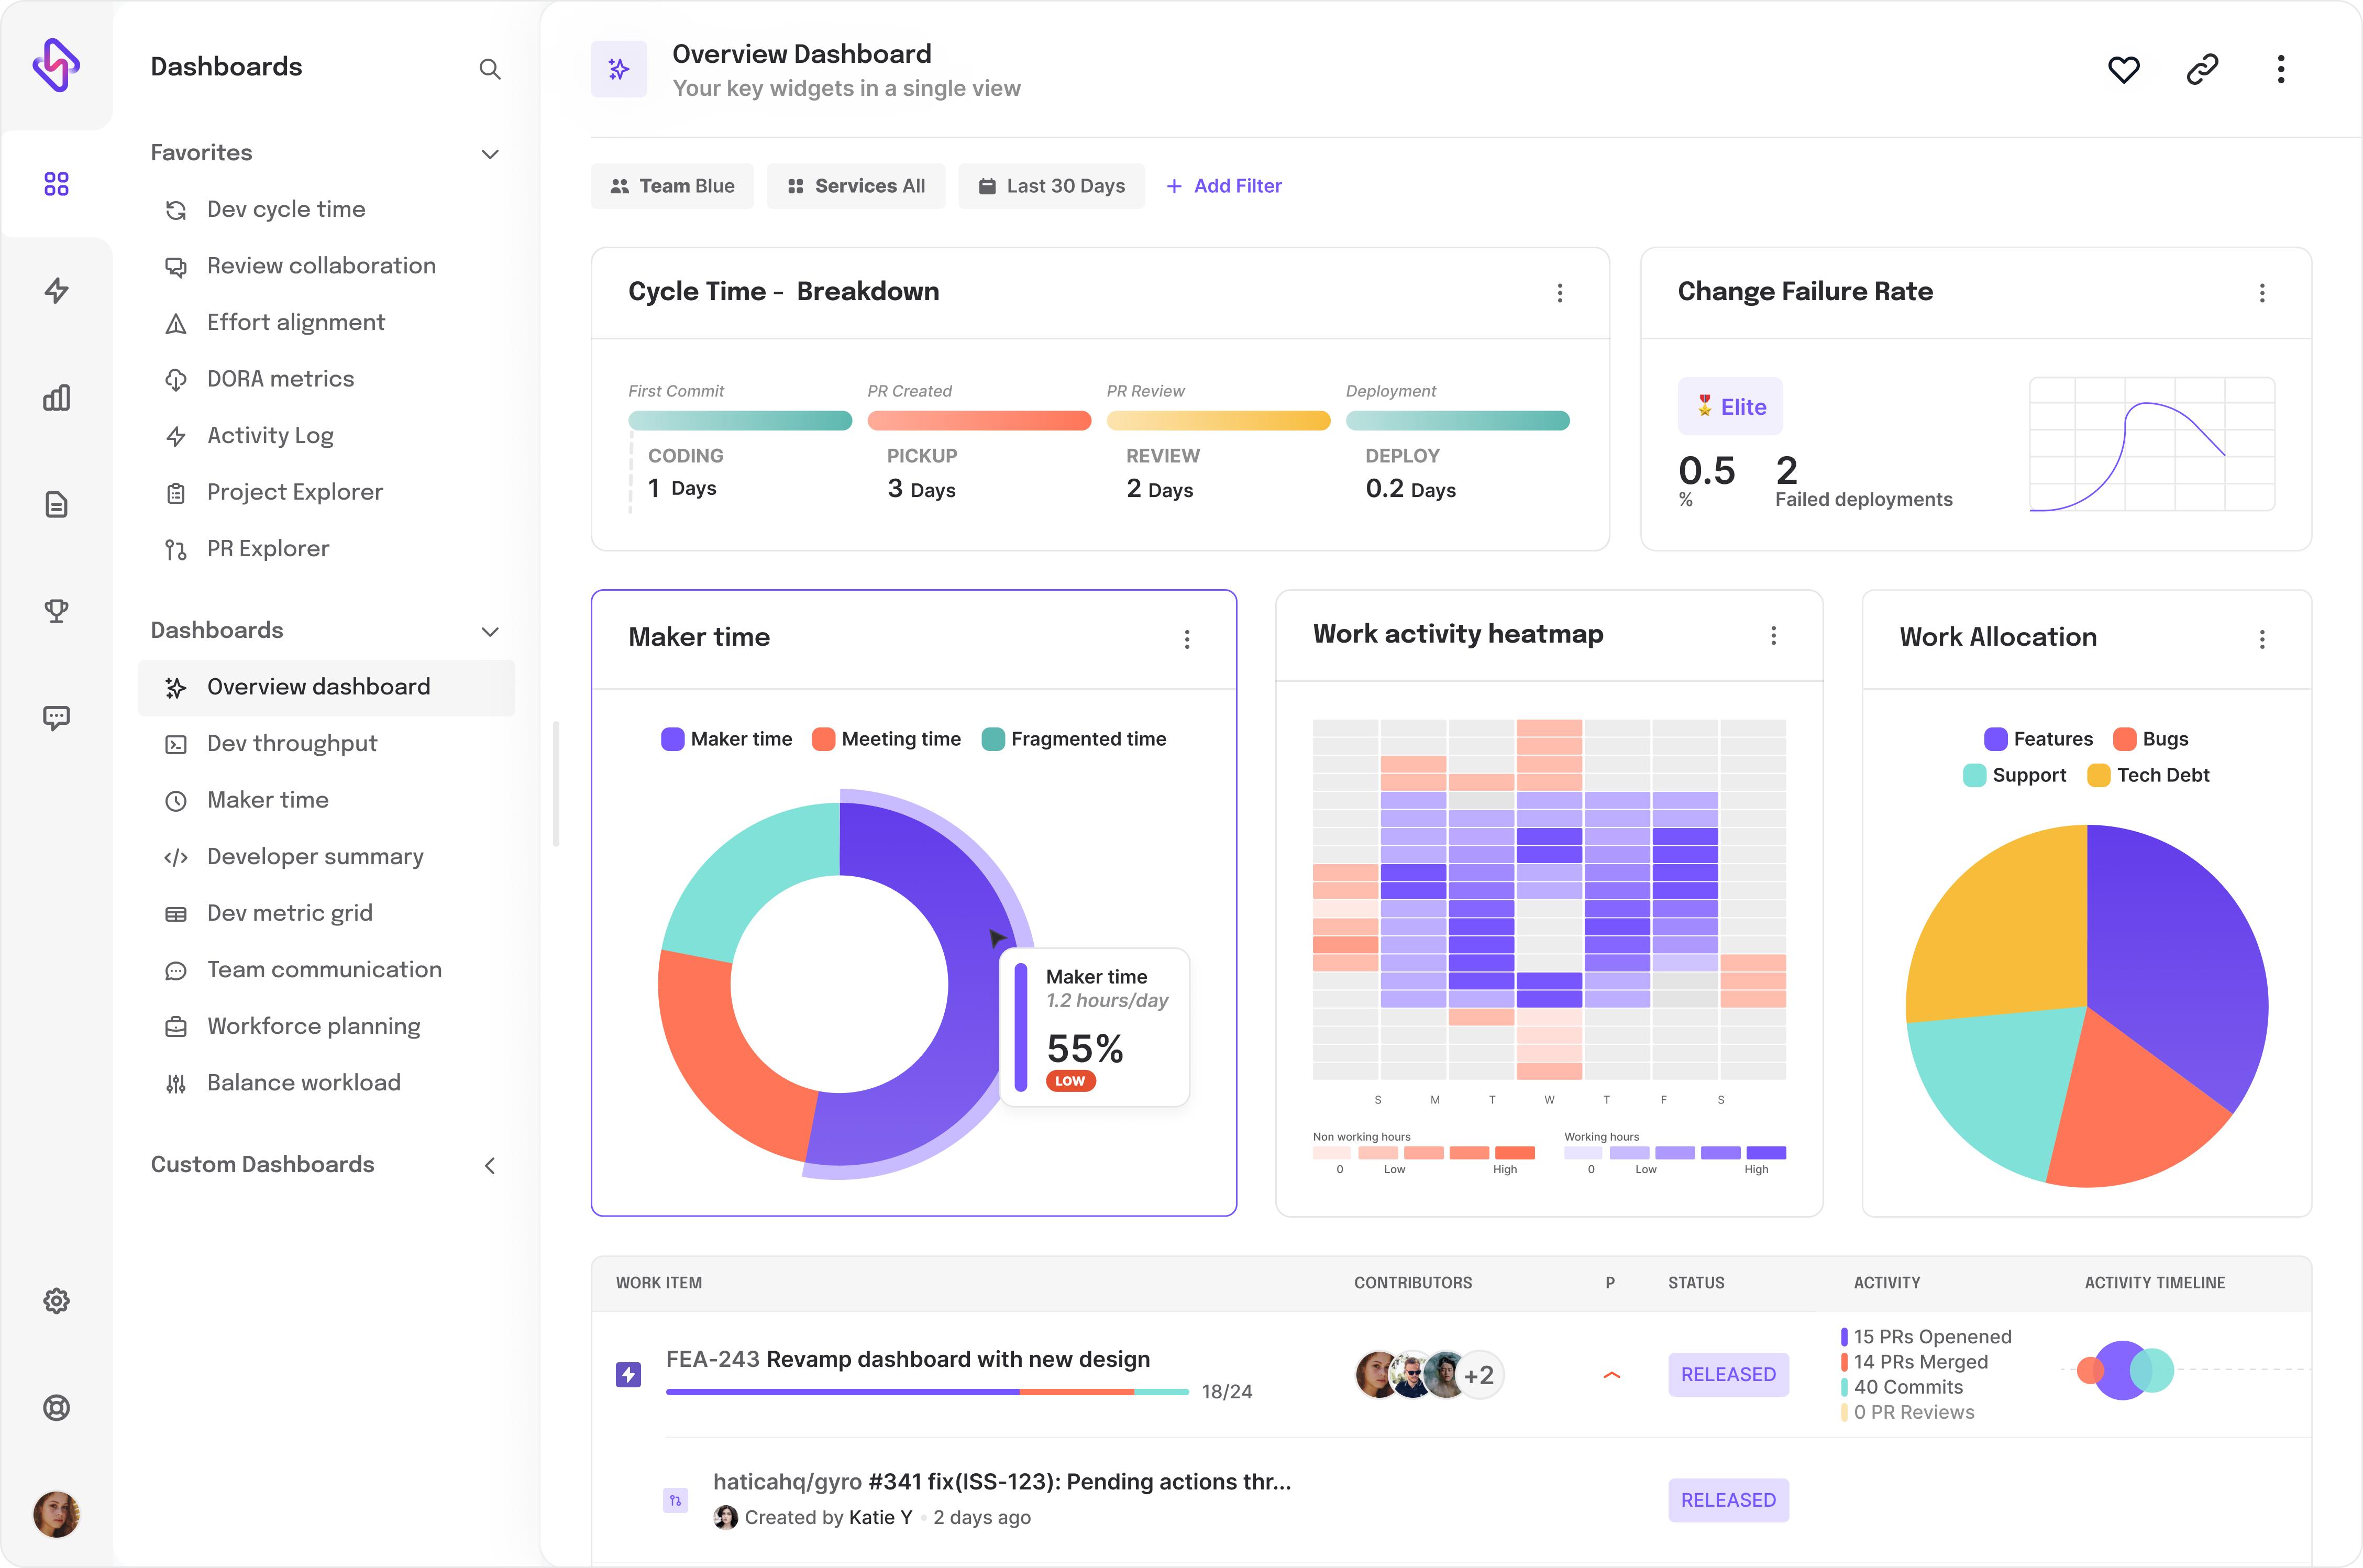
Only with a 360-degree profiling of the team's workflow, executives can create true workability and achieve business goals. The idea of deeper visibility also weeds out any false positives/negatives that could be part of your insights, derived from DORA's isolated dataset. DORA, when combined with more context, customization, and traceability, can offer a true picture of where an engineering team is headed, and the steps needed to be taken at all levels to resolve the passive bottlenecks, and hidden faultlines.

Conclusion

DORA is just a start and is serving its purpose well. However, only glancing at numbers isn't enough now, EMs also need to look for practices, and people behind the numbers and the barriers faced to realize their absolute best. Engineering excellence is directly proportional to a team's productivity and well-being, for a fact. Hatica has combined DORA with 130 other metrics across 13 dashboards, to drive an engineering team's success, create a culture of continuous improvement, and build on developer experience. Request a demo to know more →

FAQs

1. What are the benefits of DORA metrics for tracking software delivery?

The DORA metrics offer several benefits for tracking software delivery. Firstly, they provide objective and quantifiable measurements that help organizations assess and improve their software development and deployment processes. Secondly, these metrics enable organizations to compare their performance against industry benchmarks.

2. What are the key challenges of DORA metrics?

Data collection, tooling and automation, metric selection, understanding metrics, organizational culture, benchmarking and contextualization, developing practices, metric overload, balancing metrics, and continual development are key problems of DORA metrics.

3. What is DORA metrics core objective?

DORA metrics' primary goal is to monitor and analyze the efficacy of DevOps practices inside an organization. The ultimate objective is to develop a culture of continuous improvement and enable organizations to release software more quickly, more often, with higher quality, and greater dependability.

Share this article:
Table of Contents
  • What Are DORA Metrics?
  • How to use DORA metrics the right way?
  • Common Misuses of Dora Metrics
  • Conclusion
  • FAQs
  • 1. What are the benefits of DORA metrics for tracking software delivery?
  • 2. What are the key challenges of DORA metrics?
  • 3. What is DORA metrics core objective?

Ready to dive in? Start your free trial today

Overview dashboard from Hatica