[

🎉

G2 Spring 2024 Report] Hatica does it again! Wins Momentum Leader, Best Est. ROI and Users Love Us badge among many!Read More ->

How To Accurately Forecast Software Project Delivery?

Leverage actionable engineering metrics to forecast software project delivery with high precision. Create, and deliver exceptional value to users.
Why & How To Accurately Forecast Software Project Delivery?

Forecasting software project delivery is an achilles heel for both engineering managers, and product owners. Mostly if you plot a graph with two lines representing estimated software delivery timeline & actual work progress, it would be nothing less than a geometric tango of separation. 

As shared in a research paper,

  • 52.7% of software projects get delayed by as much as 198% of the estimates.
  • 70% of developers have rarely delivered projects/features on time.

You may wonder, “Okay! The project gets delayed. So what?”

Trust us, we have been there. These delays can further spiral down into subpar value delivery to customers, even leading to your competitor overtaking them, an overwhelmed engineering team, high engineering frictions, shooting software development costs, and lack of alignment between stakeholders.

Read more to understand the implications of delayed projects, and how you may accurately forecast software delivery.

The Impact Of Project Delivery Delays

Well, delays in software delivery accrues cost. Not only does the budget shoot off the ceiling, but you lose a lot of potential revenue, profits, and market share. 

A typical example of this could be AWS, GCP, and Azure (the 3 major cloud computing vendors). Industry wizards are of the opinion that AWS is ahead of GCP & Azure only because of the first-mover advantage. Even Jeff Bezos admitted that in an interview with Bloomberg where he called it a “Business Miracle”.

However, this wasn’t really a case of delayed delivery, but a case of what happens when you’re late to the market— your competitor gets way ahead of you. Nevertheless, it highlights the implications of being late to the game. Besides,

  • HBR quoted a report that “...on average, companies lose 33% of after-tax profit when they ship products six months late.” 
  • McKinsey reaffirms this further with their study. They found out that on average large IT projects (with a budget north of $15 Million) overshoot budget by 45%. Some even cost as much as 400%. Unbelievable, right? The scary part is that 17% of these projects go so out of control that they threaten the very existence of the enterprises.

There are other indirect, non-financial costs associated with delayed projects besides the increased cost of development & slashed profits-

  • Loss of customer loyalty
  • Collapsing employee morale
  • Low quality & unreliable products
  • Erosion in brand’s perceived value, trust, and credibility

Not to mention, the domino effect of delayed projects on other running & upcoming projects. The point being made here is that a lot is at stake if the project gets delayed. So, it is highly critical that teams and enterprises realize the importance of accurately forecasting project delivery.

You need to harness the right tools & methods to make precise software delivery predictions. And then the entire team needs to align their actions to efficiently execute the project plans, and deliver the software by the forecasted delivery deadline date. 

This goal-setting, and product delivery timeline predictability is important as a lot of other moving pieces like marketing & PR, branding, launch events, demand generation, sales, and support systems need to be in place at the time of the product launch for its success. None of these get done in seconds (unless you have Aladdin’s lamp, of course). 

But before you dive into how you may accurately predict a software project’s delivery timeline, it’s important to understand where the team usually goes wrong with IT project delivery time estimations. 

Why Do Organizations Fail To Forecast Project Delivery Accurately?

Are you a frequent defaulter when it comes to completing projects on time? 

If this is the case, maybe you’re underestimating the time, effort, and resources it would take to deliver the software applications.

Or do you always deliver projects on time? 

Well, that should be a good thing. But if it’s so, it’s more of a problem. The chances are that you are sandbagging i.e., making highly inflated time estimates. Maybe 2X or 3X higher. 

When it comes to project delivery timelines, being slightly late is a more healthy sign than completing on time or before time. Strange right?

Anyway, assuming that you’re not making inflated estimates, let’s try to zero in on why organizations fail to make accurate software project delivery forecasts.

Most teams & engineering leaders are not prone to estimation abyss. Engineering leaders' plans are mostly spot-on, but they fail to execute, aka they fail to implement the strategy. 

We believe that the calculation of covering 8 KM in less than 20 minutes at a speed of 30 km/hr is not wrong. But it’s flawed as it fails to recognize the fact that the roads could be highly clogged with high traffic around 7 PM. Besides, you have to follow traffic rules and wait when the traffic lights ask you to stop. Also, you’ve to drive safely and slowly at speed breakers. So, even if you have the efficiency (developer skills/capability) to drive at 30km/hr, and if you have the fuel (number of developers) too, you might still not be able to get to your home in less than 30-40 minutes (fail to deliver the projects on time).

Similarly, teams often underestimate how their projects will get impacted by:

  • sprint meetings
  • developer turnover
  • fluid business priorities
  • project budget overruns
  • developer interviews, and 
  • critical bugs in production that scream for immediate attention.

And because teams don’t account for these speed breakers, they fail at making accurate project delivery forecasting.

How To Forecast Project Delivery With Precision?

Well, you could harness probabilistic mathematical models like Monte Carlo Simulations and create custom solutions that devour past project data, and forecast project delivery estimates for the current/upcoming projects. It can help you predict-

  • When can you expect to deliver a specific feature?
  • If you could deliver a feature by a specific date?
  • How many features could be delivered by a specific time?
  • How many days could it take to deliver a specific feature, a set of backlog items, or the entire project?
  • Else, you may rely on your experience and ingenuity to make manual analogous predictions based on historical data of software projects similar in scope, size, and budget. Alternatively, you can use custom predictive analytics solutions to do the calculations for you. 

Ultimately, none of these will help you be accurate. Why? Because of Parkinson’s law (the adage)- Work expands to fill the time available for its completion. Does that mean you can never accurately forecast the project delivery timeline?

Well, the good news is ‘you can’.

The traffic on your way back home from the office is not much in your control. But how your project progresses is completely in your control. You don’t want roadblockers to decelerate the development velocity of your team? 

Cool, remove (in the long run), and predict their impacts before they start derailing your project.  

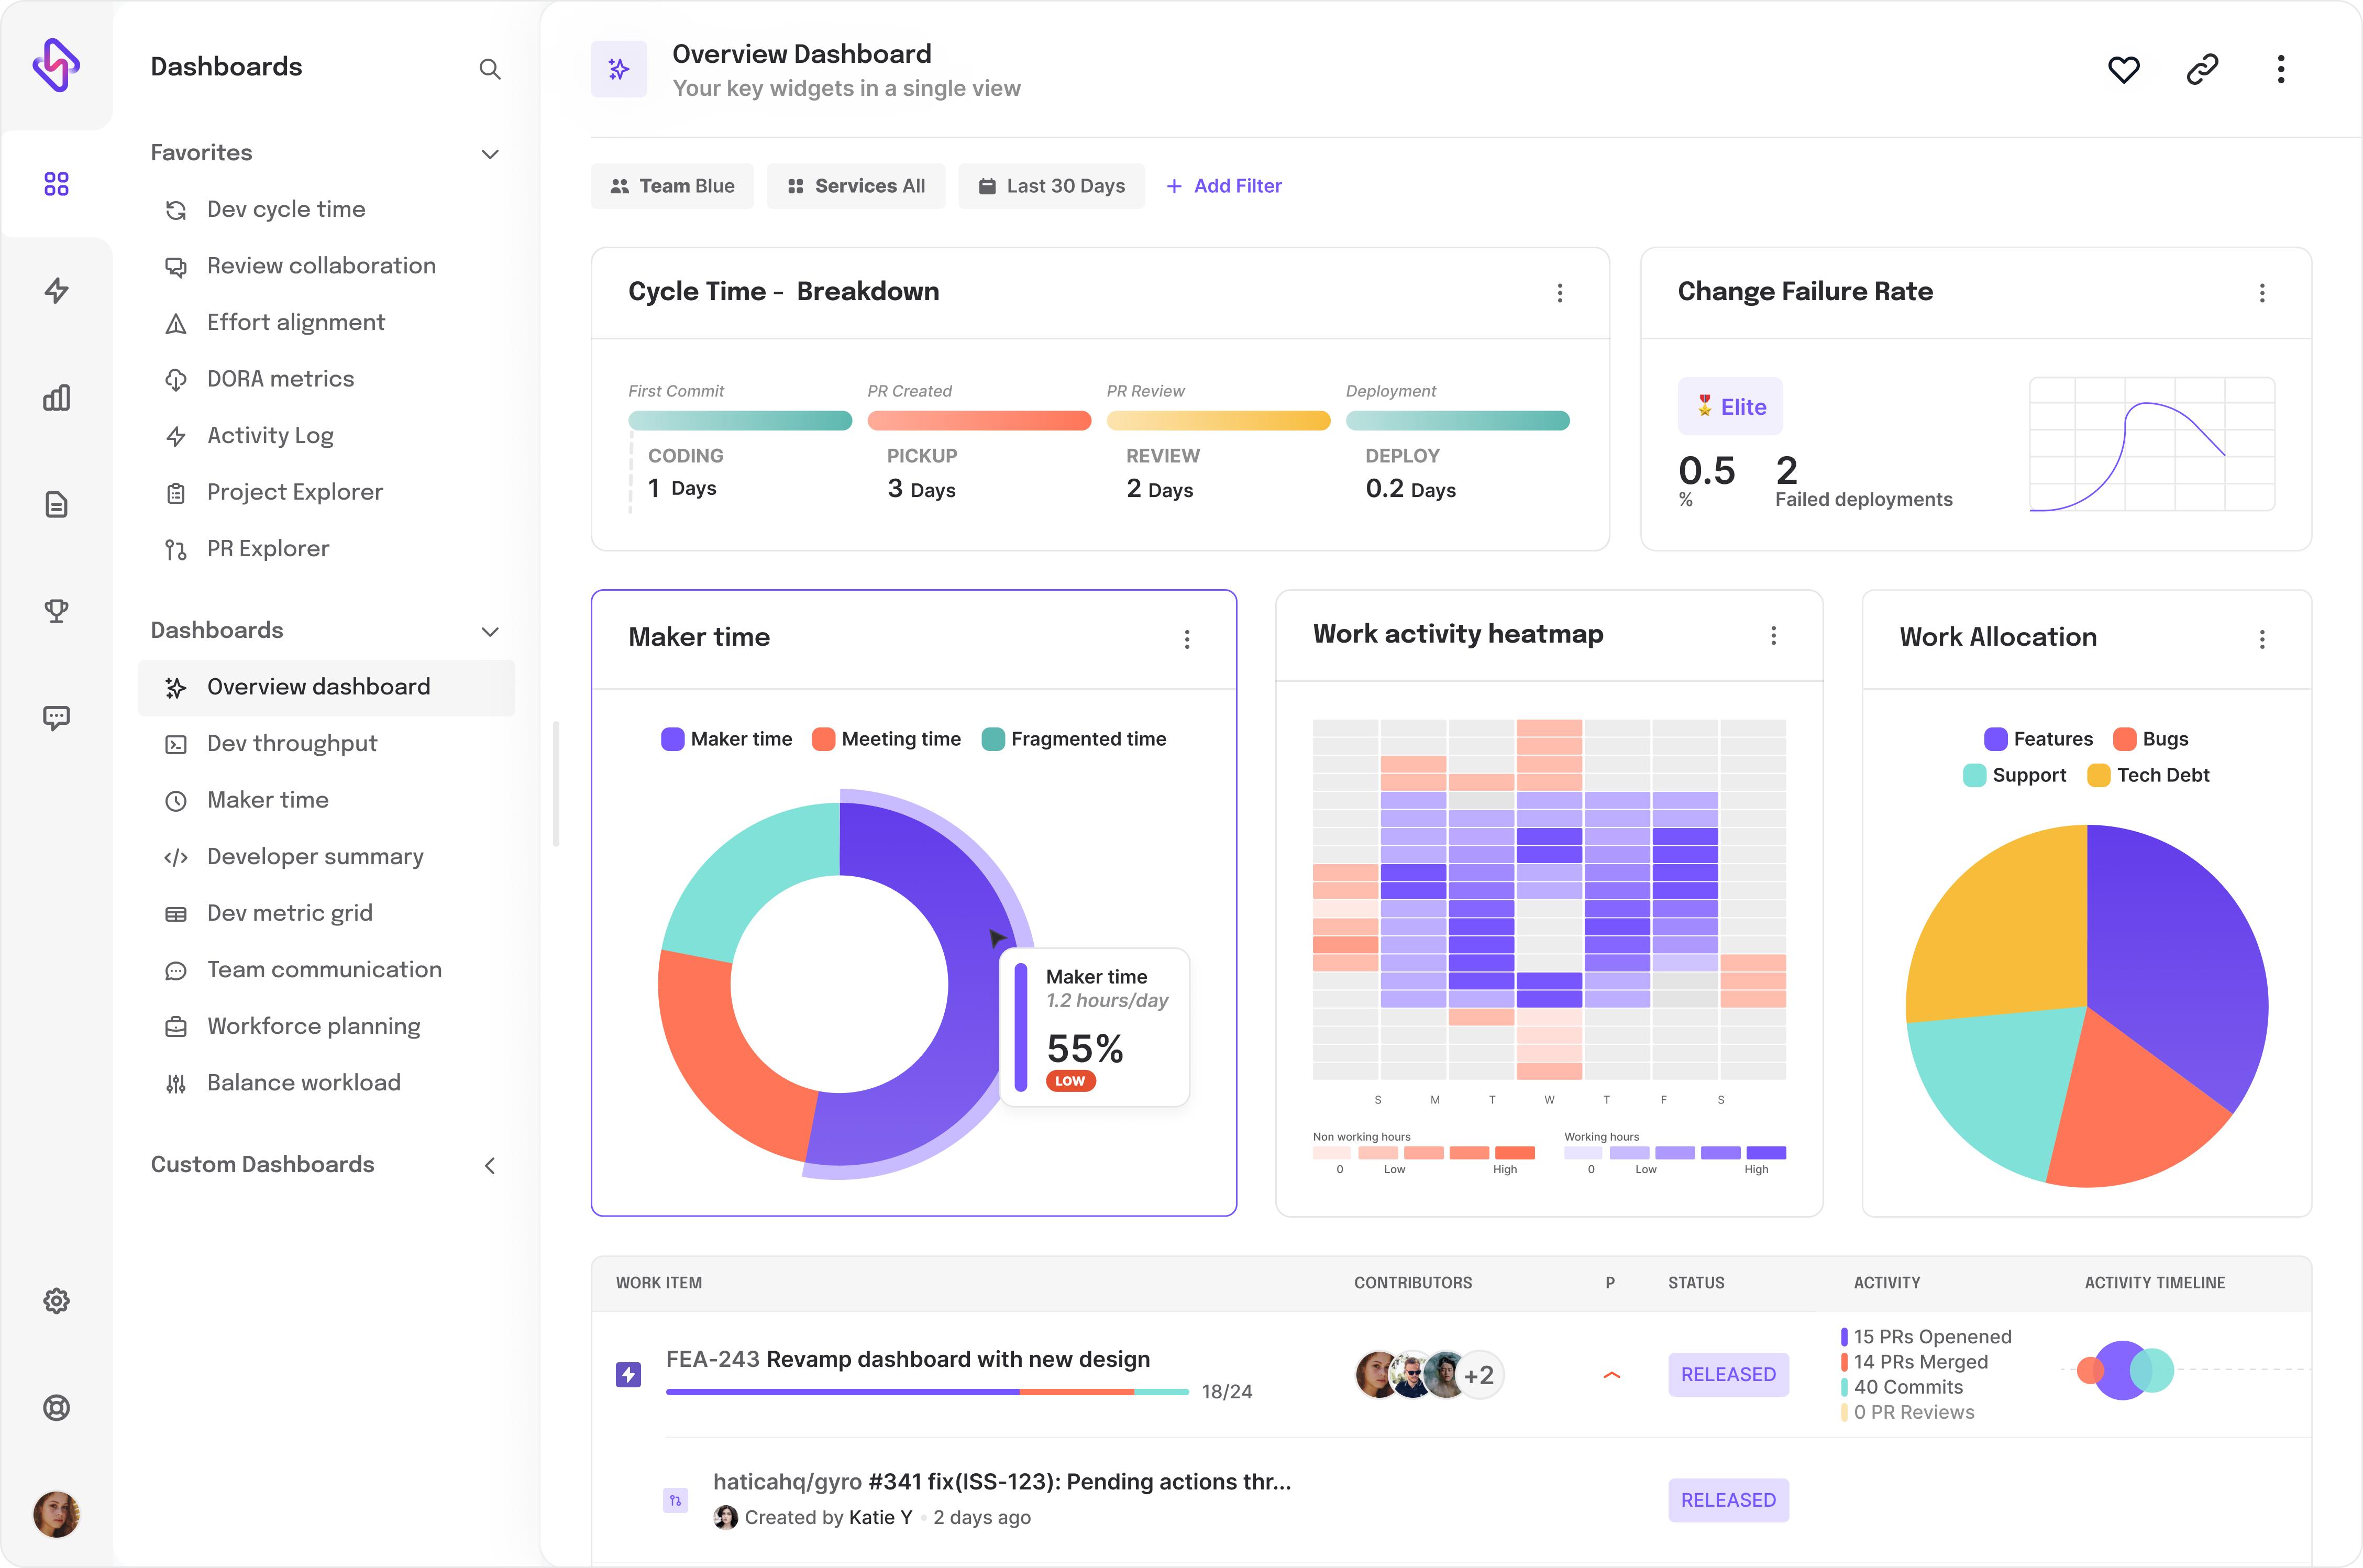
And that’s where Hatica comes into the picture. 

Improve Your Planning Accuracy With Hatica 

Hatica offers engineering leaders unparalleled visibility into your engineering processes & workflows. It puts contextual data into the driving seat and helps you navigate the bumpy SDLC roads smoothly.

How?

Well, it integrates with your existing tools stack using Connectors (Git, Jira, Slack, Pagerduty, Circle CI, etc.), pulls data from it, processes it, and serves you with actionable and visual engineering dashboards rich with metrics & insights gained from the mulled data. These insights help you get aligned to not just your forecasted project delivery timelines, but also to the business bottom line.

Hatica’s Project Delivery Overview dashboard provides engineering leaders with a holistic view of delivery metrics across teams & projects. 

Project delivery overview by Hatica

Basically, this is your single pane view to get the pulse of the project delivery status, and visualize how each variable can impact your delivery timelines. 

The #1 reason for most project delivery failures is ad-hoc, unplanned work that not only derails your sprint, but makes your short, time-boxed goals turn into never-ending marathons. 

With Hatica, teams can visualize their planning accuracy in real-time to know if they are on track or if other production bugs have deflected the team from working on critical features. 

For instance, if you delivered 120/180 backlog features, your planning accuracy would be 66.66%. Basically, the higher the planning accuracy percentage, the more accurate the forecasted software delivery.

Low planning accuracy could possibly be an indicator that your team is taking up a lot of unplanned work. Or there could be some other barrier, maybe developer turnover, high context switching, fuzzy requirements, inefficient processes, accrued technical debt, and whatnot. Therefore, it doesn’t end at planning accuracy, and you need to look at other metrics as well to get a complete picture. 

Once you have all contextual data, and historical analysis of last sprints at one place, your engineering team will get a breather on ‘why’ the project deliverables got shelves last sprint, and its domino effect on upcoming projects. 

The effort type breakdown metric lets you visualize the distribution of effort in terms of issues or story points. This way, you can further drill down on capacity planning, unload, and streamline developer workload and prioritize development work. 

effort alignment for your developer workload

The next best course of action is to know what priority items your ICs are working on, and if they are spending more time on technical debt, and KTLO or actually working on the roadmap. 

That’s not all we do. 

Engineering teams are today stretching themselves thin to know where they are spending every dollar while developing a product feature. And it is understandable, given software development alone costs 63% of the total project budget. It thus makes it super critical to have clarity on where each, and every dollar of your organization is being spent, the blockers in achieving project delivery, and probable outcomes from the investments made. 

Hatica comes with enough clarity for execs to divert investments towards roadmap, shift low priority into high priority work, and have more strategic discussions with stakeholders. As of now, teams have started saving upto 28x of their budget overruns after using Hatica, while keeping their project timelines on track.

Effort Allocation Dashboard on Hatica

But all these metrics are lagging indicators to understand your project progress. On the other side, the coincident, and leading indicators help you visualize the engineering velocity, and blockers in delivering your engineering efforts by analyzing PR hygiene, code health, code review efficiency, cycle time, and real-time insights into developer well-being. 

High cycle time seeks timely intervention, as this too could be a symptom of engineering process inefficiencies. This could be a signal that the project is deviating from the forecasted delivery timeline. High cycle time could mean that either the development team is taking longer to code, the review process is flawed, or the code quality is not apt. You can dig deeper-

Hatica's cycle time dashboard
  • You can analyze pickup time (delta of time when the PR gets raised and receives its first comment/reaction), review time (the time it takes from the first review to the final merge), reviewer reaction time, Active Reviewers Average (number of reviewers), etcetera to diagnose if the code review process needs improvement.
Breakdown of Cycle Time Metrics
  • By looking at the average PR size, PR throughput, and PR throughput per contributor metric, you can assess if the work was not planned properly. Bigger PR size means that the features are not broken down into individual units. Read the insight on PR best practices.
Detailed Code Cycle Time

Look at code churn, change failure rate, unresolved issues, and code quality metrics like code coverage, code smells, test success rate etcetera to gain a thorough understanding of what’s weighing down the team. Accordingly, you can take appropriate measures to fix them and make the team succeed.

Hatica also helps engineering managers to keep an eye on whether the development velocity is stable, exceeding, or lagging the expectations. Lagging development velocity could be an early symptom of projects that might get delayed if the challenges are not addressed with integrity.  

Improving development velocity is a priority check for EMs today. Know how to get it right!

For project delivery forecasts to be true, you would want critical & high-priority issues to be resolved faster. The Incident priority breakdown metric gives visibility into issues resolved, and breaks it down by priority. 

Screenshot of incident priority breakdown metric

One question that we have dodged so far in the discussion is whether we should strive to make accurate project delivery forecasts. Especially when there is this brimming sentiment that as soon as you chase velocity, there are high chances that you will incur tech debt and cause developer burnout.

Well, it’s true, but only when velocity metrics are your sole north star metrics, i.e., when you look at it in isolation and not in tandem with quality & well-being metrics. Doing so bars you from the bigger picture. Otherwise, it’s not true. We’ve written a detailed insight on the same, please read it to harness velocity metrics the right way.

Bottom Line: Protect Your Project Deliveries from Falling Apart. 

High operational efficiency, a modern development paradigm, and a culture that prioritizes developer well-being are the recipes for forecasting accurate project delivery. When your project cadence (timeline) is aligned with the business expectations, and when you bridge the gap between what’s promised and what’s delivered- you win, the team wins, the organization wins, and most importantly, the customer wins. The entire project delivery forecasting game is about unlocking agility, speed of iteration & improvements, and data & experience-led foresight into the project. 

And Hatica is your match-winning player here, the game changer! Leverage real-time reports generated by rigorous & continuous interpretations of technical data to gain critical business insights & visibility into your sprint health. Accordingly, effectively plan projects, eliminate unwanted surprises, and delight customers with continuous value delivery. 

Try Hatica today! Here’s your chance to book a free demo.

Share this article:
Table of Contents
  • The Impact Of Project Delivery Delays
  • Why Do Organizations Fail To Forecast Project Delivery Accurately?
  • How To Forecast Project Delivery With Precision?
  • Improve Your Planning Accuracy With Hatica 
  • Bottom Line: Protect Your Project Deliveries from Falling Apart. 

Ready to dive in? Start your free trial today

Overview dashboard from Hatica