A few months ago, McKinsey went live with their report: Yes, you can measure software developer productivity. The report got everyone talking, and asking – Can developer productivity be truly measured? If yes, how to quantify productivity for engineering teams without robotizing devs, or instilling the fear and anxiety of being micromanaged and monitored every work second?
Over the years, developers have been more of investment centers than cost centers for businesses. The value proposition engineers bring to the growth of a company is unparalleled – they lay the groundwork for shipping products, building MVP to a fully functional sellable product, user acquisition, product adoption, and finally, customer retention while keeping companies ahead of the curve with constant innovation, and providing the skill to adapt to the changing market dynamics. It is practically difficult to imagine a great product without a great engineering team who knows what their customers want.
However, this has put the engineering leadership under constant pressure of:
- Measuring the effectiveness of their engineering teams
- Finding ways to build more productive and happy teams at work, and
- Constantly monitoring the efficacy of any such productivity programs and practices.
Despite all the benefits developers and engineering teams bring to the table, measuring, and improving their productivity has been a black box for most engineering leaders. But if you ask me, what got us here is not getting us beyond this point if we are not empirically deliberating upon Engineering Productivity.
Can you imagine - every single team in an organization - sales, marketing, even HR is backed with data but when it comes to engineering teams there is sudden loathing that, “We create, our work cannot be quantized”. But I do not believe that. Would you expect me to go tell a salesperson that there is no “art” in selling or a marketer that there is no “magic” in marketing? Then you cannot bargain the lack of data for just being a developer or engineering team!
As I always say;
“What cannot be measured cannot be improved. Setting up your engineering team for success is a double whammy because neither productivity can be measured directly nor the ways to monitor and improve engineering productivity are foolproof yet!”
In this blog, I try to highlight the nuances of measuring engineering productivity and how to work on a more agile framework that could suit your business needs irrespective of how big your engineering teams are, how they are structured, and what unique challenges they straddle with.
Measuring Developer Productivity: The Old Ways Don't Work Anymore?
Well, it all begins with gathering data. With the SaaS sprawl and a huge tech stack, gathering data can be challenging, difficult, and almost impossible at times. But there is no escaping the fact that one has to start somewhere to track, monitor, and improve the overall engineering productivity for an engineering team. The question engineering leaders need to ask themselves is, “What do we measure in the first place?” Because not measuring is surely not the solution.
We all agree every engineering team is different, and so will be their methodology for measuring productivity. The relevancy of the data points will vary wrt. individuals, team setup, or organizational structure. On top of that how we leverage these data points or key engineering metrics is another problem to solve.
“When a measure becomes a target, it ceases to be a good measure.”
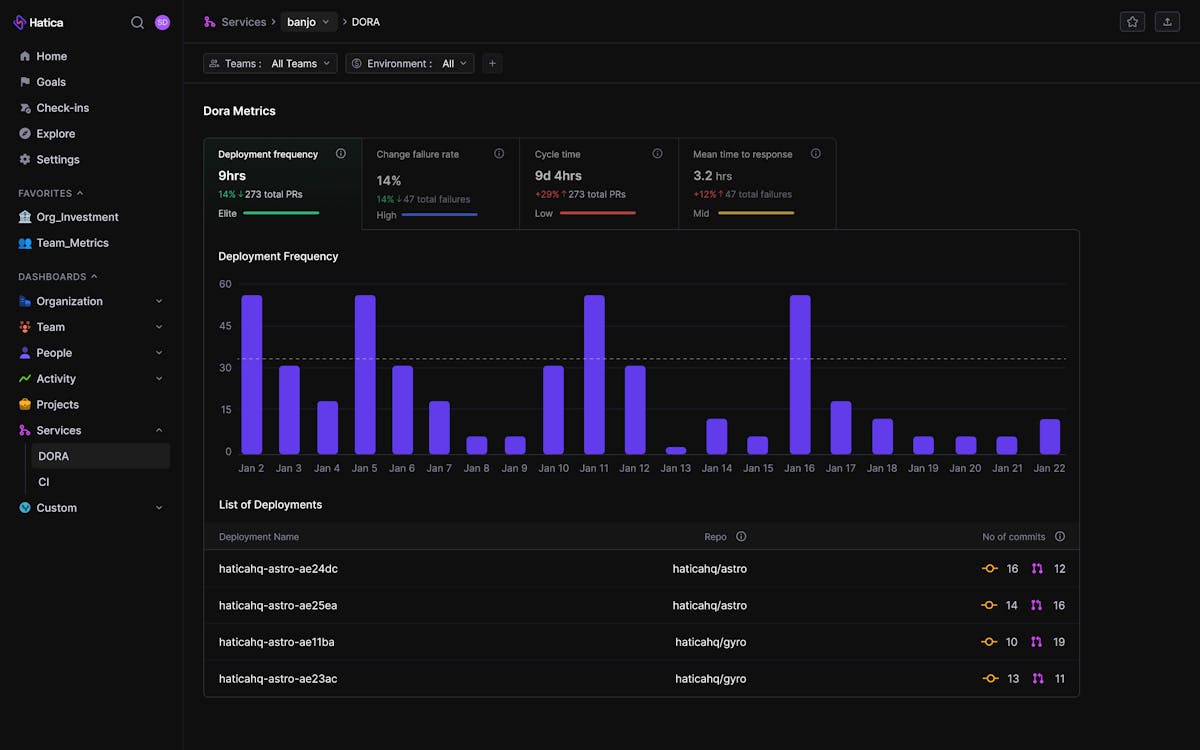
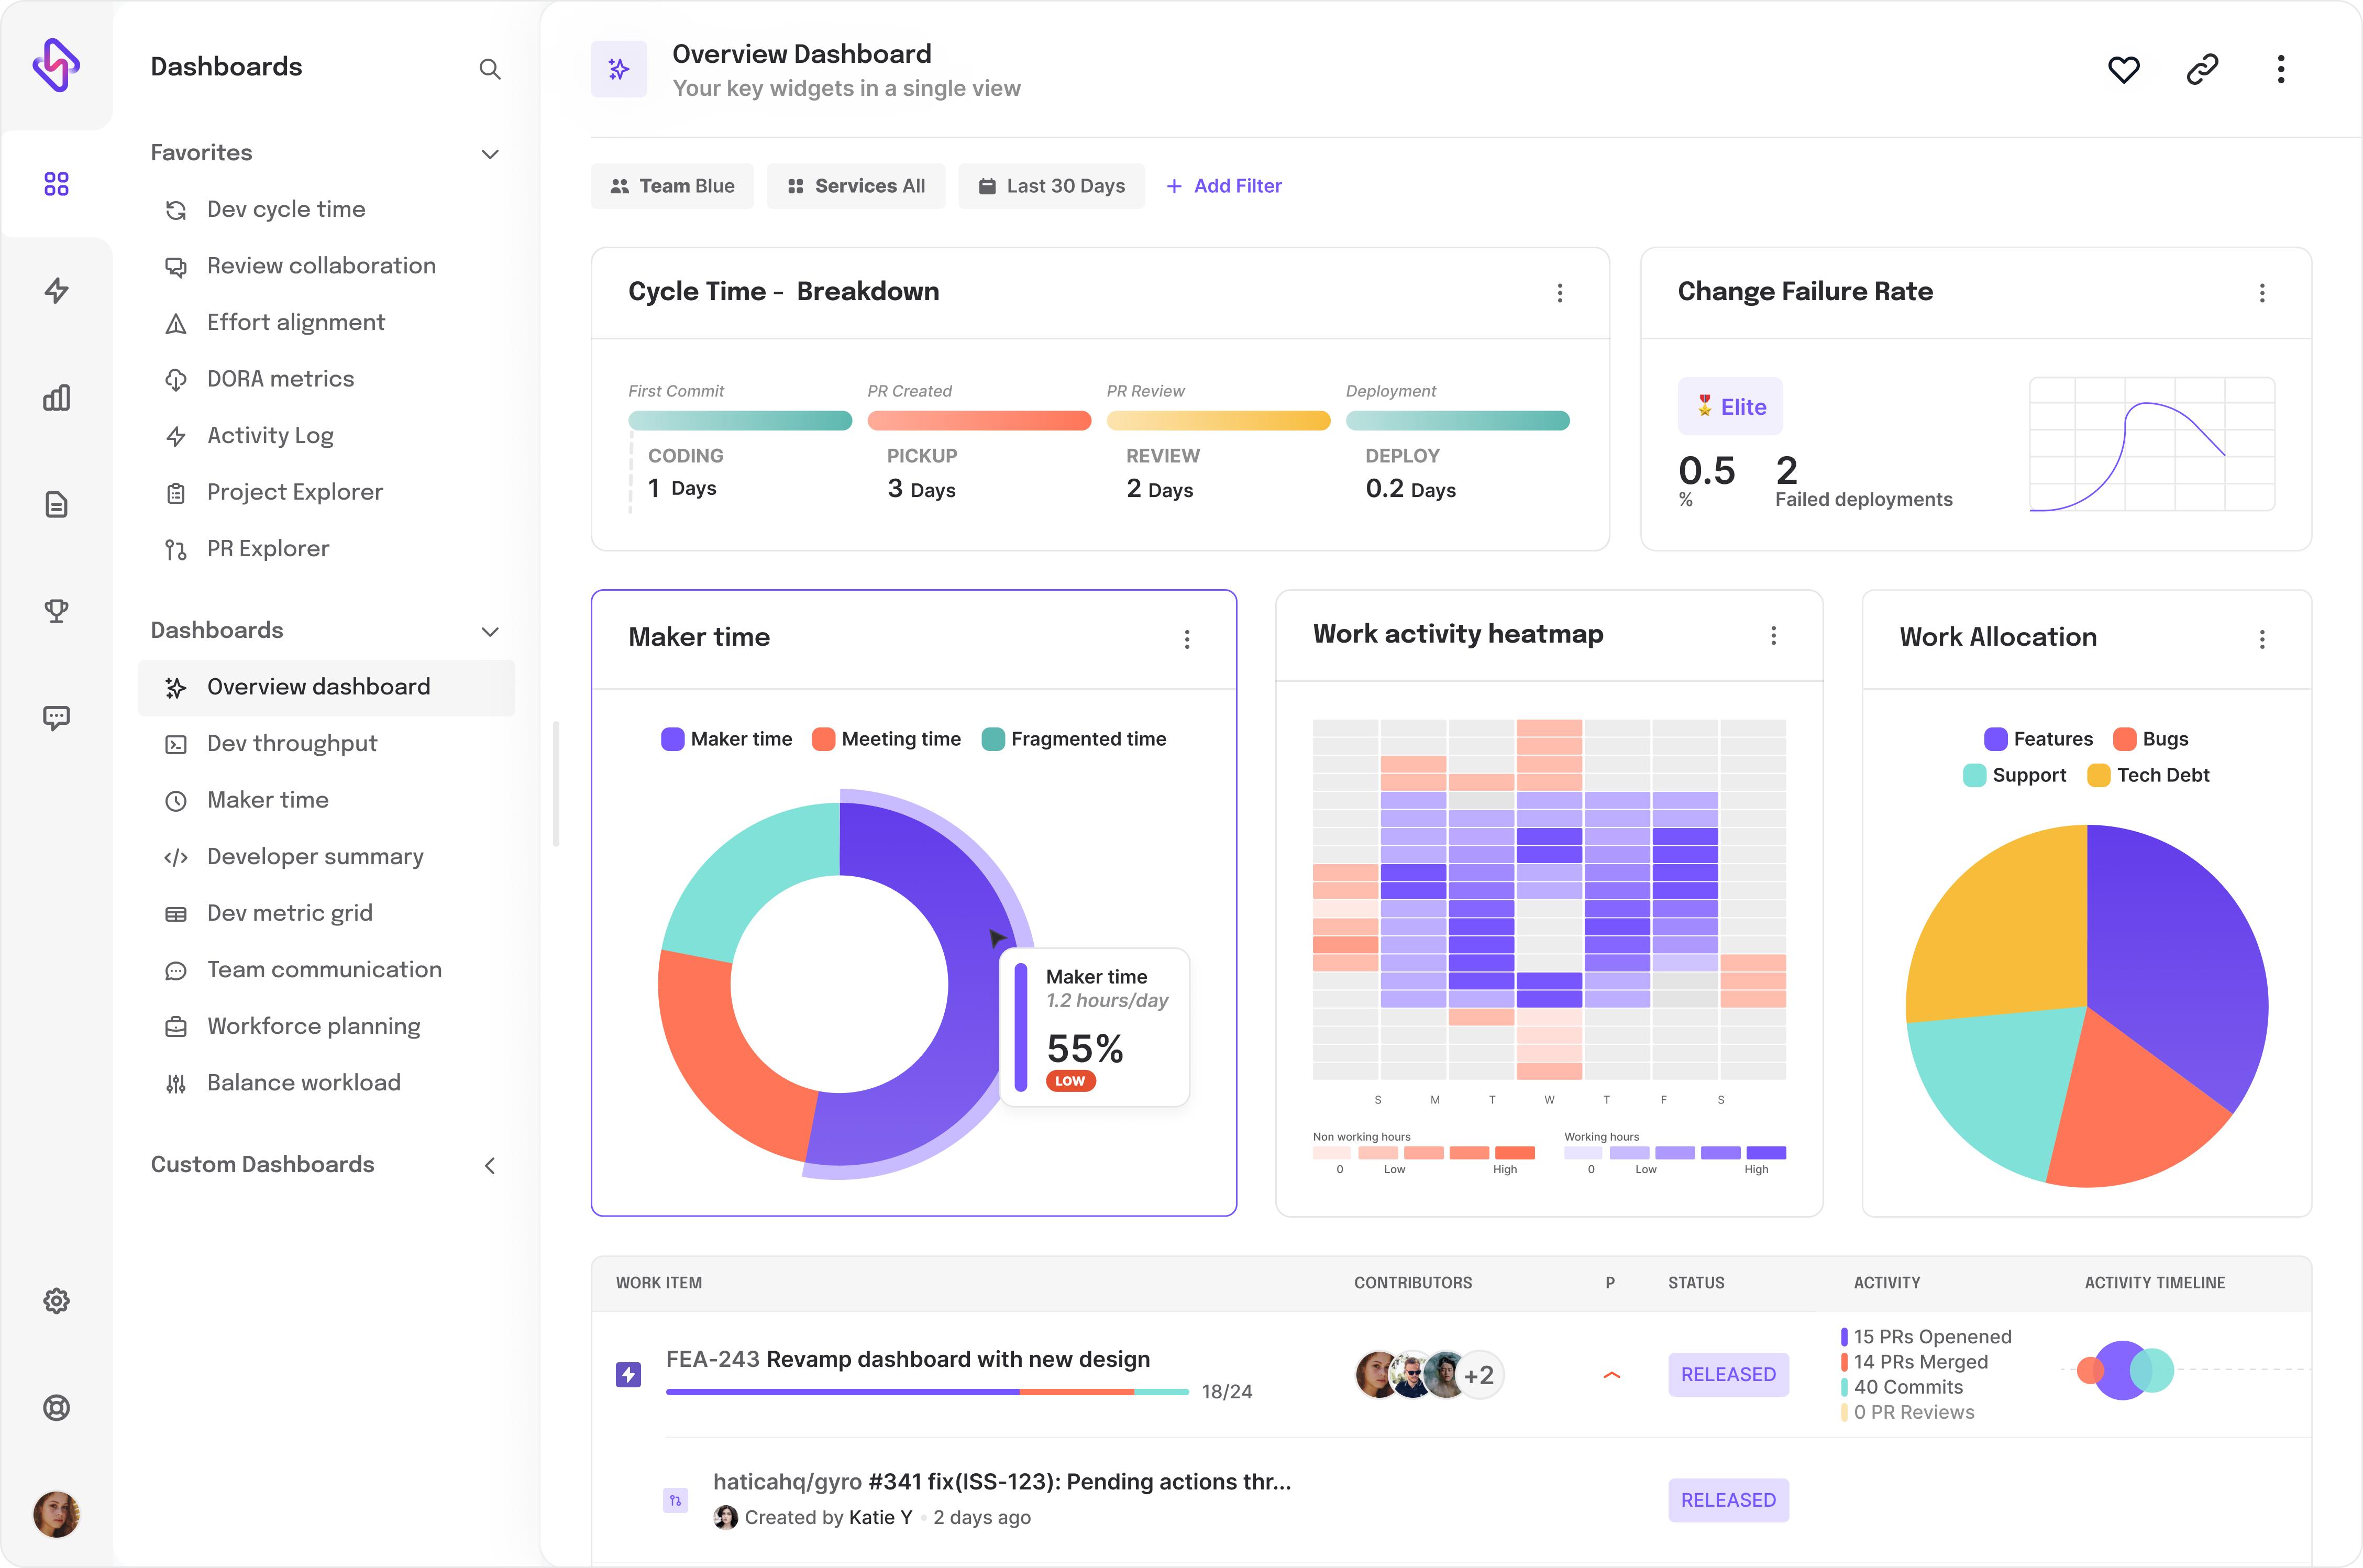
While some engineering leaders use DORA metrics to gauge the effectiveness of their engineering efforts, others still rely on more traditional indicators like LoC written, bugs fixed, story points completed, or number of features released.
The approach keeps varying depending on sprint goals, an engineering team's size, structure, and delivery commitments in a given period.
But in many cases, I have seen that the desire to monitor and measure productivity translates into immediate bossware practices which are mostly counter-intuitive and can even sabotage the overall developer experience.
The idea of tracking and monitoring activities across projects across the software development lifecycle might sound fancy yet it offers an incomplete picture and comes with a highly skewed lens.
While DORA metrics are great metrics to track, these four metrics unknowingly narrow down productivity to just measuring “software delivery” without capturing other dimensions like coding practices, commit cycles, soft metrics–team alignment and team dynamics, let alone uninterrupted time developers get to code, developer burnout, and code maintainability.
The dangers of resorting to vanity metrics are already well-known. These indicators narrow down productivity as just a measure of developer activity (rather than a wholesome preview into engineering productivity)– as in how fast the features have been delivered, or how much positive work has been performed. Though these metrics serve as a litmus test paper for development work, they limit developers to just a technical resource. More importantly, they limit the ability of engineering leaders to get a 360-degree view into how their engineering teams operate and function and how this activity is going to translate into results in a long time.
For instance, the concept of using ‘the number of features released’ metric sounds progressive. There have been times when I have felt this urge to look at these vanity metrics for a given sprint but I have realized this is a shallow gratification I can greet myself with as a leader. I have dealt with very similar kinds of concerns and challenges in my previous roles as well before I took it upon myself to resolve this for engineering teams globally.
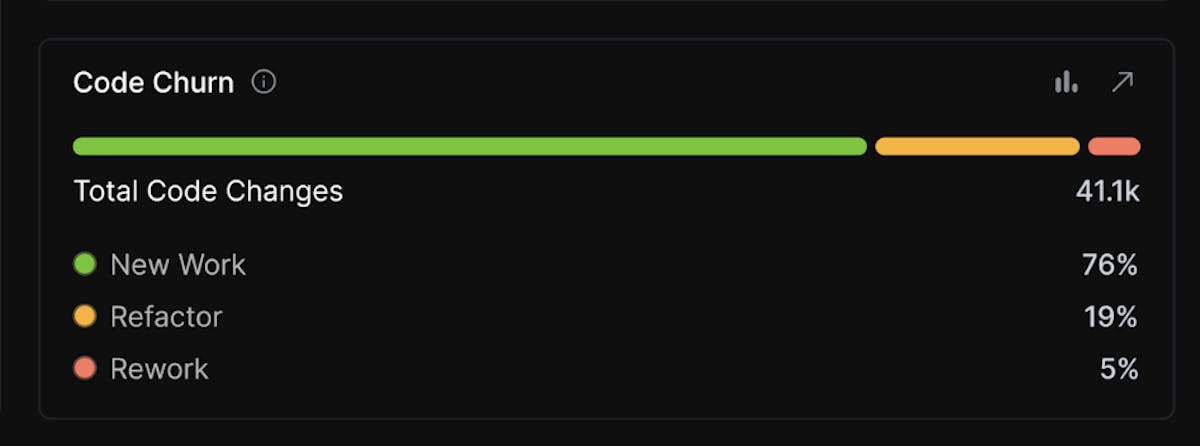
A developer might have released several features, but if they're all of low quality, then it’s just a dent to overall UX and dev effort only resulting in more rework. On the other hand, a single, high-quality feature might shoot up a team’s customer experience exponentially.
This traditional approach vehemently turns a blind eye to the modern way of work where developers work more collaboratively by jamming with engineering managers, and product owners to plan, and scope iterations, deploy code with DevOps teams, run regular sanity checks with QA, and help SREs to ensure KTLO. The engineering teams today are more inclusive than before.
“Modern engineering teams thrive with inclusive frameworks to push higher engineering productivity. It's not just fair, it's faster.”
This increasingly interconnectedness is often missed in the traditional framework alone.
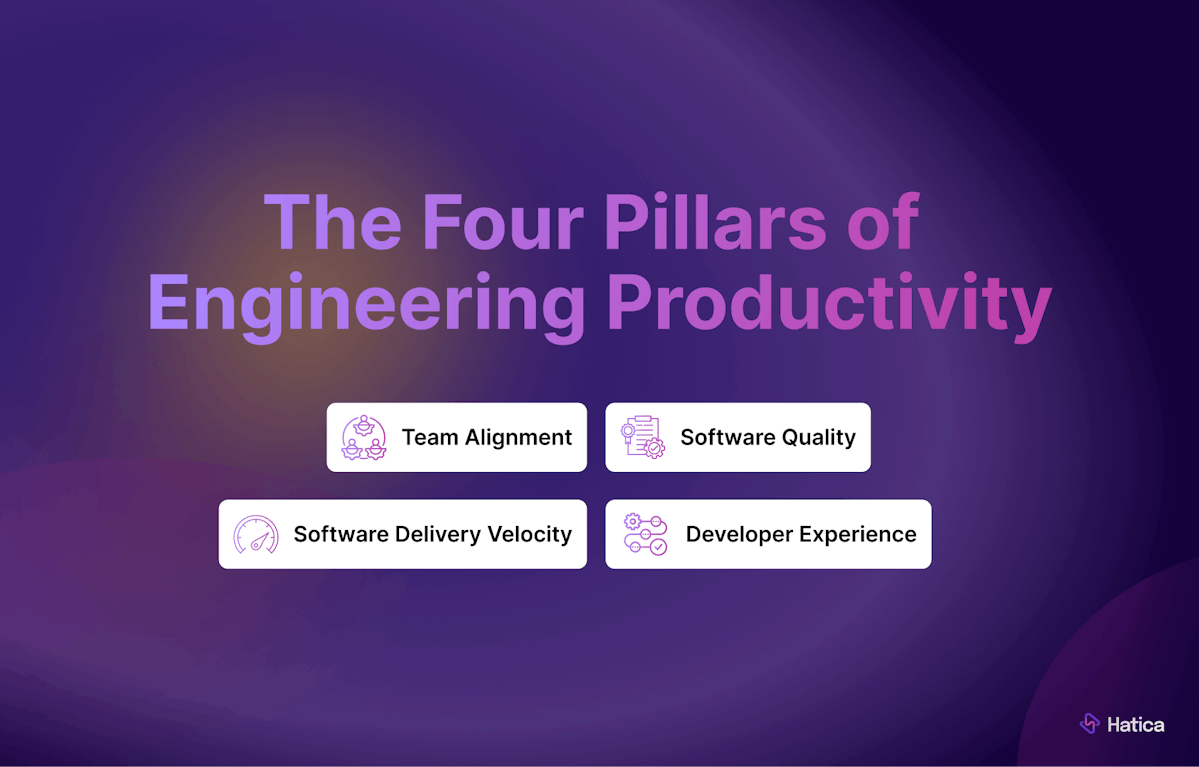
The Four Pillars of Engineering Productivity
While our fascination with developer productivity has been more or less constant for the past years, our understanding does keep evolving.
The advent of the SPACE framework shifted conversations around how engineering leaders measure, and think about engineering productivity. It was the first hardcore research that helped fetch attention from measuring just “activity-based, easily measurable signals” towards the most overlooked aspects of how engineering things work, and deliver, including developer well-being, communication, and ability to get things done without delays or interruptions.