Resource Allocation Dashboard
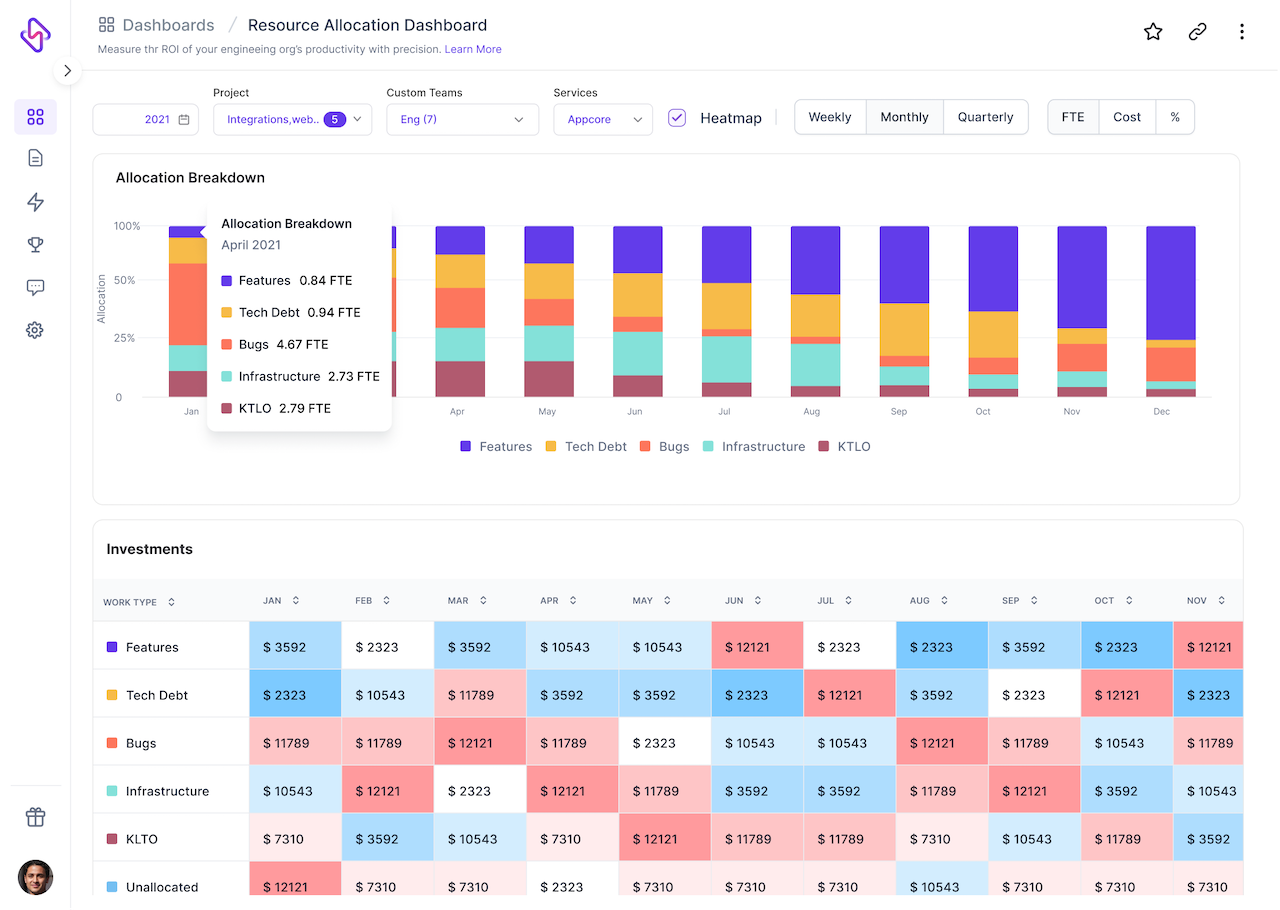
This dashboard gives you a month by month breakdown of the allocation of resources in various efforts in the organization.
By virtue of the month by month representation, you can see the trends of how and where resources are being allocated to.
Video walkthrough
Usage
This dashboard gives you a month by month breakdown of the allocation of resources in various efforts in the organisation.
By virtue of the month by month representation, you can see the trends of how and where resources are being allocated to.
Leaders use this dashboard to:
-
Align engineering teams and leads with business goals
-
See how or whether business goals and strategy translates into actual engineering work
-
And promote a culture where data-driven discussions around business goals and resource allocation are held in an effort to drive everyone in the same direction
Inputs to Resource Allocation Dashboard
The Resource Allocation Dashboard is powered by: Project Management tools.
Check out all apps supported by Hatica here: https://www.hatica.io/connectors/ (opens in a new tab)
Filters available for the Resource Allocation Dashboard
Date Range picker
Projects
Teams
Projects
Services
Heatmap
Cost/ FTE filter