[

🎉

G2 Spring 2024 Report] Hatica does it again! Wins Momentum Leader, Best Est. ROI and Users Love Us badge among many!Read More ->

Unlock Developer Productivity with Space Framework Metrics

SPACE framework metrics: Know what SPACE framework metrics is, its benefits and how to use it for measuring and maximizing developer productivity.
Space metrics for Developer Productivity

As more companies shift to remote work environments, businesses need to measure and improve developer productivity.

What counts as a productive day for a software developer? What about engineering managers and leaders - how do they define and measure their developers’ productivity?

Developer productivity encompasses an interconnected and nuanced web of metrics, processes, and attitudes. This complex phenomenon has important and wide-reaching implications for entire organizations and therefore business leaders, dev managers, and ICs consider it crucial to measure and manage dev team productivity. Metrics and frameworks are becoming important. One such framework to studying and understanding dev productivity comes from Forsgren et. al’s research: The SPACE of developer productivity.

In this article, we’ll introduce you to the SPACE framework and how to use it to measure and maximize the engineering teams productivity..

Let’s dive in!

What is the SPACE framework?

Developed by researchers at GitHub, University of Victoria, and Microsoft, SPACE provides a practical and multidimensional viewpoint into developer productivity that proposes a new approach to defining, measuring and predicting it.

The SPACE framework presents five categories to measuring productivity:

S – Satisfaction & Well Being

P – Performance

A – Activity

C – Collaboration & Communication

E – Efficiency & Flow

SPACE Productivity Framework Categories

Analyzing engineering team productivity should have a basis in the SPACE framework, pulling together several engineering management metrics under the umbrella of SPACE categories. We delve into each dimension here, presenting potential metrics per category, how they can be measured, and more importantly. We discuss in detail about how these metrics impact the dynamics of dev teams.

1. Satisfaction and Well Being

Satisfaction aims to present developers’ fulfillment and engagement with their tasks, the tool stack, and their workflows. Well-being presents an index of developers’ health and represents the impact that work and health have on each other. As a whole, this dimension captures how teams work together to create value. It is also a dimension that is becoming increasingly important in today’s world of work where burnout and overwork are increasing and threatening developers’ health and productivity. Here are some metrics we use to measure this dimension.

Satisfaction and well-being are best measured using qualitative feedback, surveys or polls, and discussions with employees. Leaders are also able to measure degree of satisfaction using polls such as

A. Employee Satisfaction

We measure satisfaction with the aim of answering the premise: Will your developers recommend your team to others? We seek to understand whether team members are happy, content, and engaged with their tasks and their work environment. 

For dev teams, we also aim to understand whether engineers are happy with the code review process: are developers satisfied with the code reviews assigned to them?

Measuring Employee Satisfaction

We measure this metric using feedback loops and surveys, creating an environment where open conversations and team members’ inputs can foster better team culture. We also use Hatica’s stand-up feature to regularly check-in with the team to get a pulse of team members’ overall well-being.

Satisfaction is critical in ensuring that teams have low employee turnover and in creating a team culture that promotes productivity and sustainable performance.

B. Employee Efficacy

An engaged and efficient team directly contributes to great team culture. We measure efficiency to ensure that developers are equipped with the right tools and processes to succeed at their tasks.

Surveys and micro check-ins are trusted methods of assessing efficacy. We also use metrics to map out dev workflows to identify patterns in bottlenecks so that we have indicators of potential blockers that we can pre-empt.

Employee efficacy affects employees’ level of effort and persistence when learning difficult tasks. For dev teams, where every task can potentially be an opportunity to create new thought-streams, efficiency becomes a critical metric to ensure consistent performance and delivery. 

C. Burnout

Burnout is chronic workplace stress that has not been successfully managed. We measure whether developers have enough work-life balance to combat workplace stress and exhaustion. Developer burnout usually manifests as loss in productivity, missed deadlines, and lack of motivation. Hence, we use a combined approach utilizing both qualitative and quantitative methods to assess and manage dev team burnout. 

Low maker time

Descriptive data gathered from surveys and check-ins provide an opportunity for dev managers to converse with their teams regarding any well-being concerns. Using 1:1 meetings to discuss and address burnout concerns can go a long way in keeping developers’ health in its prime.

Quantitative data about dev teams’ workload allocation and management, the availability of focus time and quiet days, and insights into communication health, particularly after work-hours communication can help dev managers to structure healthfully balanced workdays for their teams.

Burnout is crucial to avoiding loss of productivity and to preventing disengagement that can result in slower deliveries or lower quality code. It is also important to note that burnout causes a cascade of negative outcomes which becomes a cycle that inevitably leads to dissatisfaction and dip in well-being.

2. Performance

Performance metrics capture the matrix of processes and related outcomes, providing an understanding of the results and outcome of a team’s workflows and helping managers gauge the efficiency of a team.

A. Code Review Velocity

The speed at which reviews are completed can indicate the performance of the entire team. It highlights the collaborative nature of the dev lifecycle and can be an indicator of both individual and team performance. Code reviews are critical since they ensure that the code actually solves the problem that was raised in the feature requirements. Reviews also ensure that the new code meets the quality standards of the team and is able to pass test cases with acceptance criteria. We measure involvement, reaction times, risks, and rework percentage, among other metrics to maintain the quality of the code review process to avoid bugs creeping into production that can lead to delayed releases.

Review collaboration dashboard from Hatica

B. Customer Satisfaction

Customer satisfaction measures how happy customers are with the products or features, services, and capabilities that are shipped by the company. This metric indicates the performance of the end-to-end processes of the engineering team and throws light on the impact that a team’s work has on the company bottom line. The impact of great or poor customer satisfaction has a commercial impact that extends beyond the board room to impact the daily tasks of a team.

The best means to measure customer satisfaction is using a combined approach including qualitative surveys, feedback, and customer conversations that can compliment quantitative product usage and adoption metrics.

C. CI/CD Metrics

We measure the time spent in building and testing for cases wherein developers have to wait to push and deploy code. We monitor this metric under the umbrella of performance metrics to help gauge bottlenecks that might exist in dev team processes. For example, we measure the time spent waiting for builds - the longer the wait time is, the more frustrating it can get for developers to wait for builds to finish. The wait time can range from a few minutes to several hours and can result in a failure because of a flaky build. Such an experience hampers productivity since the wait wastes the time of engineers along with degrading the developer’s experience.

D. Reliability

This is a measure of the product or feature’s ability to perform the function it was built to perform during the entire duration of stipulated time. We measure the frequency and the impact of failure of code, features, or products to postulate and deliver consistent and successful performance.

We rely on the tired and tested DORA metrics to measure release quality. We focus on measuring how long a team takes to fix an issue if things break in production. We measure this since the time taken to fix failures impact and can increase customer churn in feature releases. The longer a team takes to correct broken features, the more hindrances in customers adopting a version or feature.

We benchmark a point of no-break streak in production to achieve the DORA stipulated labels of excellent, high performing teams that consistently deliver extremely reliable products.

DORA dashboard from Hatica

3. Activity

Activity metrics are the most commonly used engineering performance metrics simply because they are popular, easily available, and can be quickly quantifiable. However, these are the metrics that teams should approach with caution since a team should not correlate developer activity as a measure of developer productivity. Nevertheless, activity metrics serve as a useful tool to gain visibility into developer efforts and contributions and can be cautiously used alongside the constellation of other software engineering metrics.

A. Count of Actions

We measure or number a team’s actions such as the volume of work items, the number of pull requests or commits or code reviews, or the lines of code written by an IC or a team as a measure of dev team activity.

We primarily measure count of actions for three purposes:

  • To better workload allocation
  • Identify blockers
  • To identify bottlenecks in stages of a complex cycle of development

When we measure the number of tasks completed or the number of lines coded, we’re able to assess and forecast speed for similar tasks that can help managers allocate workload mindfully. Similarly, when managers can measure the pull request activity, it helps to pre-empt bottlenecks, particularly by identifying patterns for blockers.

B. Story Points Shipped

Story points inherently measure and reward task completion rather than focusing on time spent on a particular task. We measure how many story points are delivered per sprint and across what type of tasks, for example, how many story points are shipped for bug fixes versus new feature builds.

This can help managers understand patterns that can be used as insights while setting priorities or drawing product roadmaps.

Effort alignment dashboard from Hatica

C. Volume of Operational Activity

Measured as volume of incidents and their corresponding mitigation, on-call participation, etc., a count of operational activity can highlight whether engineers are occupied in fixing errors and failures rather than building new features and versions. In addition to these metrics, we also use DORA metrics such as Change failure rate to gauge how frequently teams have to push hotfixes or rollback deployments. These failures severely hamper productivity and delivery velocity and upends roadmaps and sprints.

4. Communication

Communication and collaboration metrics highlight how team members are able to work together. We seek to understand inter and intra team communication health that can indicate the success of a collaborative software development approach. Capturing collaboration metrics enables team managers to design workflows that can balance async work and sync collaboration, and also help in devising strategies that can facilitate team cohesion and better team culture.

A. Meeting Metrics

Measuring and managing meeting metrics can enhance the quality of the work environment for any team. We measure meeting quality, meeting frequency, the number of people involved in meetings, and the effectiveness of meetings to prune meetings to only allow the most necessary meetings with complete agendas and relevant stakeholders. This allows individual developers to experience less stress and more focused time, thereby increasing their productivity.

B. Documentation Metrics

Documentation is an unsung hero in software development. Engineers document extensively while writing code. They also create large knowledge bases for the tools and workflows they use. Since documentation and knowledge sharing is a large component of the development lifecycle, it is important that the documentation process is easy and efficient. We approach this metric with the aim of answering the question: Can the right people find the right documents in a timely and organized manner?

We also measure knowledge sharing to identify the extent to which people contribute to knowledge sharing. We do this by reviewing code review involvement and by using surveys to measure documentation quality.

The biggest impact of seamless and efficient documentation is the avoidance of a scenario where developers need to interrupt other developers because they were unable to find the documentation necessary to perform their tasks.

Such knowledge silos can cause context switching and loss in focused maker time, where the implications are more impactful for distributed teams across time zones, whereas a developer might need to wake up engineers in a different country if there is no proper documentation.

C. Thoughtfulness of Collaboration

Measured as code review score and PR merge times, the thoughtfulness of collaboration metric indicates the quality and timeliness of the code review.

Better and faster code reviews that are balanced across team members boost engineers’ confidence across the codebase. When better quality code goes into production, teams can optimize their cycle time. Good quality code inevitably results in happy customers by avoiding bugs or failures. This overall winning situation ultimately boosts team performance that leads to timely product delivery.

5. Efficiency and Flow

The efficiency and flow metrics help in putting all stakeholders of a project on the same page to track the progress of tasks in a team. By tracking delivery timelines, managers and leaders can gauge the successful completion of tasks. By measuring the time or speed of a system, the number of handoffs, interruptions, and a developer’s ability to stay in a state of flow, helps managers spot and remove inefficiencies in the software delivery process.

A. Code Review Quality and Timing

Efficiency and cohesion in a team and system performance can be measured using code review quality and timing. The quality of a code review can be assessed using the number of comments on the review and the number of comments that have been resolved or have been replied to (engagement with the comments).

Tracking this amount of back and forth through comments along with tracking the timeliness of reviews and responses indicates the effectiveness of collaboration and the involvement of the reviewers and coders in a particular code.

This is a leading indicator of highly cohesive dev teams which are important to building better team morale and a better environment for learning and development. Such a culture loops back into creating an environment that fosters developer satisfaction and happiness.

B. Maker’s Time

The maker’s time metric is designed to indicate the availability of uninterrupted slots of focus time that can be spent working on cognitively demanding tasks. Most often, the maker's time to do creative and deep work is interspersed with managerial or admin duties, with meetings or synchronous interruptions often causing a high number of context switches. This directly impacts the flow of an engineer and the ensuing productivity. By measuring the volume, quantity, timing, and spacing of interruptions and their corresponding impact on developer focus, we help managers structure work days that preserve focus time slots allowing better concentration, lesser fatigue, and ultimately, better results.

Space Framework Benefits

The SPACE framework is a strategic planning tool that helps organizations examine and improve their capabilities. The framework consists of five components: strategy, processes, architecture, culture, and environment. The following are some of the advantages of adopting the SPACE framework:

The SPACE framework provides a comprehensive approach to strategic planning, taking into account not just the organization's strategy but also its procedures, architecture, culture, and environment. This ensures that all components of the organization are taken into account throughout the planning process.

  1. Alignment: The SPACE framework aids in ensuring that the organization's strategy and capabilities are in sync. The framework may assist guarantee that the organization's capabilities are aligned with its strategic objectives by reviewing the organization's present capabilities and finding opportunities for development.
  2. Focus on capabilities: Rather than only developing a strategic plan, the SPACE framework focuses on the development of organizational capabilities. This helps to guarantee that the organization has the essential competences to properly execute its plan.
  3. Flexibility: The SPACE framework is adaptable to the individual demands of an organization. This enables organizations to modify the framework to their own needs and difficulties.
  4. Integration: To give a more thorough strategic planning process, the SPACE framework may be combined with other strategic planning tools and frameworks like as SWOT analysis and Porter's Five Forces.

Overall, the SPACE framework may assist organizations in developing a more effective and complete strategic plan that is linked with their capabilities and focuses on strengthening organizational strengths.

How to use the SPACE framework?

Let us understand the step by step process that organizations can adopt on how to use SPACE framework

Step 1. Identify the scope and goal of the analysis:

It is critical to identify the scope and purpose of the analysis before commencing the analysis. This will help to ensure that the analysis is targeted and relevant to the goals of the organization.

Step 2. Determine the major components of the SPACE framework:

SPACE is made up of five components: Strategy, Processes, Architecture, Culture, and Environment. Before commencing the study, it is critical to grasp these aspects and their interdependence.

Step 3. Assess the organization's present capabilities:

The next stage is to evaluate the organization's current capabilities in each of the SPACE framework's five aspects. This may be accomplished through a variety of means, including interviews, surveys, and data analysis.

Step 4. Identify opportunities for improvement:

After assessing the organization's present capabilities, the following stage is to identify areas for improvement. This can be accomplished by comparing the organization's present capabilities to best practices in the sector or by detecting gaps between the organization's capabilities and its strategic objectives.

Step 5. Create a plan of action:

The final stage is to create a plan of action to address the areas for improvement highlighted in the previous phase. Specific activities, deadlines, and accountable parties for each project should be included in the action plan.

Guidelines for Using the SPACE Framework

The SPACE framework provides teams with an avenue to measuring, studying, and understanding developer productivity. However, it is imperative that users bear in mind that these metrics should be tailored to their team’s unique needs and circumstances.

In that light, here are some broad guidelines for managers, leaders, and developers to find success while using the SPACE framework:

  1. Metrics should always exist within a constellation of other metrics in order to help paint a picture of dev team productivity. Managers and leaders should capture  several metrics across multiple dimensions of the framework to ensure a well-rounded viewpoint into dev team activity. In addition to metrics, managers and leaders should try to complement quantitative data with perceptual metrics and qualitative data from surveys, feedback forms, 1:1 meetings, and other conversations to get a full and complete understanding of their dev team’s reality. Such a complete picture can enable leaders to make smart decisions.
  2. Leaders and managers should stay mindful of their biases - both conscious and subconscious when approaching data and insights.
  3. Respecting employee privacy should be the team’s paramount default. Ensure that all metrics are measured and optimized at the team level. Every metric, when optimized for a team, eventually trickles down to impact individuals and hence focus on productivity and performance of the team as a whole.
  4. Chasing productivity can become a futile effort if it does not provide sustainable productivity. In order to sustain the performance of a team, leaders have to prioritize developer experience and well being. It is time that organizations and teams structure employee-centric tooling, processes, and workflows to allow great employee experience to translate into great products.

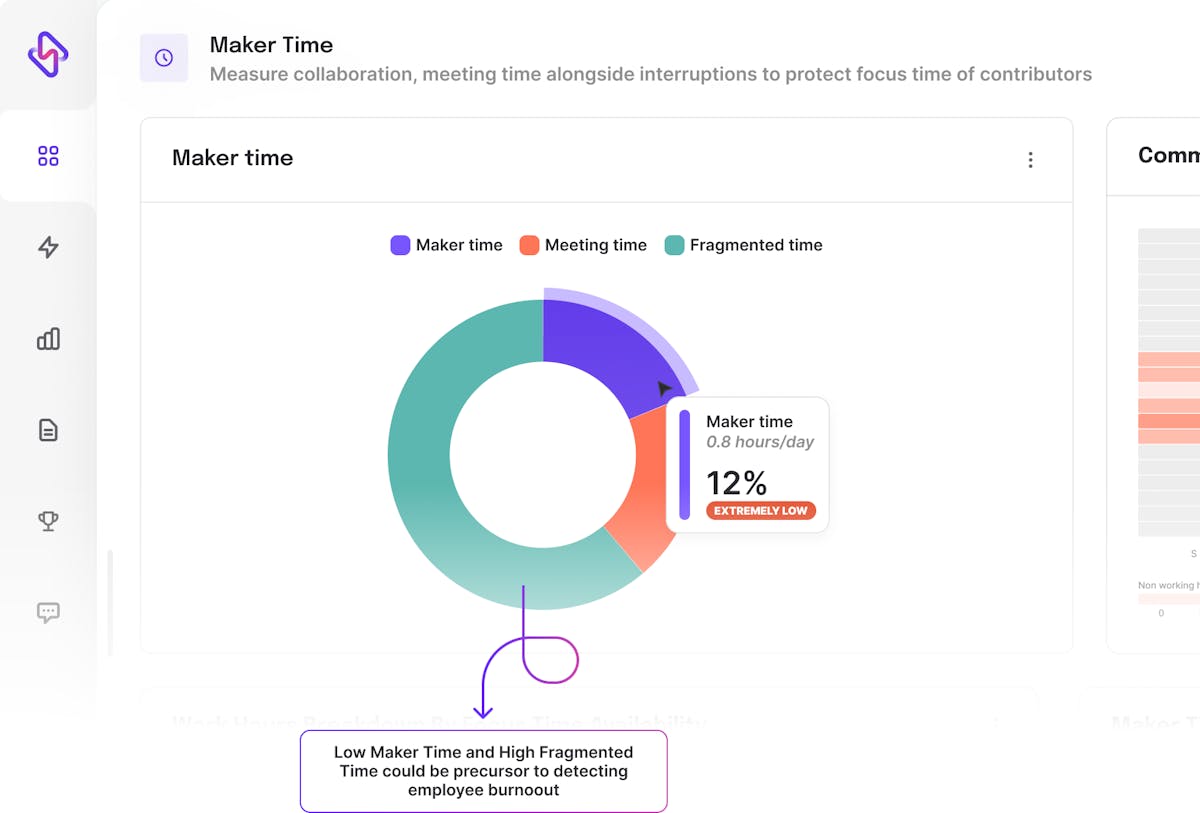
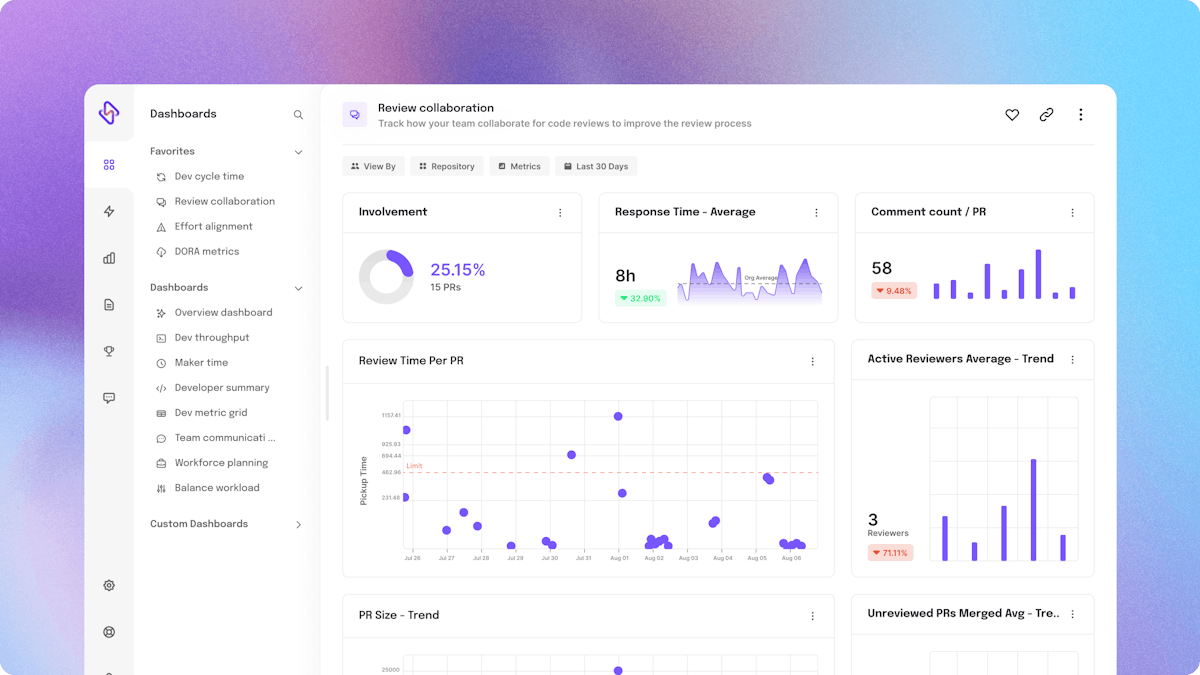
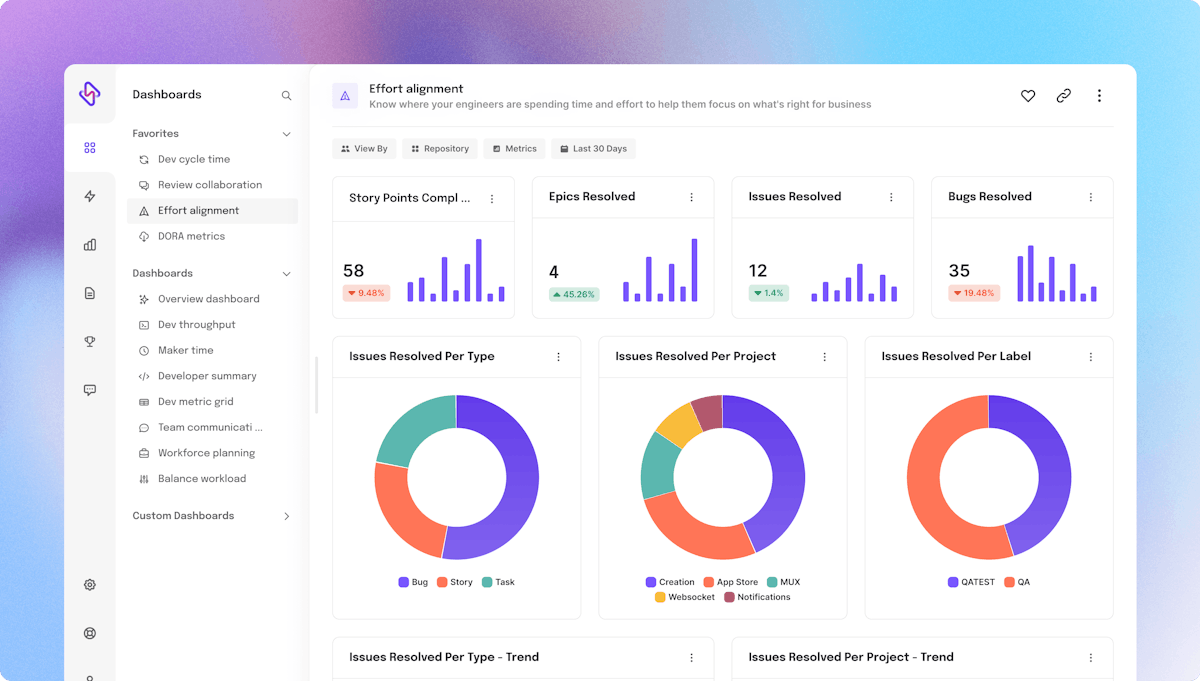
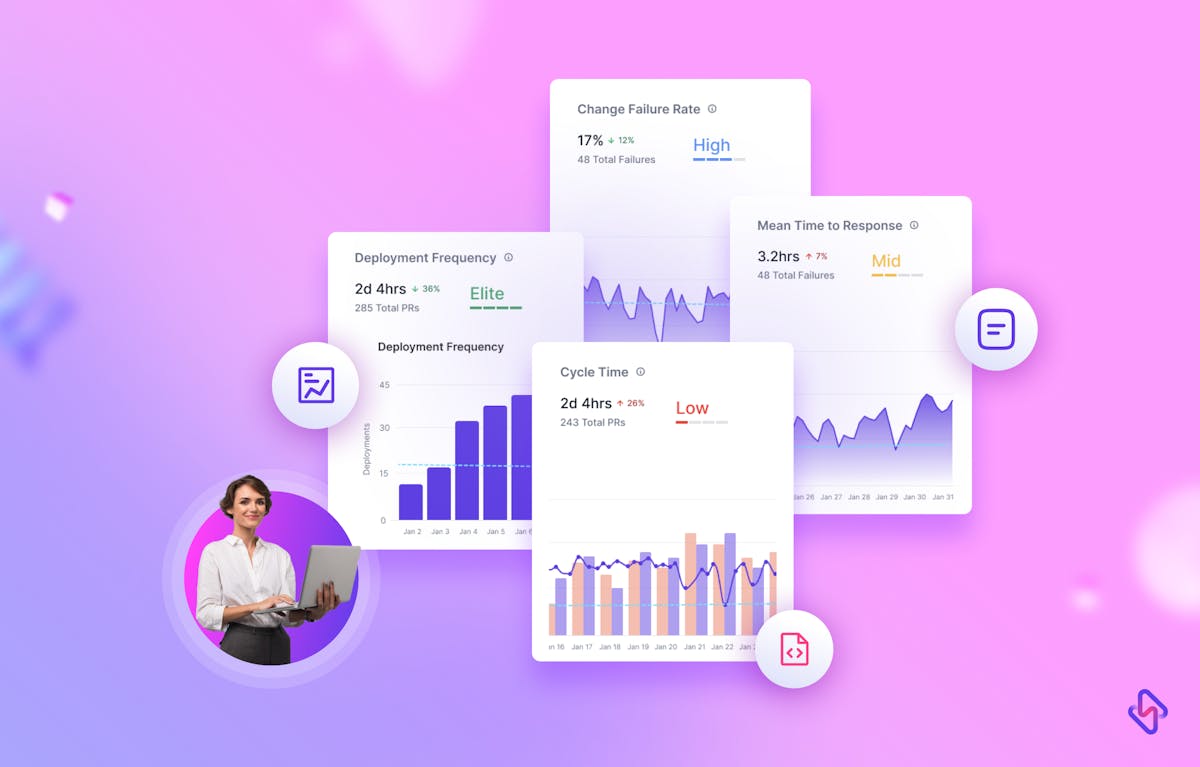
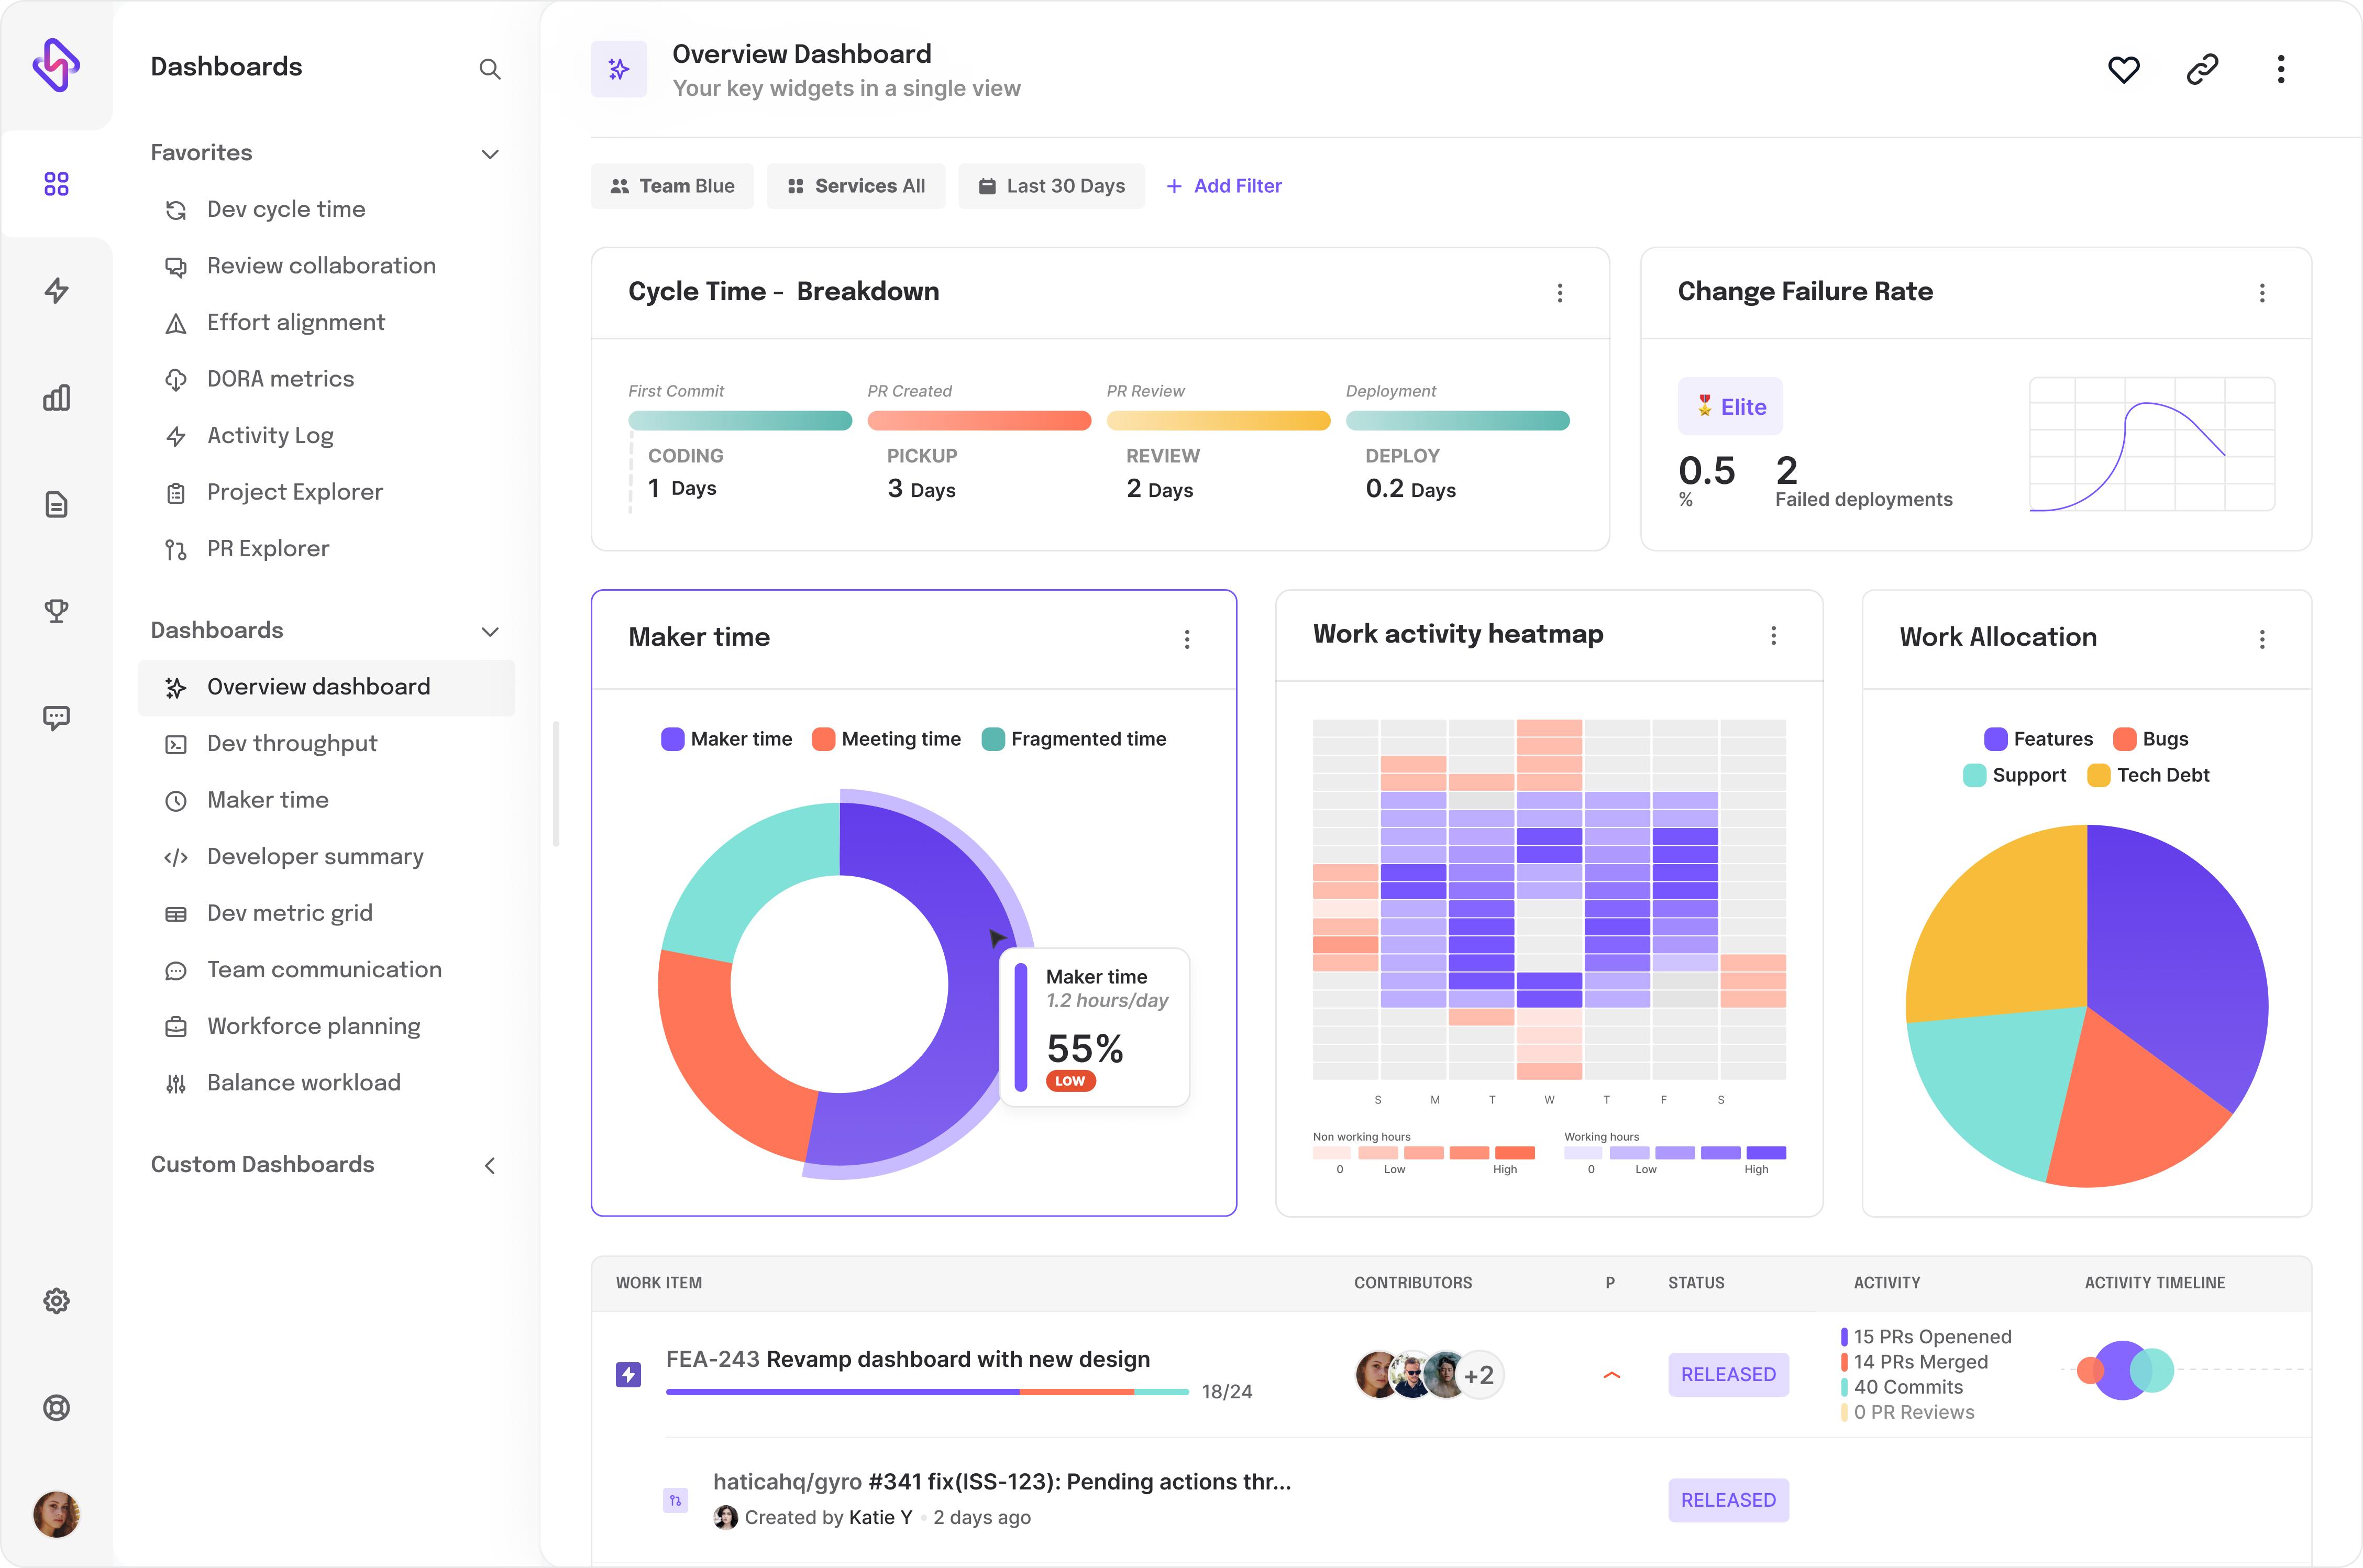
💡 Hatica is an engineering analytics platform that helps development teams build sustainable productivity and ensure optimum employee experience by tracking several SPACE metrics like cycle time, DORA metrics, focus and meeting time and more. Request a demo →

FAQs

1. How can organizations adjust their approach to measuring developer productivity to incorporate the SPACE framework?

Organizations can incorporate the SPACE framework by understanding the framework, identifying relevant metrics, assessing current measurement methods, aligning metrics with the SPACE framework, and regularly reviewing and adjusting the measurement approach as needed.

2. In what ways do SPACE metrics and DORA metrics differ in their scope of measurement?

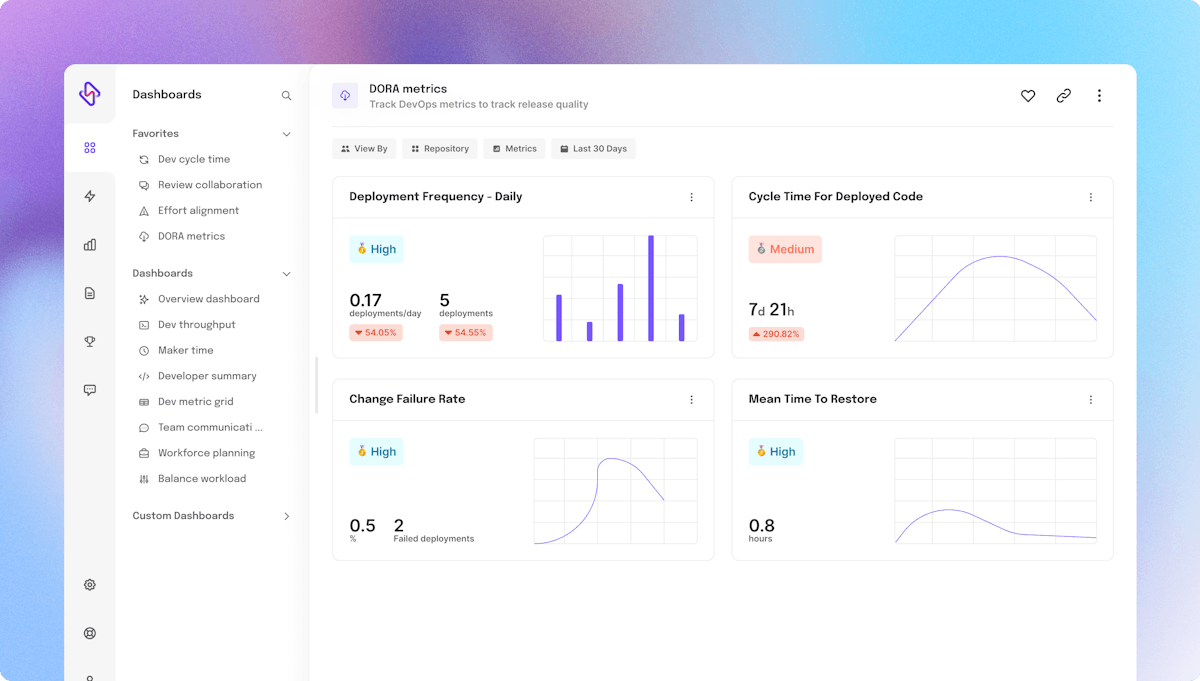
SPACE metrics and DORA metrics are two different approaches to measuring organizational capabilities. The SPACE framework assesses an organization's capabilities across five elements (Strategy, Processes, Architecture, Culture, and Environment), while DORA metrics focus specifically on DevOps capabilities such as deployment frequency, lead time for changes, and time to restore service. Both frameworks can be valuable for assessing and improving organizational capabilities, but they have different areas of focus.

3. Why do organizations use SPACE metrics to understand Developers Productivity?

SPACE metrics provides a comprehensive method to assess organizational capabilities that can be applied to numerous areas, including software development, organizations utilize SPACE measurements to evaluate developer productivity. By evaluating a company's capabilities across five dimensions (Strategy, Processes, Architecture, Culture, and Environment).

Share this article:
Table of Contents
  • What is the SPACE framework?
  • SPACE Productivity Framework Categories
  • 1. Satisfaction and Well Being
  • 2. Performance
  • 3. Activity
  • 4. Communication
  • 5. Efficiency and Flow
  • Space Framework Benefits
  • How to use the SPACE framework?
  • Step 1. Identify the scope and goal of the analysis:
  • Step 2. Determine the major components of the SPACE framework:
  • Step 3. Assess the organization's present capabilities:
  • Step 4. Identify opportunities for improvement:
  • Step 5. Create a plan of action:
  • Guidelines for Using the SPACE Framework
  • FAQs
  • 1. How can organizations adjust their approach to measuring developer productivity to incorporate the SPACE framework?
  • 2. In what ways do SPACE metrics and DORA metrics differ in their scope of measurement?
  • 3. Why do organizations use SPACE metrics to understand Developers Productivity?

Ready to dive in? Start your free trial today

Overview dashboard from Hatica