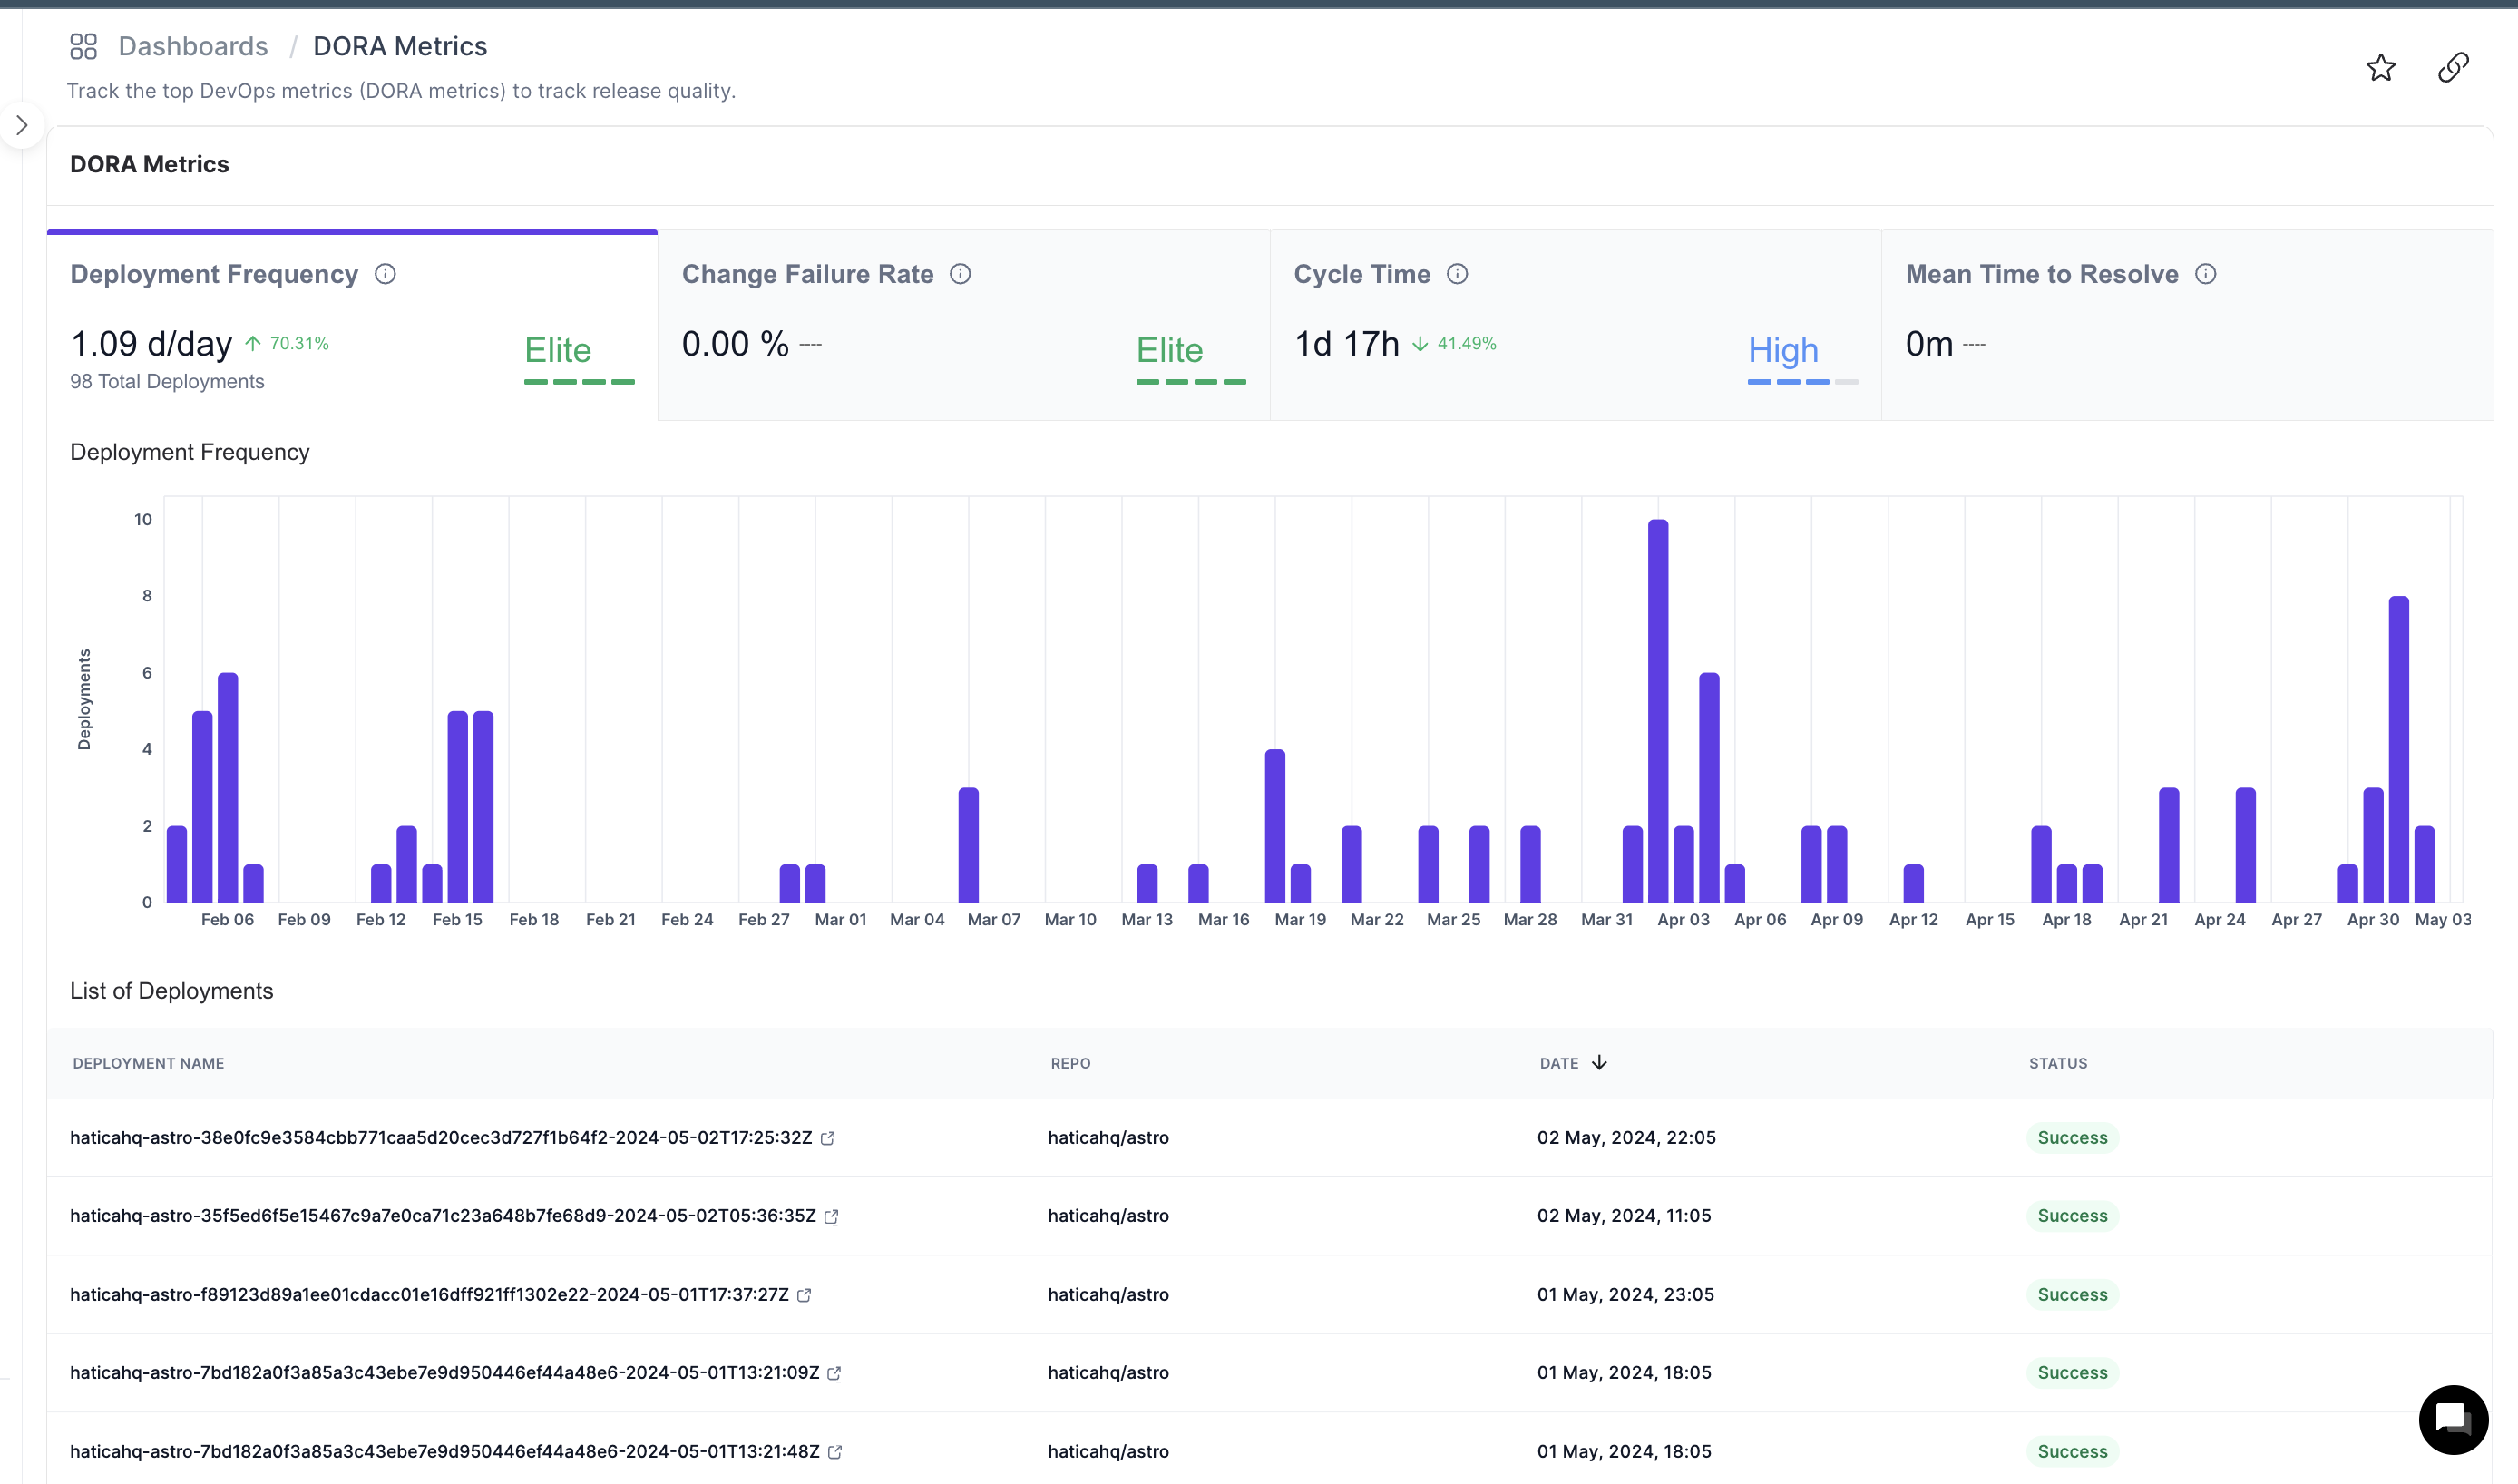
How to configure the DORA metrics dashboard?
DORA metrics dashboard showcases deployment frequency (opens in a new tab), change failure rate (opens in a new tab), cycle time (opens in a new tab) and mean time to restore (mttr) (opens in a new tab) of deployed code.
It works based on the deployments that occur in your code base and how fixes are implemented.
Hatica integrates with a number of CI/CD tools and provides configuration in-app to choose the CI/CD tool, the app id of your deployment pipeline, and the REGEX used to track failures on PR title or PR Labels.
In order to start tracking the DORA metrics, you'll need to perform the following steps:
-
Create services for your git repositories.
-
Configure deployment tracking for these services which will be used to track deployments of the services.
-
Configure change failure rate tracking for these services.
Create a Service
- Use this link (opens in a new tab) and go to the Services page
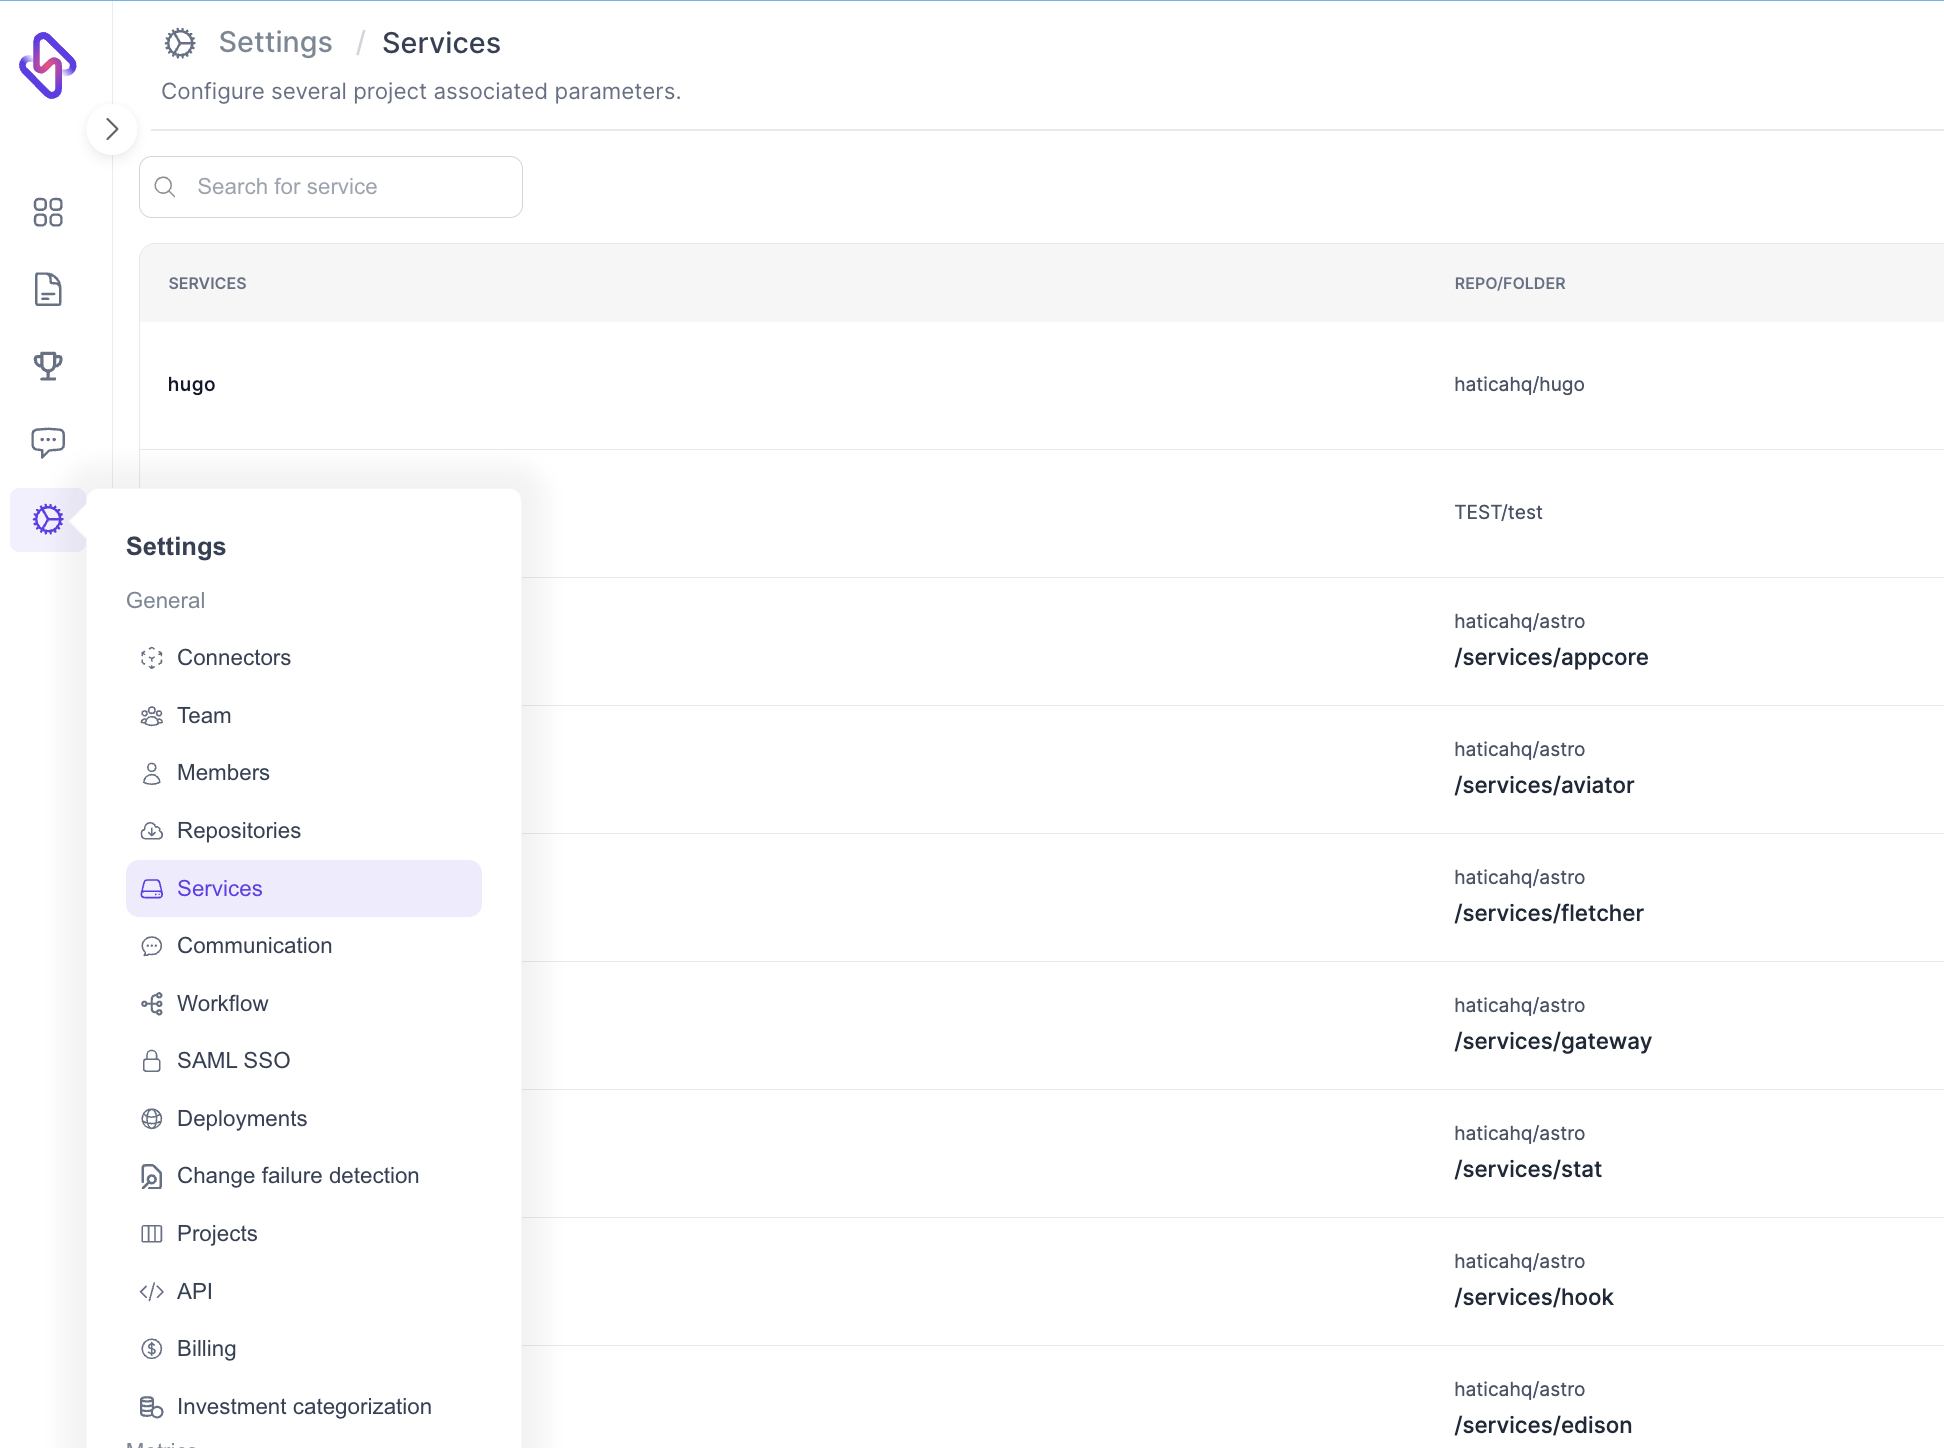
- Clicking on the
Add Servicebutton will open a modal where you can select the repository mention the service name and the paths corresponding to that service.
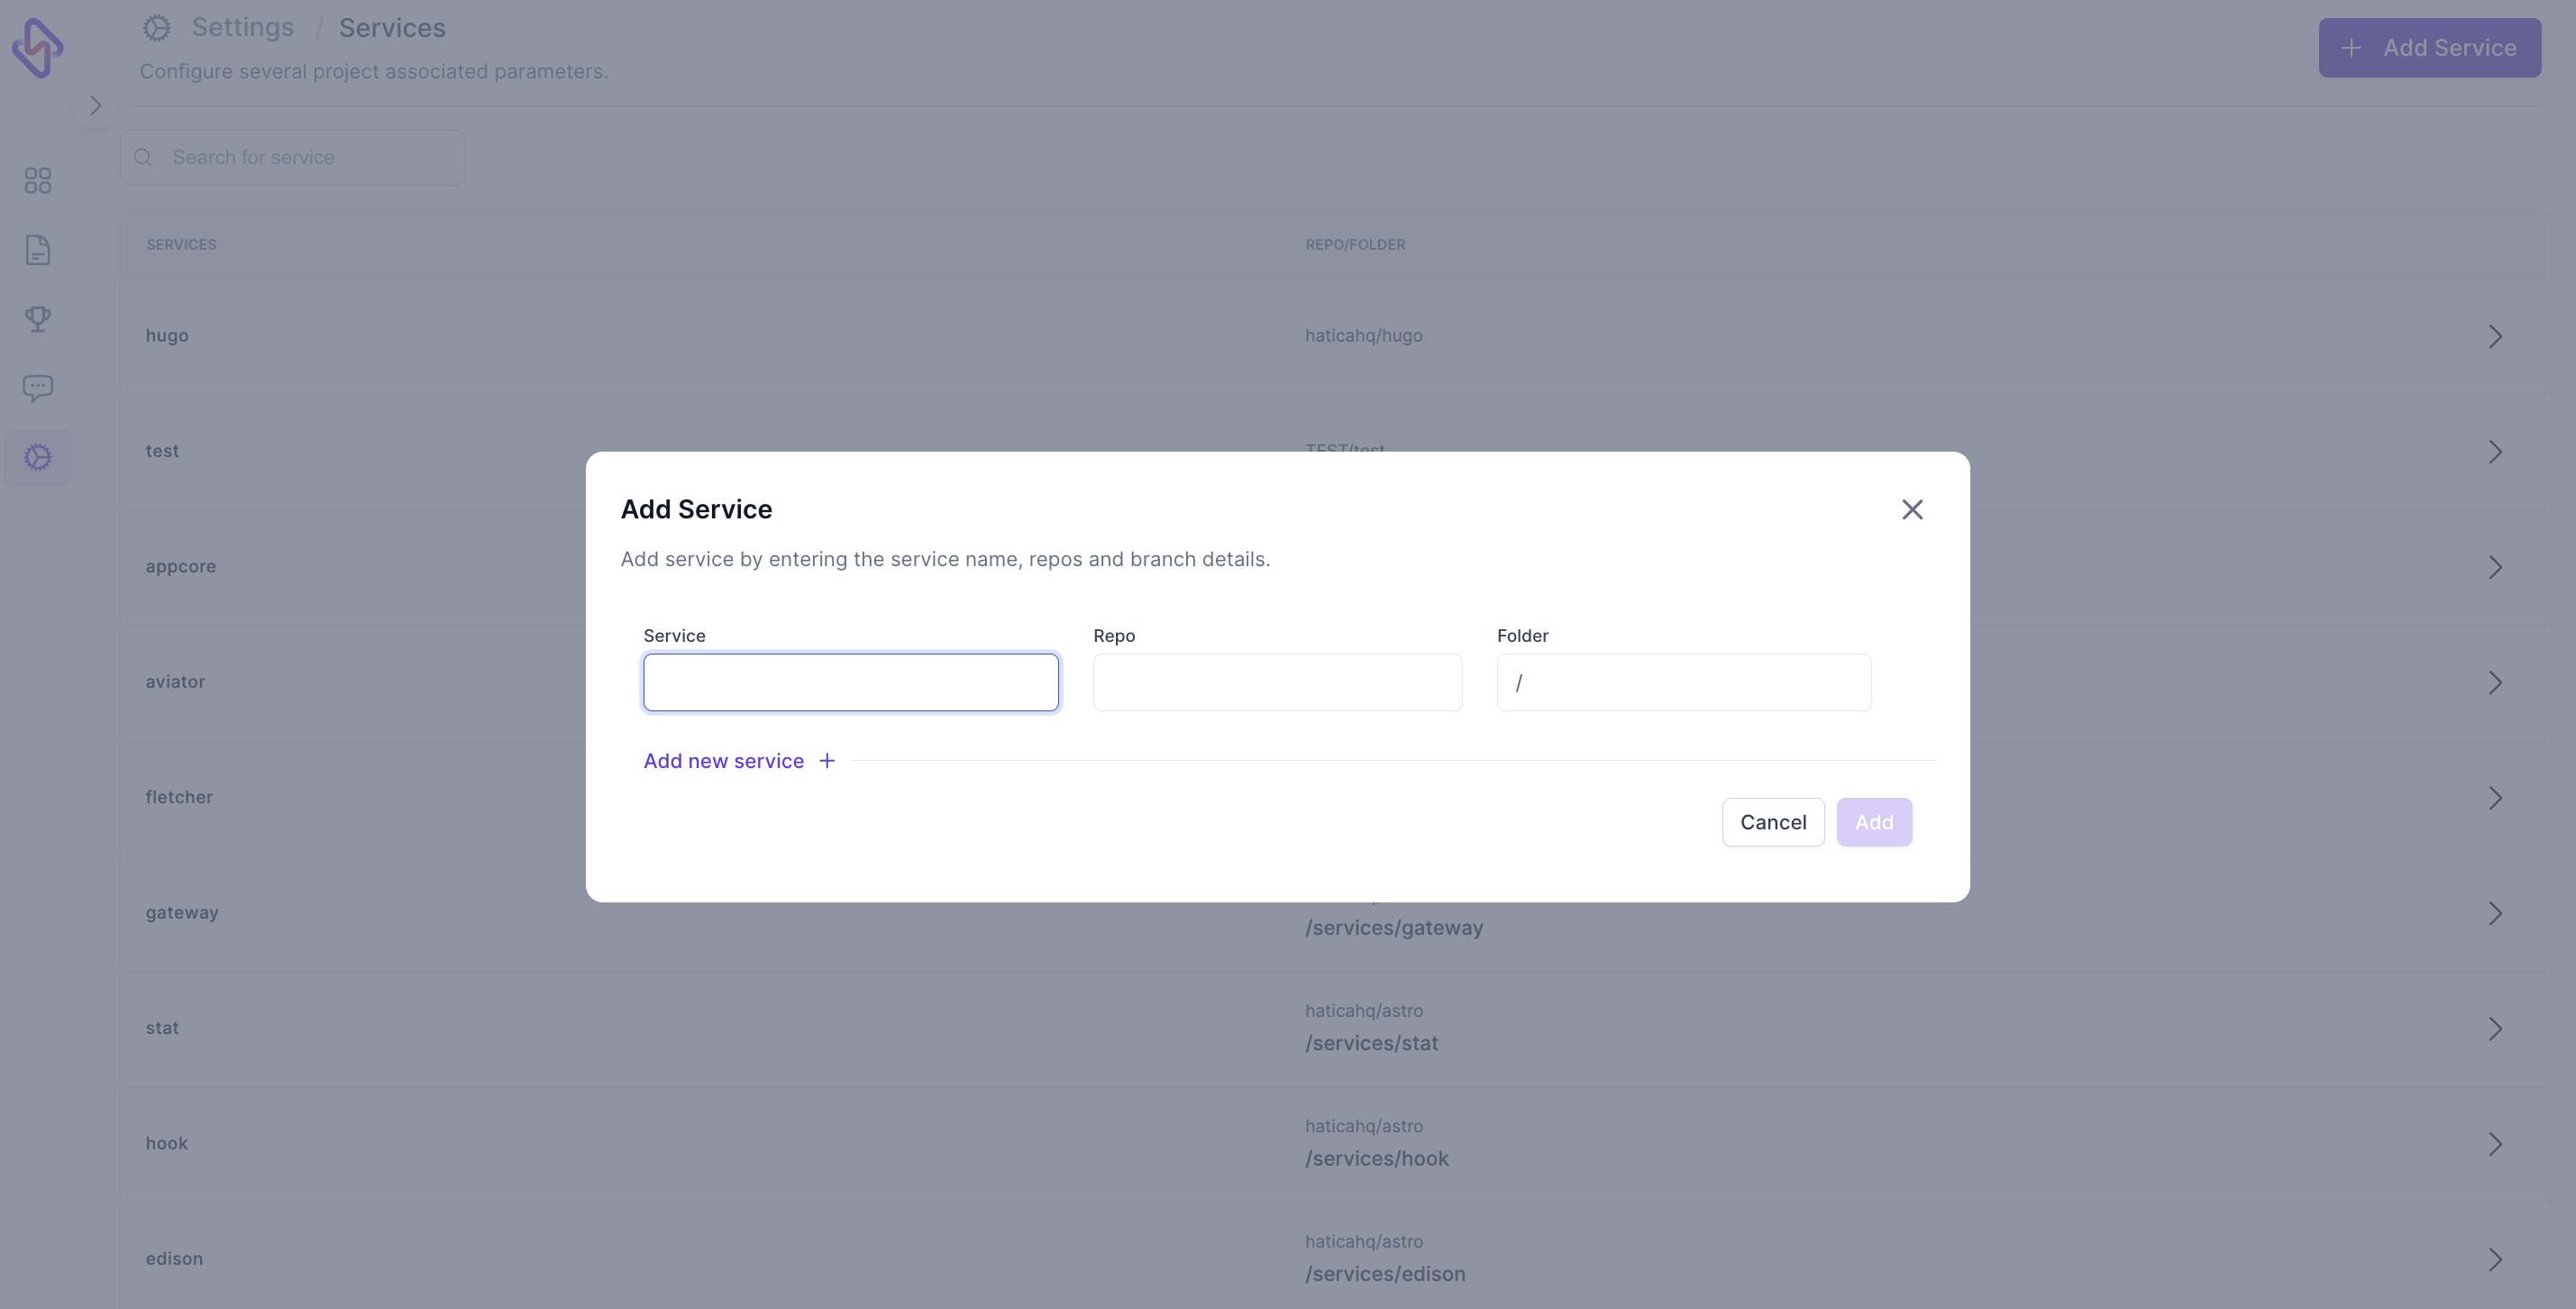
Note: Paths are optional however you can specify multiple paths for a service if needed but for a repository there can't be 2 services with the same name
- Post service creation you will be able to see and update the service details in the services page.
Configure Deployment Tracking
- Use this link (opens in a new tab) and go to the Deployments page
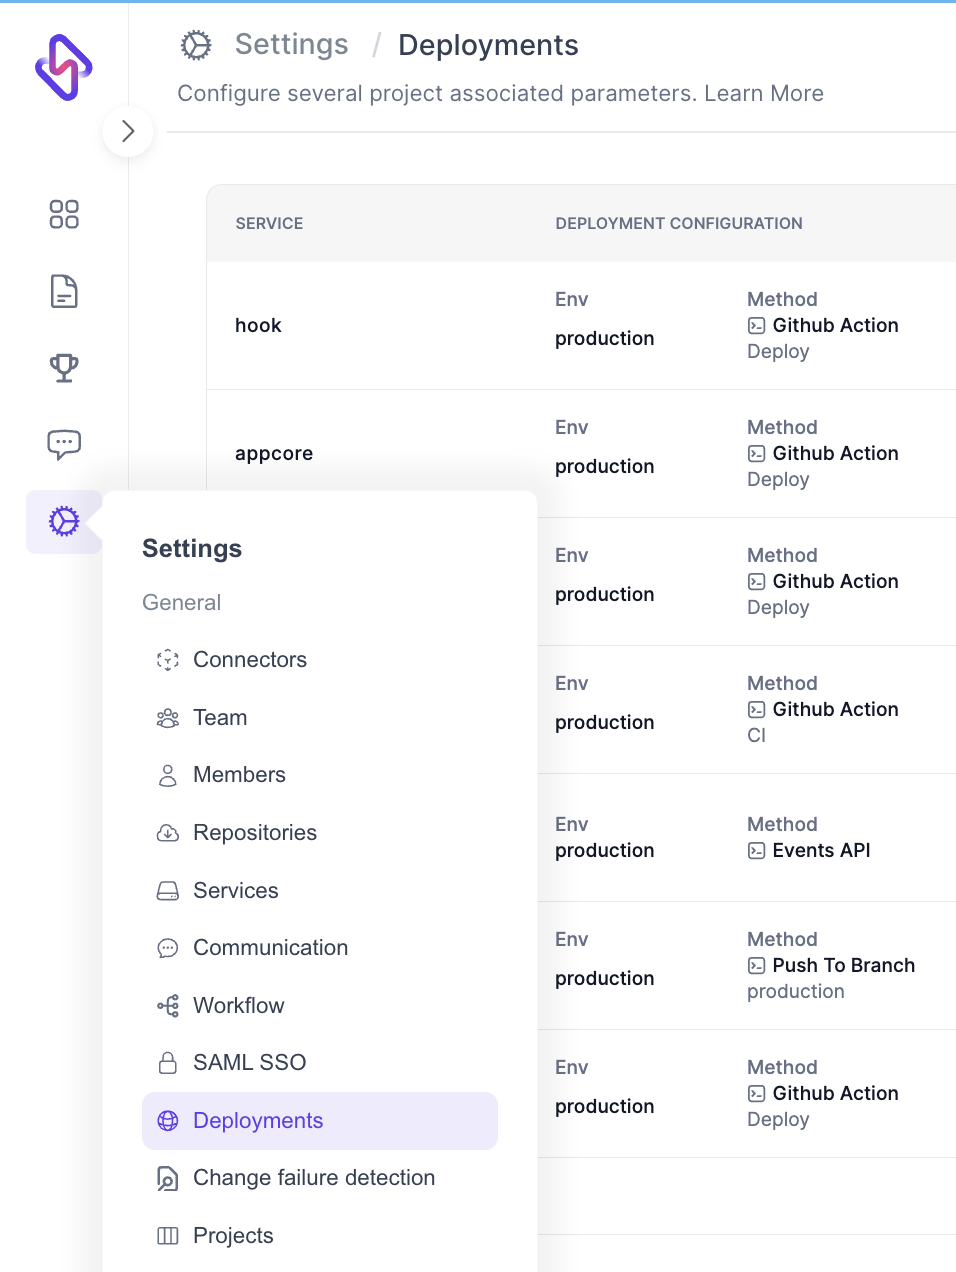
- Clicking on the
Add Deployment Trackingbutton will open a modal where you can select the service, environment and the tracking method.
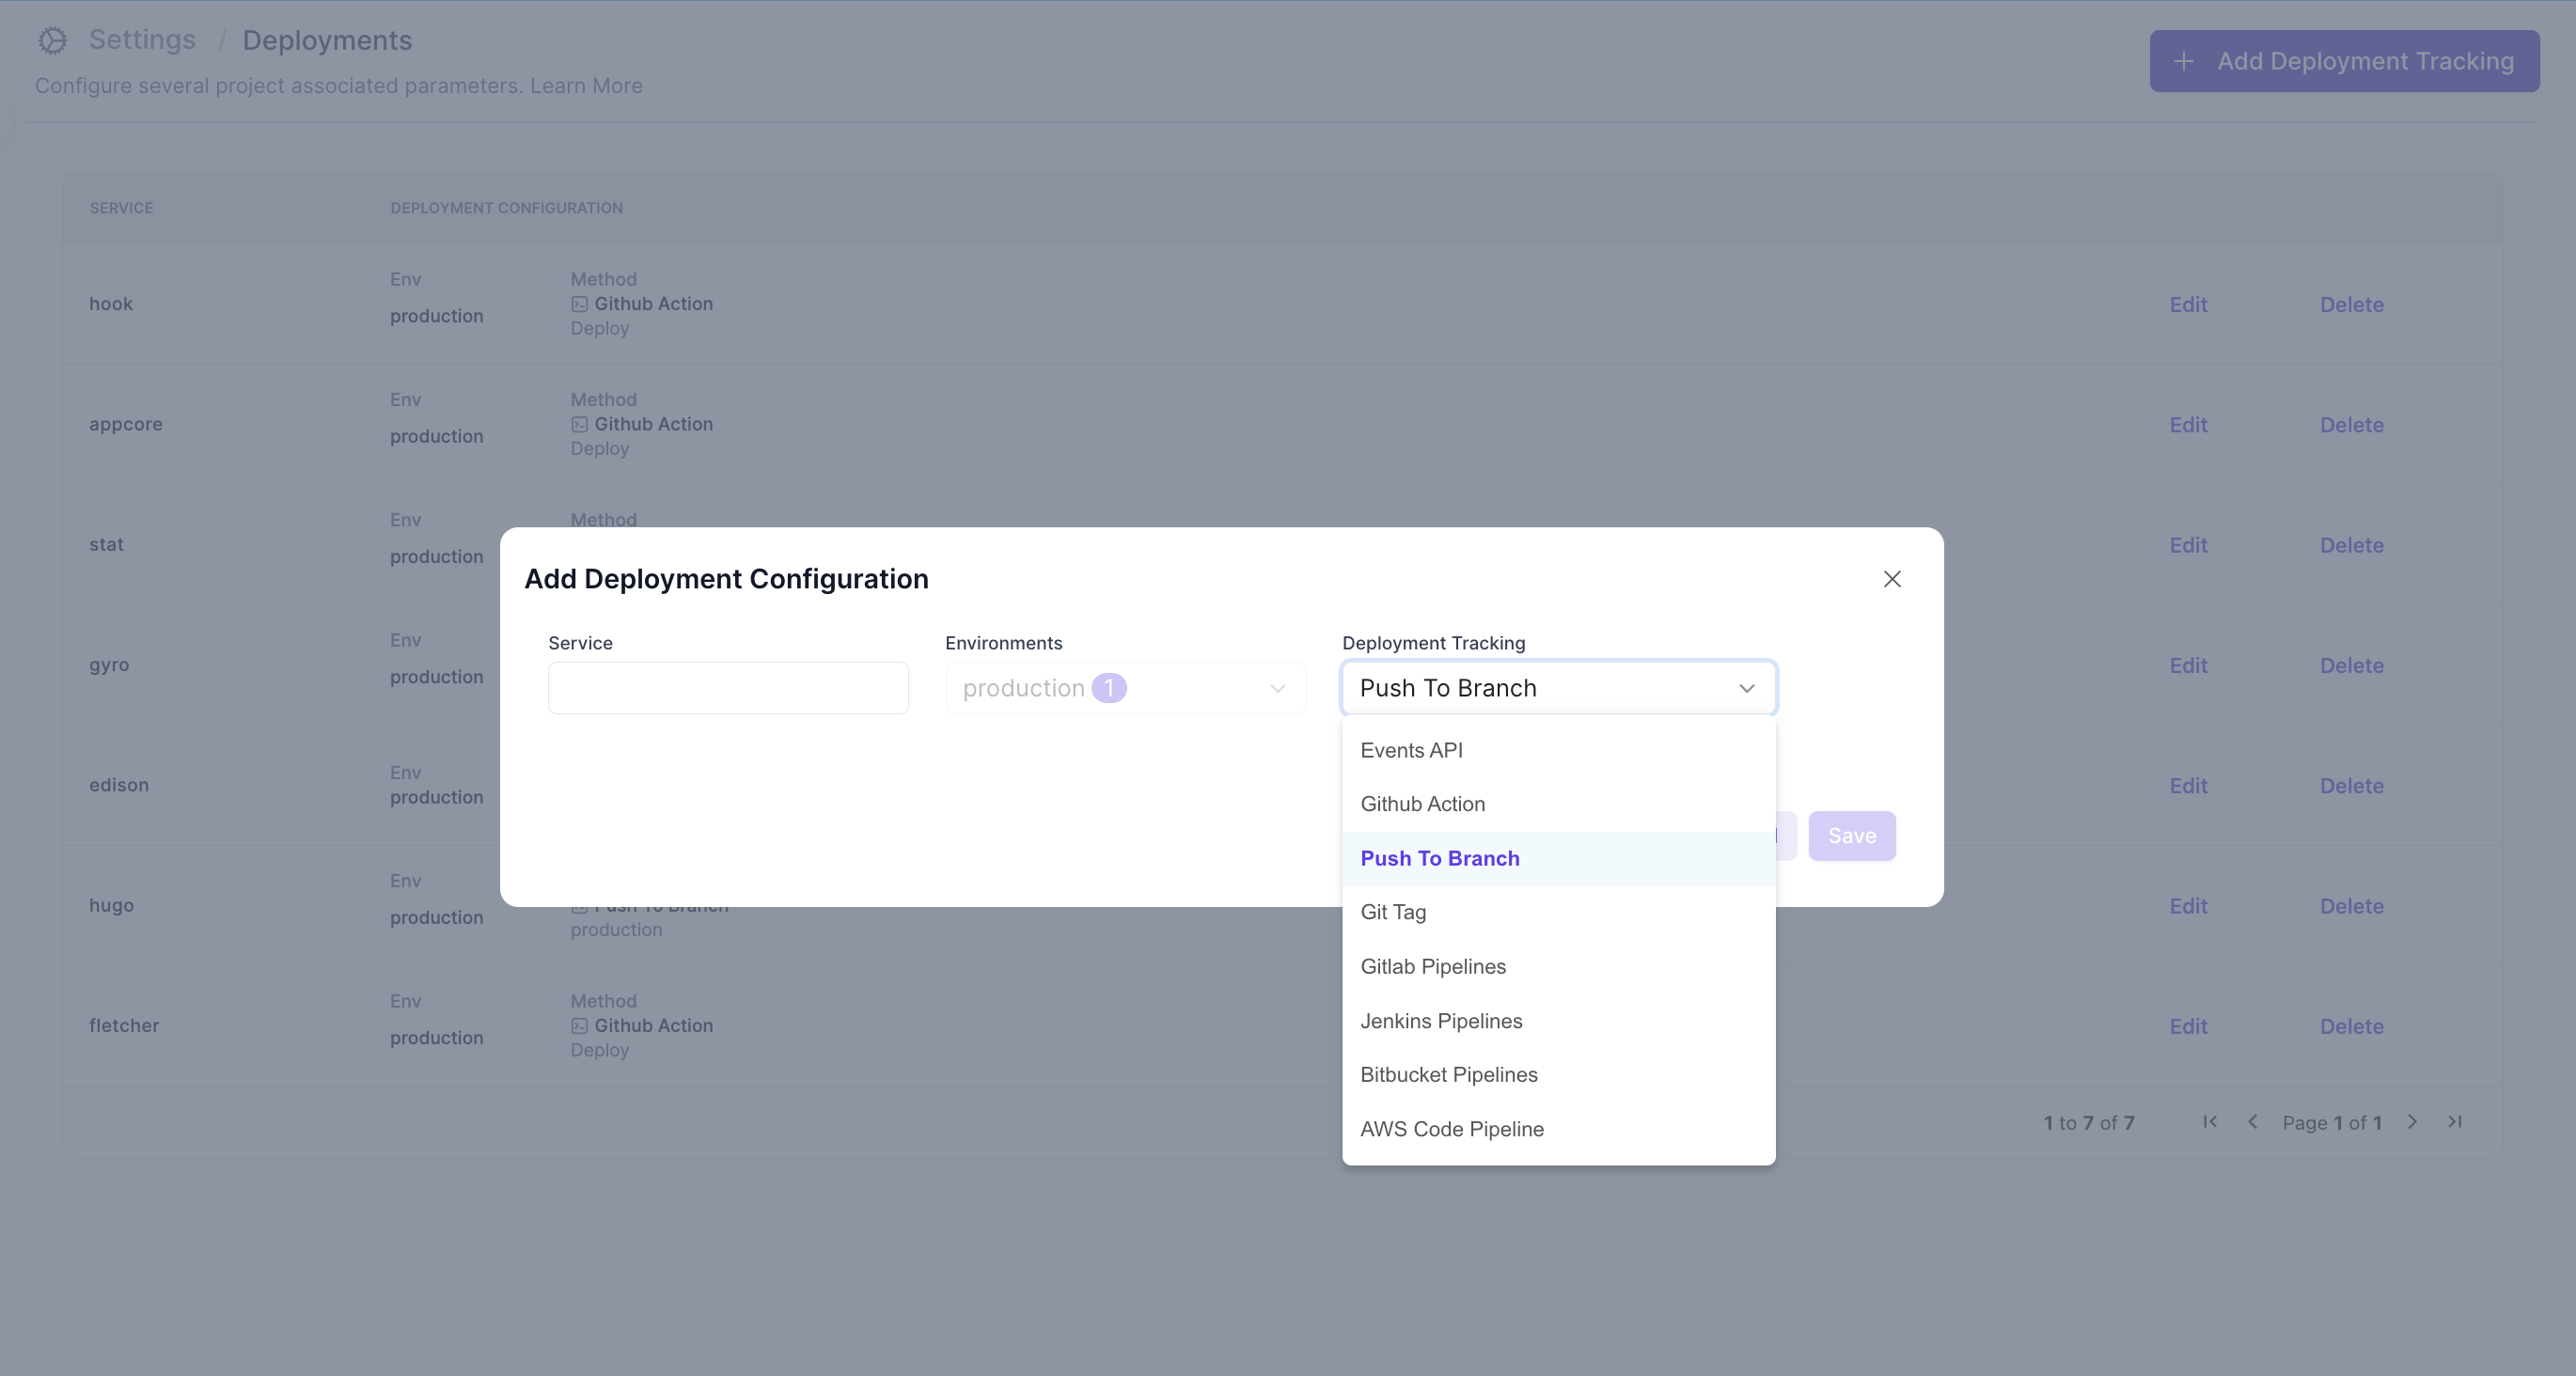
Note: Currently we only support configuring deployments for Production environment
-
Supported tracking methods are as follows:
-
Events API: You can integrate our Events API with your deployment workflow where you can call our EventsAPI to populate deployments on DORA dashboard. Use this link (opens in a new tab) to see the Events API documentation.
-
Github Actions: If you use Github actions, select your Action from the dropdown and the method.
-
Gitlab Pipelines: If you use Gitlab pipelines, select the relevant job from the pipleline.
-
Bitbucket Pipelines: If you use Bitbucket pipelines, select the relevant job from the pipleline.
-
Jenkins Pipelines: If you use Jenkins pipelines, select the relevant job from the pipleline.
-
Push to branch: You can configure pushing/merging to a branch as a deployment with this option. Input needed here is the name of the branch.
-
Git Tag: You can configure Git Tag as a deployment with this option. Input needed here is the regex of the tag.
-
-
Post Deployment Config creation you will be able to see and update the details in the Deployments page.
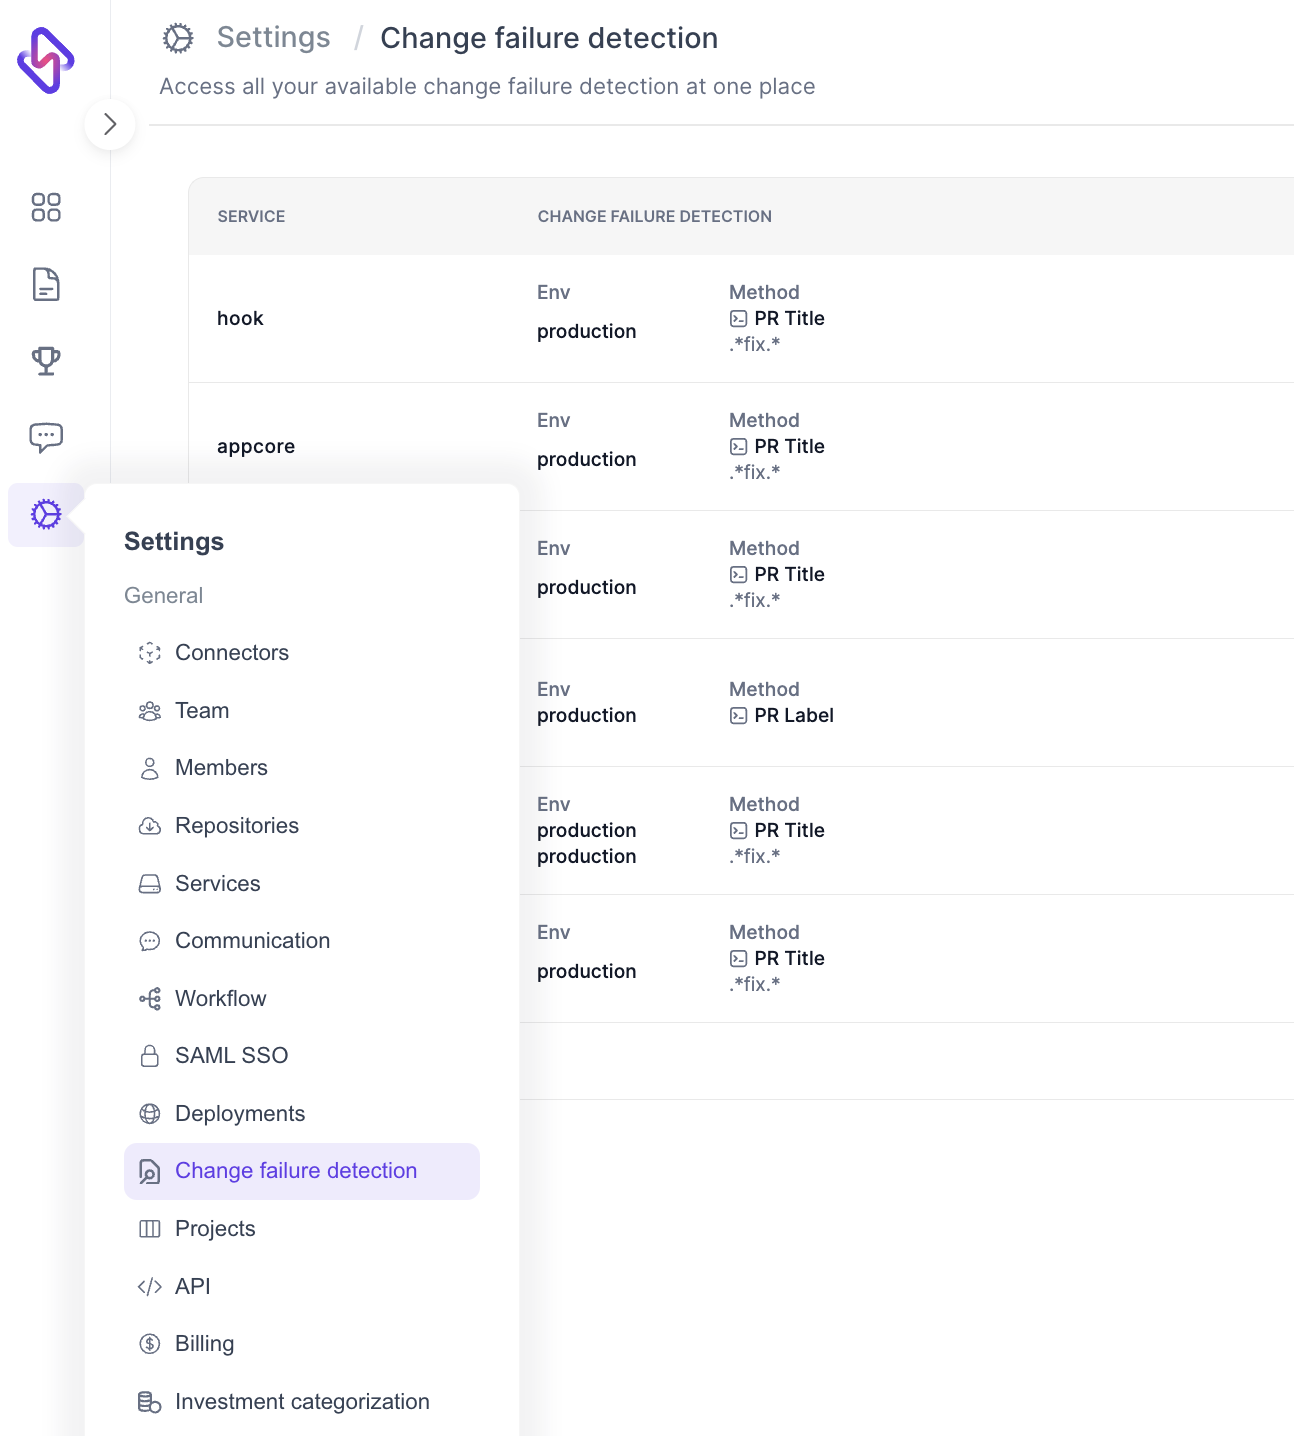
Configure CFR Tracking
- Use this link (opens in a new tab) and go to the CFR page
- Clicking on the
Add Change Filure Detectionbutton will open a modal where you can select the service, environment and the detection method.
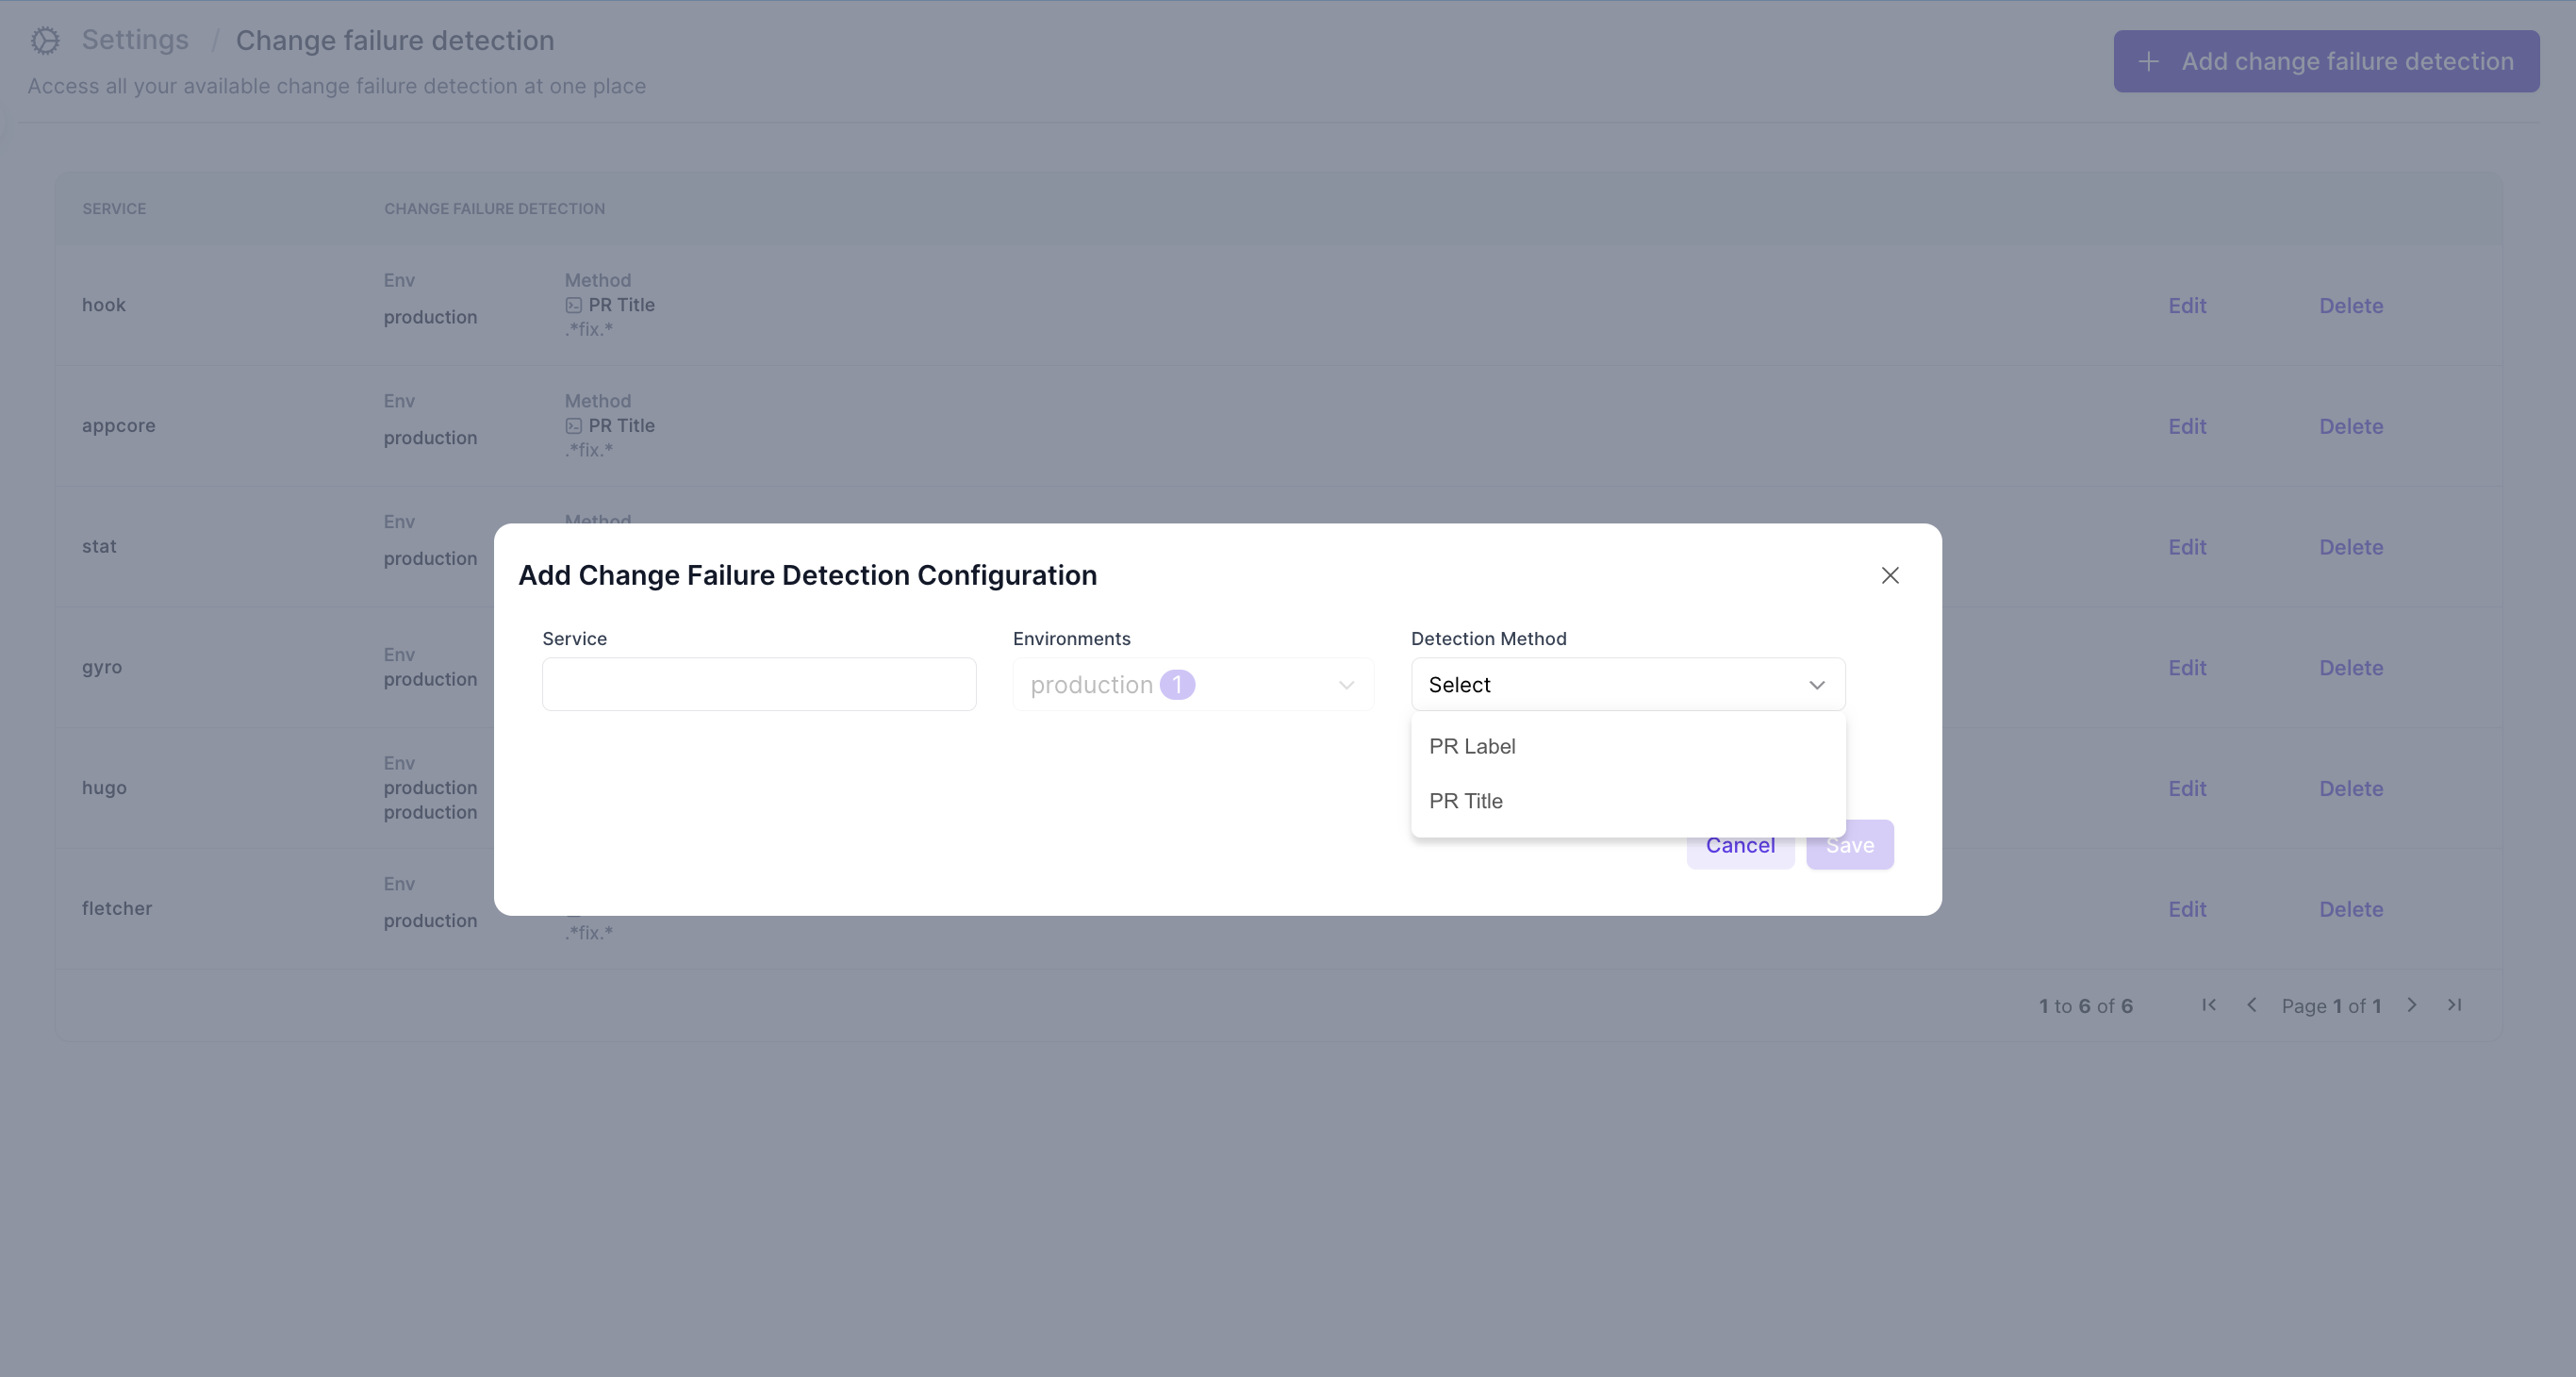
Note: Currently we only support configuring CFR for Production environment
-
Supported tracking methods are as follows:
-
PR Label: If there's a failure, the PR label used to differentiate the fix is required to track the failures. You will need to provide PR label regex to track the failures.
-
PR Title: If there's a failure, the PR title used to differentiate the fix is required to track the failures. You will need to provide PR title regex to track the failures.
-
-
Post CFR Config creation you will be able to see and update the details in the CFR Detection page.
Note: Post creation of the service, deployment and CFR we start the data processing and it will take some time for the data to start appearing on the DORA Metric Dashboard