Team Overview
Similar to Org Overview dashboard, the Overview section under Teams gives you a holistic view of a team’s performance metrics at a glance. This dashboard is primarily aimed at engineering managers and teams leads. The dashboard further breaks down analytics into multiple cards:
- Activity counts
- Goals & pertaining notifications
- Investment breakdown for the team
- Cycle time & components
- Code churn & components
- Stand-ups
- Contributors
Data Sources
- VCS tools power metrics like cycle time & code churn.
- Project management tools power metrics like issues resolved and comments.
Activity Counts
The Activity Count card showcases the most prominent metrics about your team’s overall development work and collaboration at a glance.
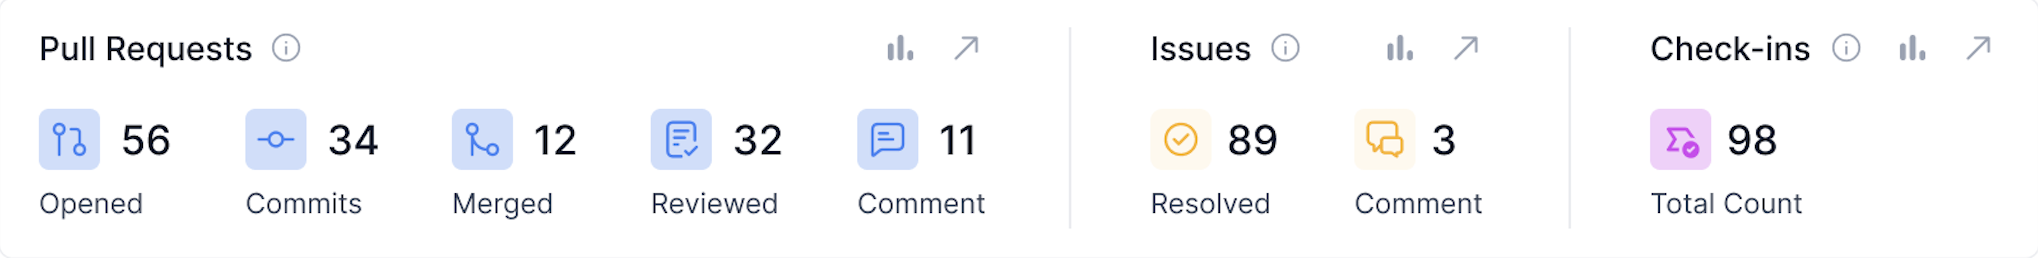
Metrics:
- PRs opened
- PR commits
- PRs reviewed
- PRs merged
- PR comments
- Issues resolved
- Task comments
- Total check-ins
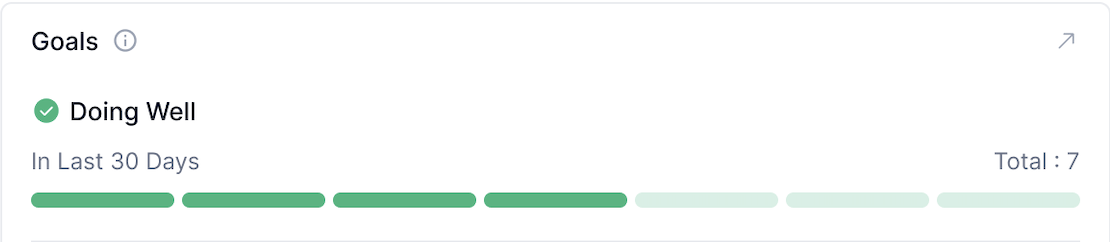
Goals 🔔
After identifying bottlenecks in your SDLC process, you can adopt PR goals like merge target, LoC targets, code quality, cycle time metrics, well-being metrics, and project metrics. You can head to https://app.hatica.io/goals (opens in a new tab) and set-up to track by adopting meaningful goals mutually agreed upon by your team and automate deviations, feedback loops, and measure progress. You can read more on goals by Hatica here (opens in a new tab).
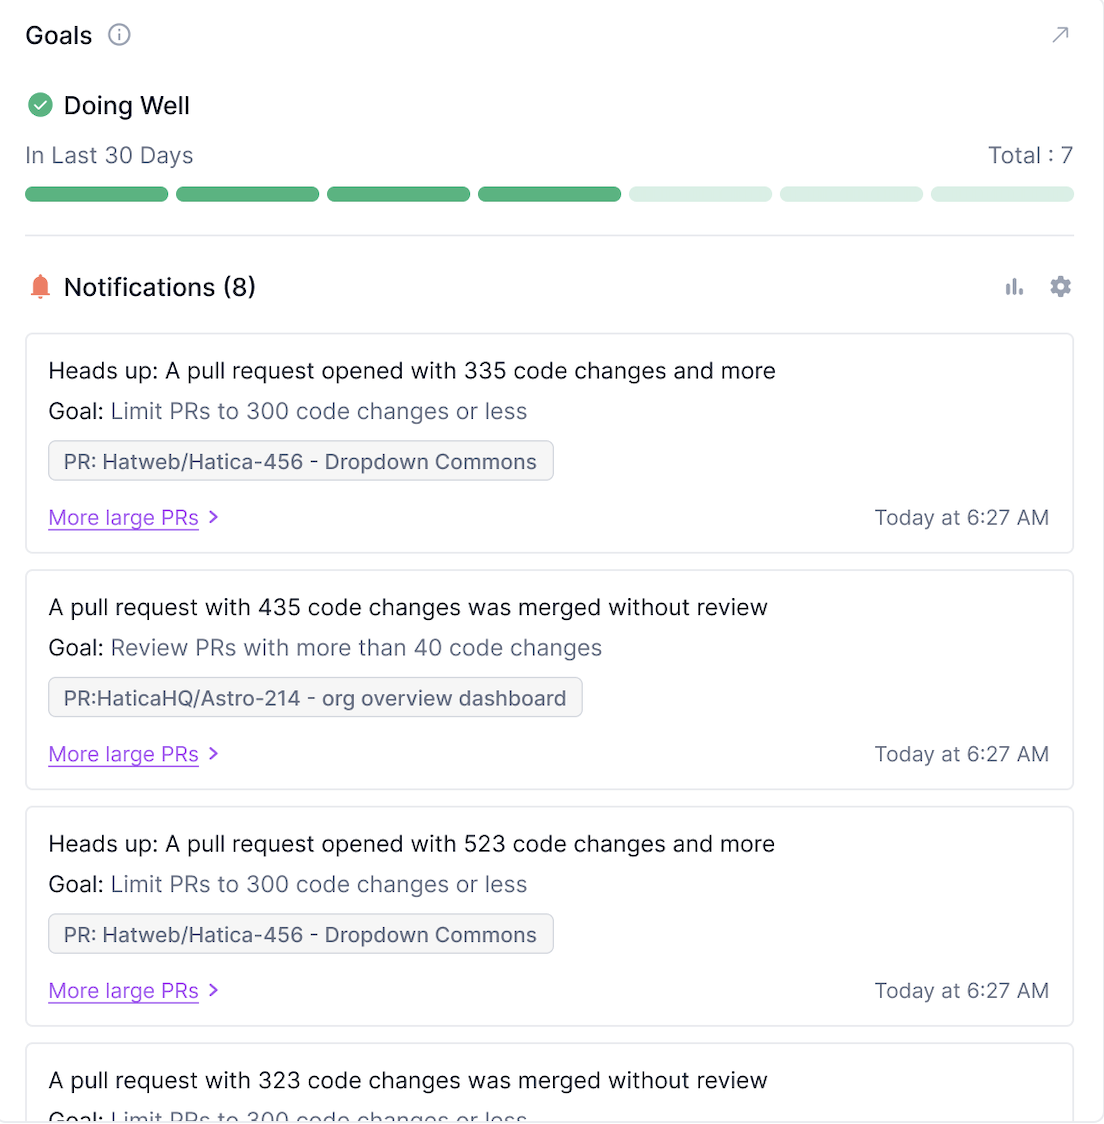
In this section, you’ll see all configured goals, goals that are on point and notifications on violations of configured goals.
The top half of the section gives you a holistic idea about the total number of goals adopted by the team/lead and a ratio of the number of those goals with zero violations to the total number of goals adopted. This is represented by the Doing Well count, as a stacked horizontal bar highlighting the count of goals doing well.
The bottom half of the section has multiple notification cards, representing violations of said goals.
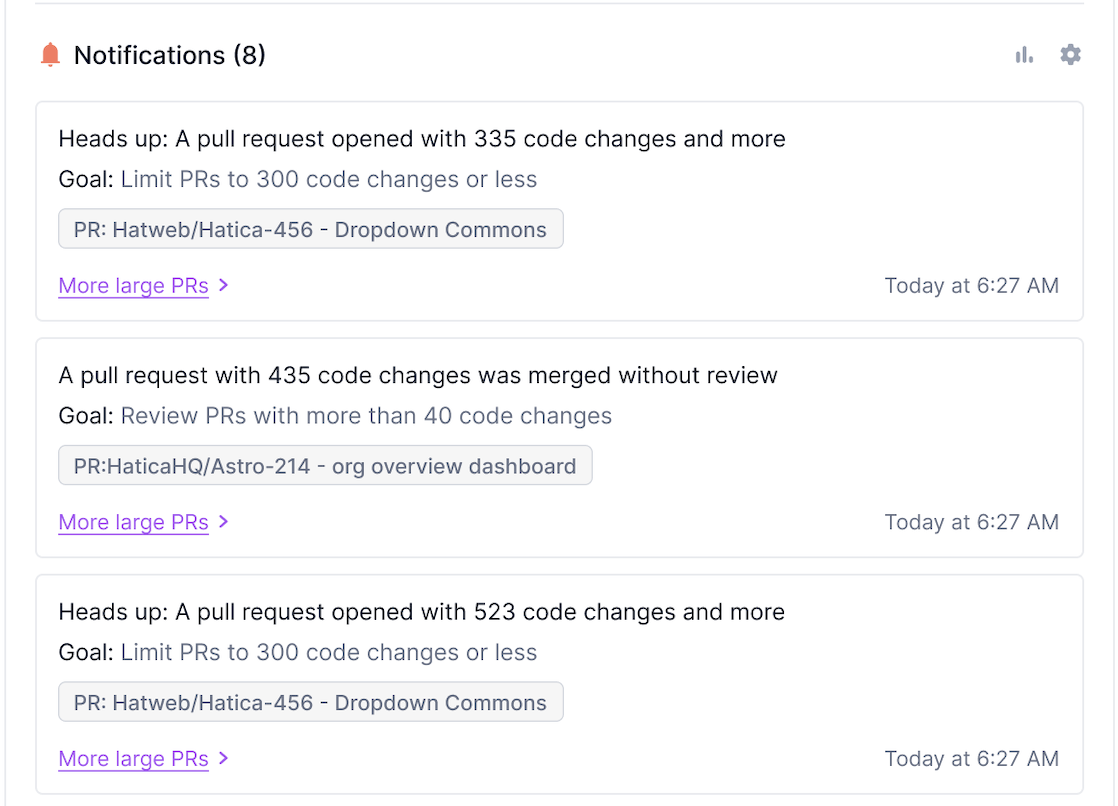
Broadly, each notification card will give you an idea about:
- Heads-up → This gives details about the violation and relevant top-level metrics around the same.
- Goal → Name of the goal and the threshold value set.
- A hyperlink to the violating PR/issue.
- A link to open the violation in the goals section and view all violations inclusive of the current one.
- Time/date stamp of the violation.
Investments Breakdown
This section depicts the breakdown of the different type of work the team is engaged in. These investment breakdown categories can be configured under investment categorisation (opens in a new tab) config in the settings section. Read more about how to configure it here.
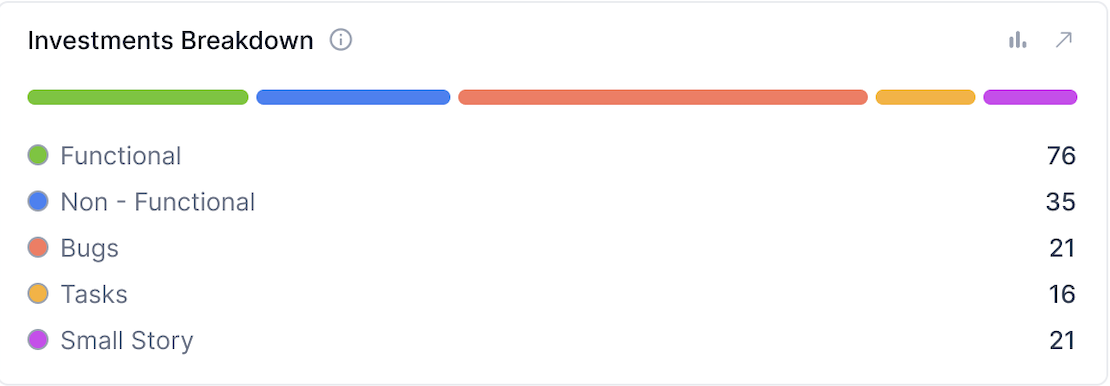
The breakdown displays a simple stacked bar proportionate to the investment in said category in terms of FTE.
Cycle Time
This section displays the aggregate average cycle time for all merged PRs & breaks down at each stage of development.
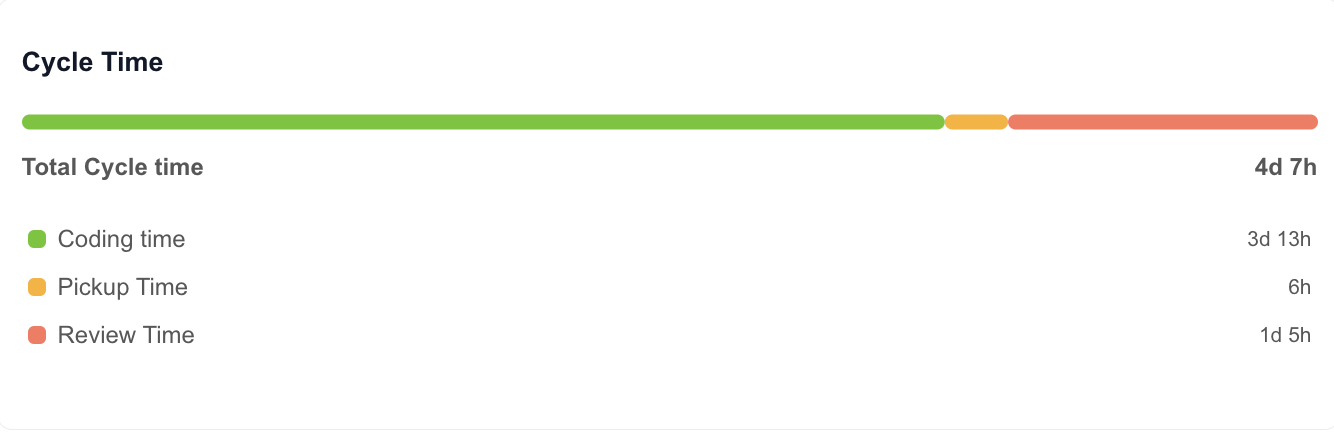
You’ll see the following sections:
- Cycle Time → the average cycle time of all PRs. The clock for Cycle Time starts when the first commit is done, and is stopped when the PR is merged.
- Coding Time → Coding time is the span of elapsed time from the first commit on a branch until a pull request is created for that branch.
- Pickup time → Pickup time is the span of elapsed time from the pull request being created until the first comment, approval or request for changes action is performed.
- Review time → The time it takes from the first review to merging the PR. First review can be comments, approval or request for changes.
Code Churn
This section indicates your code rework and breaks it down into the following components:
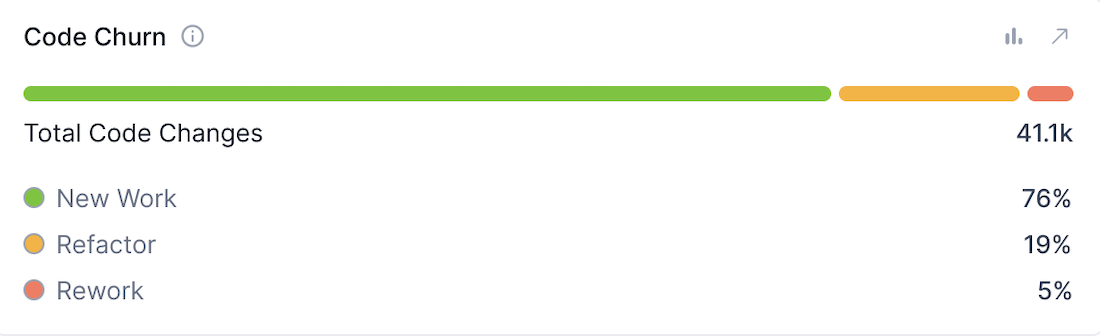
- New Work → Code that is newly added and not replacing/rewriting existing code. As a standard, we should strive to maintain the new work component greater than 50%.
- Refactor → Code that is modified after 21 days. This is usually an acceptable change needed for maintenance and is therefore separated out from code churn so as not to raise flags.
- Churn → Code that is deleted/rewritten within 21 days of merging is called code churn or rework. As a standard, we should strive to maintain the new work component less than 10%. High performing teams have churn below 5%. It must be noted that while this gives you an idea about development quality, some churn should be expected in scenarios where a developer is experimenting a solution, for example.
- Helping Others → code that is replaced by engineers other than the author of the original code within 21 days of merging. This helps you measure to what extent developers are helping their teammates to improve code quality and delivery.
Stand-ups
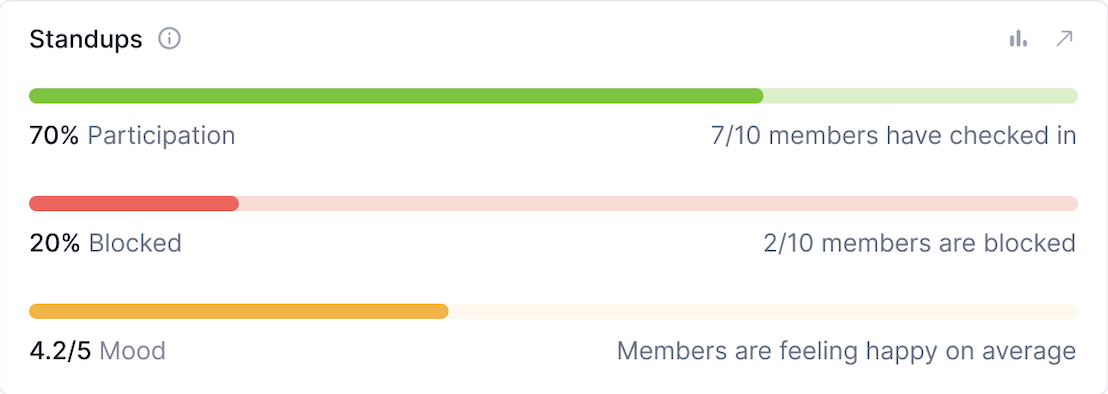
This section gives you a broad idea of:
- % Participation → Ratio of participants to all the recipients of the check-in form.
- % Blocked → How many participants are blocked on their tasks. Clicking on the bar will take you to the Team Stand-ups dashboard for a deep dive into those blockers.
- Mood → What is the average sentiment in the team.
Please note that this section will give you analytics based on the current day’s check-in responses and not aggregate it for the timeline selected in the filter query builder. In case the check-in is yet to be triggered at the time of operating this dashboard, you’ll see yesterday’s (the latest) set of responses.