Cycle time dashboard
The Development Cycle Time dashboard represents a set of key metrics that summarise the velocity of the entire software engineering lifecycle. The dashboard captures the time spent from the first PR Commit all the way through to Production deployment. Each stage of the engineering cycle, is represented by a tab.
Dev Cycle time is among the most widely tracked metrics across engineering teams and is a great way to identify bottlenecks in the development process. Since cycle time begins with the first commit and ends with Production deployment, it gives a complete and holistic view of all the steps in the process; enabling you to understand what’s working, and what's not.
Video walkthrough
Data source
- Git/VCS apps
- CI-CD tools
Filters
- Date range picker
- View by Teams (managed teams, custom teams) and individuals
- Repository: to drill down into specific Git repositories
- Merged PRs only: to exclude any PRs that are not merged
- Base branch: to filter PRs that are cut from/merged to a specific branch
The default branch names in GitHub & GitLab <v14.0 is main and master in case of Bitbucket & Gitlab v14.0
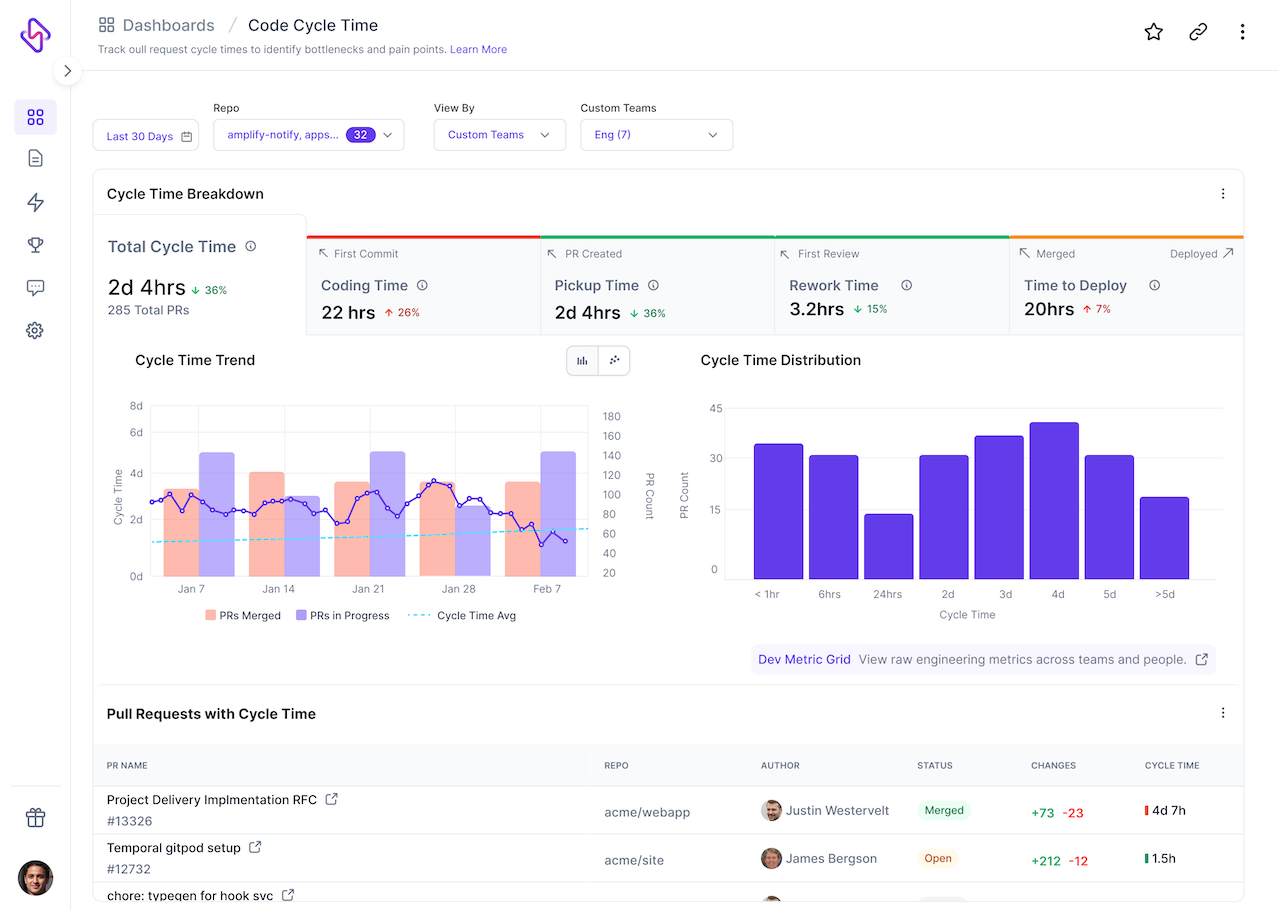
Cycle time breakdown
This widget displays the aggregate average cycle time & break down at each stage of development across the selected filters
- Total cycle time: is the average cycle time of all Pull Requests (PRs)
- Coding time: is the average of the time spent from the First commit until the PR is created.
- Pickup time: or more specifically Pickup for Review time, is the average time that PRs are waiting for a Review. This is measured as the difference between PR Creation and the first Review action on the PR. A Review action can be a comment, approval or request for changes
- Review time: is the average time spent by PRs in the review process. This includes all time spent iterating on the PR, making changes until the Merge
- Deploy time: is the average time spent by PRs from Merge until Deployment into the Production environment. The deployment data is sourced from deployment systems integrated with Hatica. Refer to the DORA dashboard for more information
This widget also provides a comparative trend vs. the last period, so if the data range is set to 30 days, say 1-Jun to 30-June, the comparison is versus the previous 30 days which is 2-May to 31-May.
Cycle time trend
The Cycle time trend provides a day-wise view of cycle time along with a list of PRs that contributed to the cycle time. Click on a day to bring up the context menu to see a full list of PRs along with the cycle time for each PR.
The light blue trend line is a linear regression plot of how the cycle time is trending within the specified date range. A downward trending plot is better because it indicates reducing cycle times through this period.
Use the cluster plot to view cycle time for every PR that meets the selected filter conditions.
Cycle time distribution
The Cycle time distribution is a histogram plot of the distribution of Cycle time across a few pre-defined categories. This helps visually identify
- Outliers that might be substantially increasing the cycle time
- A ‘fat-middle’ syndrome where bulk of the PRs are taking 2-4 days
- PRs that have very low cycle time (
<1hr,<8hrsetc)
As a distribution plot, this helps teams focus on PRs & PR trends that drive a shift-left on the entire distribution.
Ways to reduce your cycle time
Starting small and fast: You can deliver more by starting with smaller PRs and producing customer deliverables quickly.Automate, automate, automate: Use automated tools to save efforts and delivery time. You can implement continuous integration through automated releases and invest the remaining time in coding.Slicing the giant PR: Breaking the work items into smaller chunks and iterating frequently enables your team to perform better. It also reduces the pickup time and review time for the pull requests significantly. The general industry standard for PR size is 300 lines of codes(LOC).
Use cases
- Understand end-to-end cycle time for the entire engineering org
- Benchmark teams vs the org-wise baseline
- Identify life cycle stages which are leading to higher cycle times at the org or team level
- Identify teams, repos that are not syncing the Deployment data
Use other dashboards to delve deeper into specific issues for eg. if PR pickup time and review times are high then use the Review Collaboration dashboard to diagnose the issue(s)
Insights
Use this dashboard to get insights irto the following
- How much time is spent in coding?
- How much time do PRs spend waiting for reviews
- How quick are the reviews
- How quickly do merged PRs release to Production
- What is the relative changes in cycle time for each of the development stages compared with the previous period?
FAQs
We use GitFlow-branching, how do we compute cycle times for a specific release?
Use the Head branch to filter for all PRs merged to the development branch. As the branch name might vary across Repos it is important to provide the correct branch name in this filter
We use trunk-based development, how do we compute cycle times for a specific trunk?
Since the trunks are short-lived and merge to the master branch; the Base branch filter can be set to master to filter all PRs merged to the master branch
If the data is not filtered by Base or Head branch, what is the cycle time representing?
In this case, the Cycle time is computed for all PRs across all branches in Git, regardless of what is the base branch or the head branch.
My team relies on Local branches for development & does not merge these into Remote branches. How is the cycle time computed?
Cycle time is only computed for Remote Git branches; local branches are not included in computing cycle time.
How to compute Cycle time only for PRs that are merged and ignore PRs that are in other states?
Use the “Merged PRs only” filter to exclude PRs in other states
Further reading
- Here are a few ways to improve your dev velocity based on the dev cycle time metrics: https://www.hatica.io/blog/cycle-time-to-improve-dev-velocity/(opens in a new tab) (opens in a new tab)
- Get an overview understanding of the dev cycle time and how it can help your teams: https://www.hatica.io/blog/cycle-time/(opens in a new tab) (opens in a new tab)
- Trunk-based Development vs. Git Flow https://www.toptal.com/software/trunk-based-development-git-flow (opens in a new tab)