Projects
The Project Dashboard provides a comprehensive view of your organization's projects, empowering you to monitor progress, delivery, effort, and performance all in one place. Whether you’re an engineering leader, project manager, or part of a development team, this dashboard is an essential tool for staying on top of your team's work. It helps you identify potential bottlenecks, assess team allocation, and ensure projects are on track to meet deadlines. With clear visibility into every aspect of your projects, it enables you to make informed decisions and adjust your strategy as needed.
When you click on "Projects" in the sidebar, you land on the main page of the Projects Dashboard. This page offers a quick performance snapshot, covering delivery, effort, investments, and overall progress for all the projects you have access to.
To explore a project in more detail, simply click on it. You'll be able to see a sprint-by-sprint or week-by-week breakdown, depending on whether you’re using Scrum or Kanban. This detailed view provides a clear understanding of the project's current status and future trajectory, helping you take proactive steps to maintain momentum.
In Hatica, projects are versatile entities that can encompass boards, labels, initiatives, or custom-defined projects, supporting both Scrum and Kanban methodologies. To define your projects, use the Settings → Projects menu.
Metrics
- Planning Accuracy: This metric shows how well you stick to the tasks you planned at the start of each sprint. It helps you see if you’re completing the tasks you intended to or if adjustments are needed. Planning Accuracy is calculated as the ratio of planned issues or story points completed out of the total planned issues (tasks added to the sprint within 24 hours after the sprint start date).
- Capacity Accuracy: This metric measures the total issues or story points (both planned and unplanned) completed by your team in an sprint compared to the originally planned amount. This measure helps understand whether the work being planned is greater than or lower than the available engineering “bandwidth” and is independent of planning accuracy.
- Delivery Metrics
- Planned: The total number of issues planned for a sprint. These are the issues added to the sprint up to 24 hours after the sprint start date, aggregated from all sprints within the selected time period.
- Completed: The total number of issues completed within the selected time period, aggregated from each sprint's completed issues.
- Added: The total number of issues added to the sprint after the first 24 hours of the sprint start date. This value is aggregated from each sprint's added issues during the selected time period.
- Carryover: The total number of issues that remained incomplete at the end of each sprint, aggregated from each sprint's carryover issues. Issues carried over multiple sprints are counted for each sprint they are carried over.
- Average Issues Resolved per Week: Displays the average number of issues resolved each week, helping you assess overall productivity and identify trends.
- Net Issues Resolved: Shows the total number of issues completed over the selected time period, giving a comprehensive view of task completion.
- Investments
- Priority: Categorizes tasks by their priority levels (High, Highest, Medium, Low), highlighting the urgency and importance of the work completed by your team.
- Work Type: Classifies tasks based on the issue types defined in your project management platform (e.g., Task, Sub-Task, Bug), giving a detailed view of the nature of work accomplished.
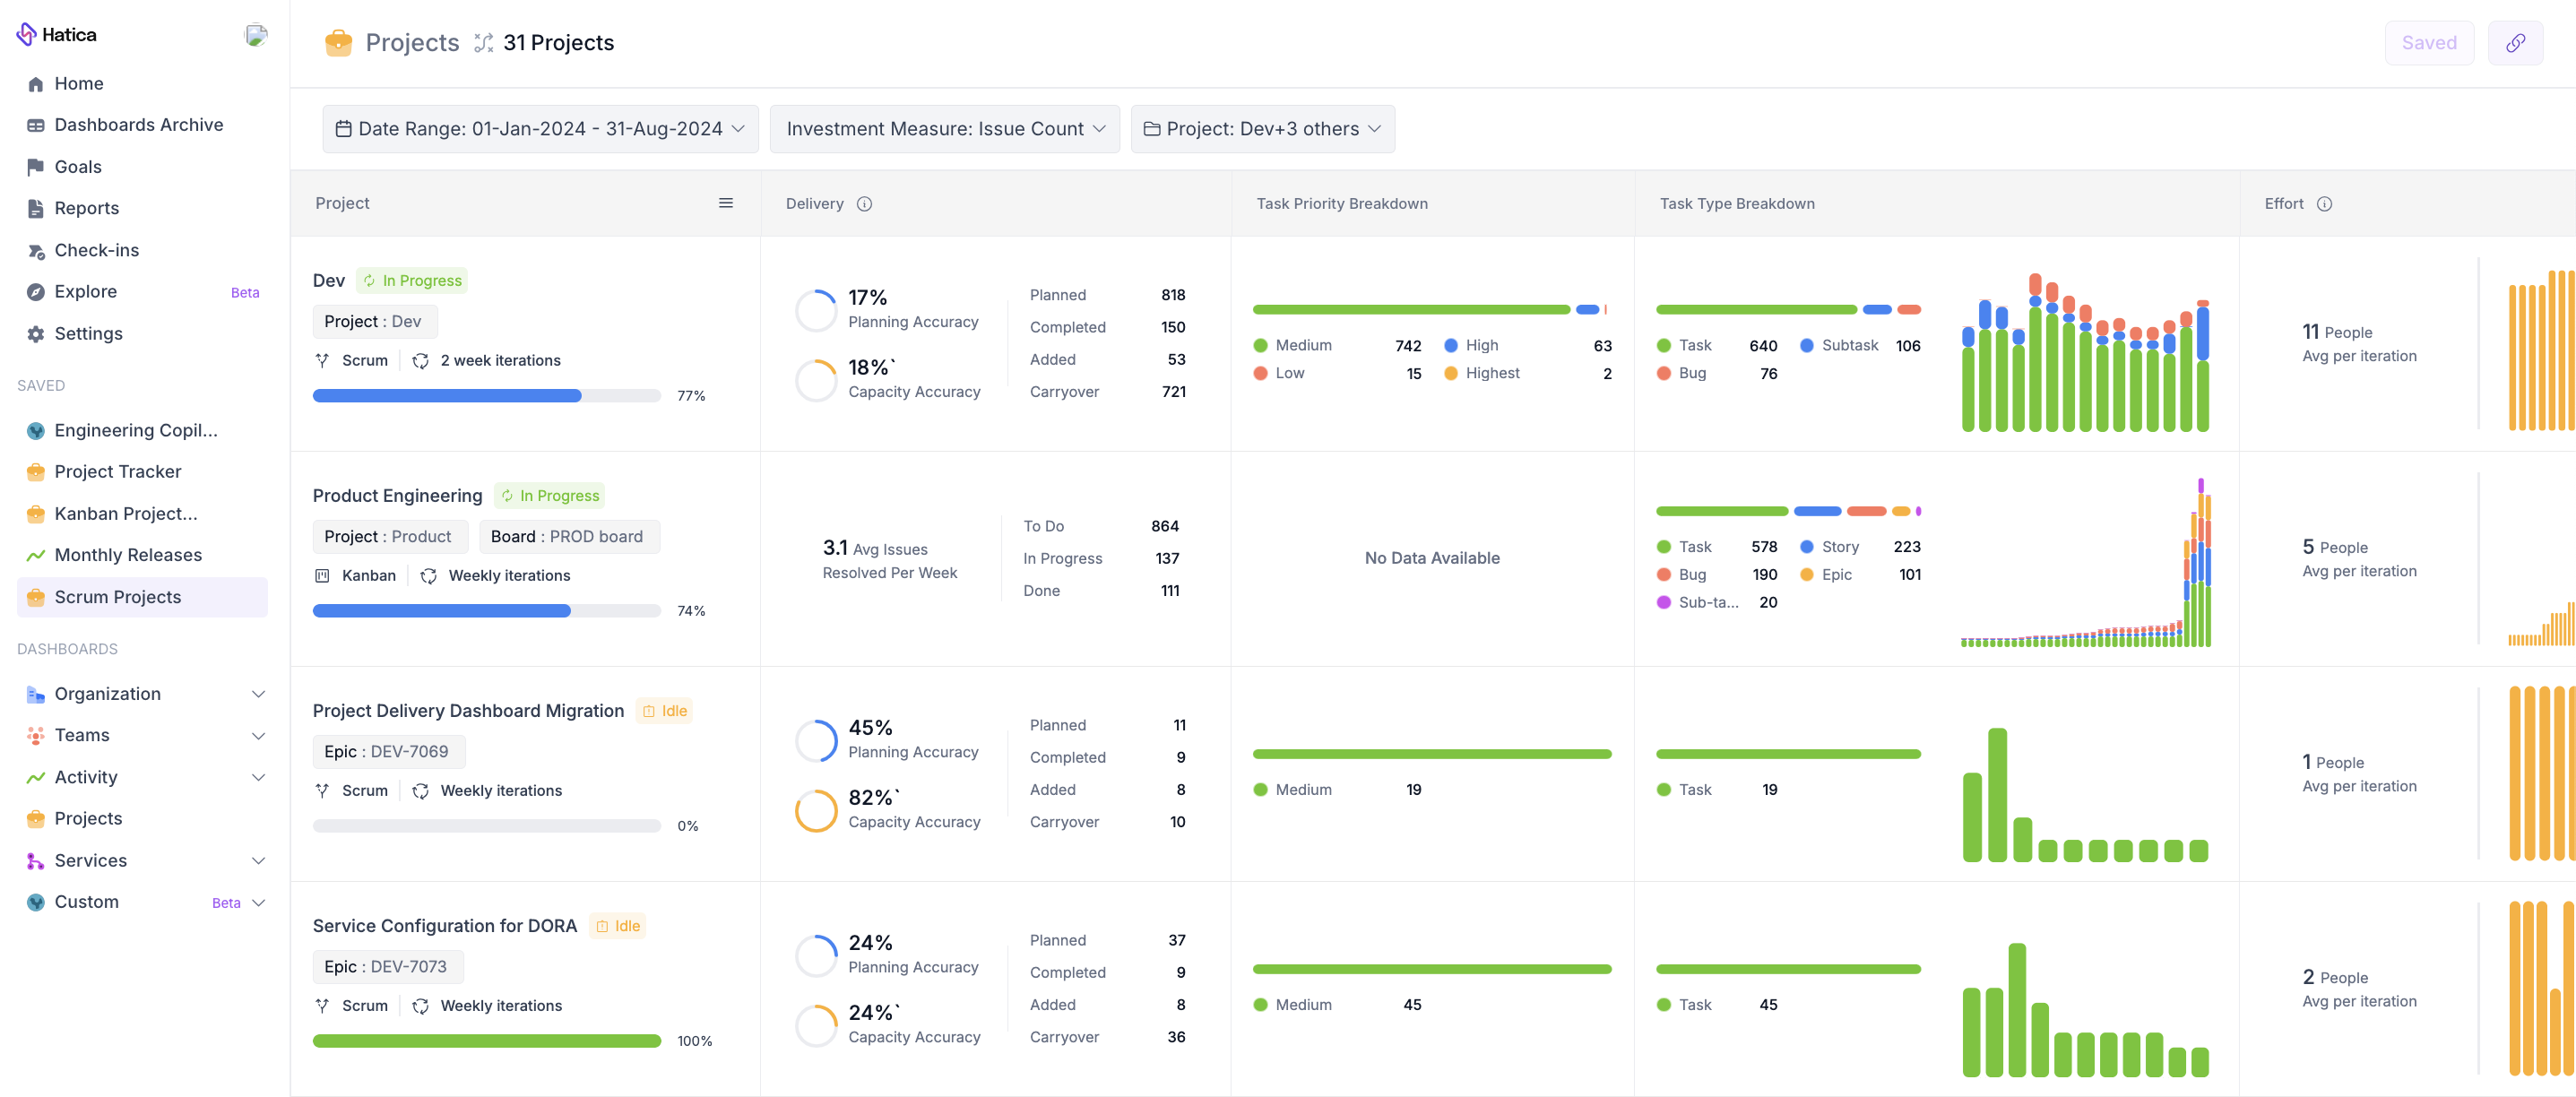
Project: List View
From the main page of your Projects dashboard, you can see the list of projects in your organization and an at-a-glance update on project delivery, team allocation, and team investments. To dig deeper into an individual project, click on the Project itself to open the Expanded View.
Filters
- Duration filter: This helps you filter data for the desired duration.
- Effort Measure: Measure for the effort spent, either story points or issue count.
- Projects Selector: Select the projects you want to view, by default all the views are selected.
General Project Information
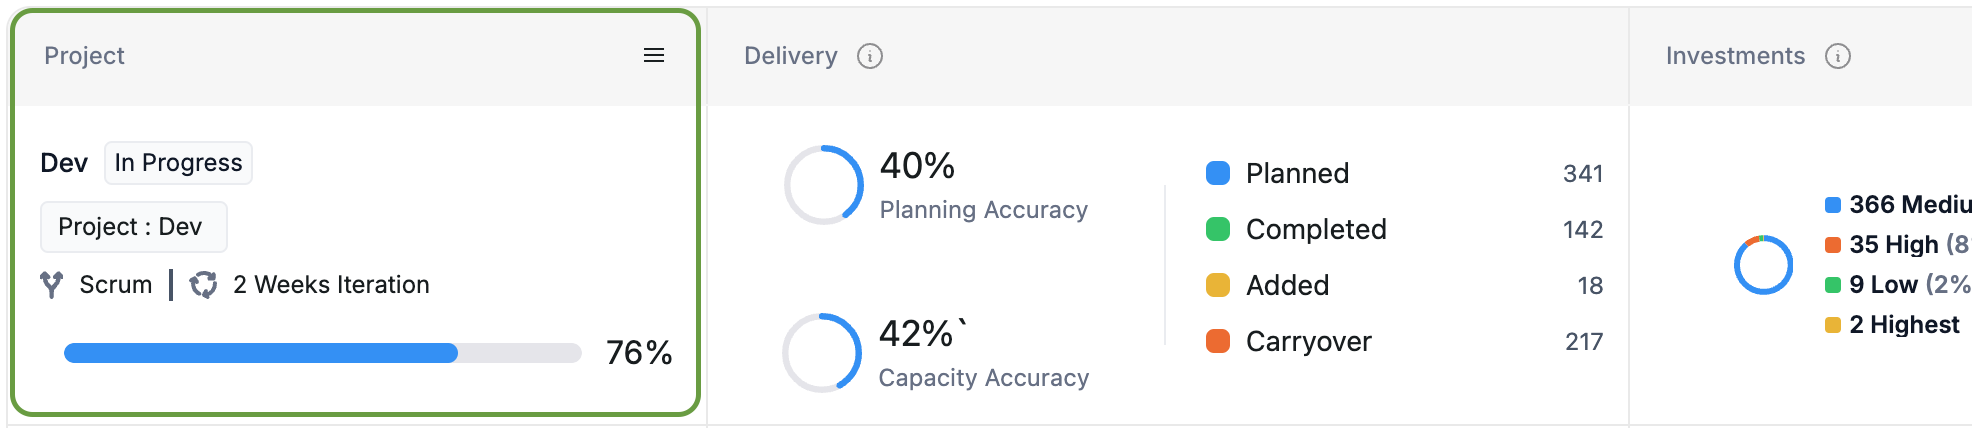
This section provides a detailed overview of the project, including:
- Name of the project.
- Defined scope of the project (Epics, Jira Project, Initiatives, etc.).
- Methodology used, either Scrum or Kanban.
- Duration of iterations or sprints in weeks.
- Project Completion Percentage reflects the percentage of tasks completed within a project by comparing the total number of completed tasks to the overall number of tasks in the project.
- Elite - Green: More than 80% of tasks are completed.
- Good - Blue: 40-80% of tasks are completed.
- Needs Attention - Yellow: 30-40% of tasks are completed.
- Critical - Red: Less than 30% of tasks are completed.
- Project Health Indicator:
- Idle: No activity detected within the selected time frame, indicating no tasks are currently in progress.
- In Progress: The project is actively moving forward, with at least one task in progress.
- At Risk: The project is at risk of delay, flagged when there’s a set end date, only one week remains, and less than 80% of tasks are completed.
- Delayed: The project has missed its deadline, with unfinished tasks still in progress or yet to be started.
- Complete: All tasks are completed before the project’s end date.
Delivery
Based on the methodology type of the project this section displays relevant information about delivery efficiency.
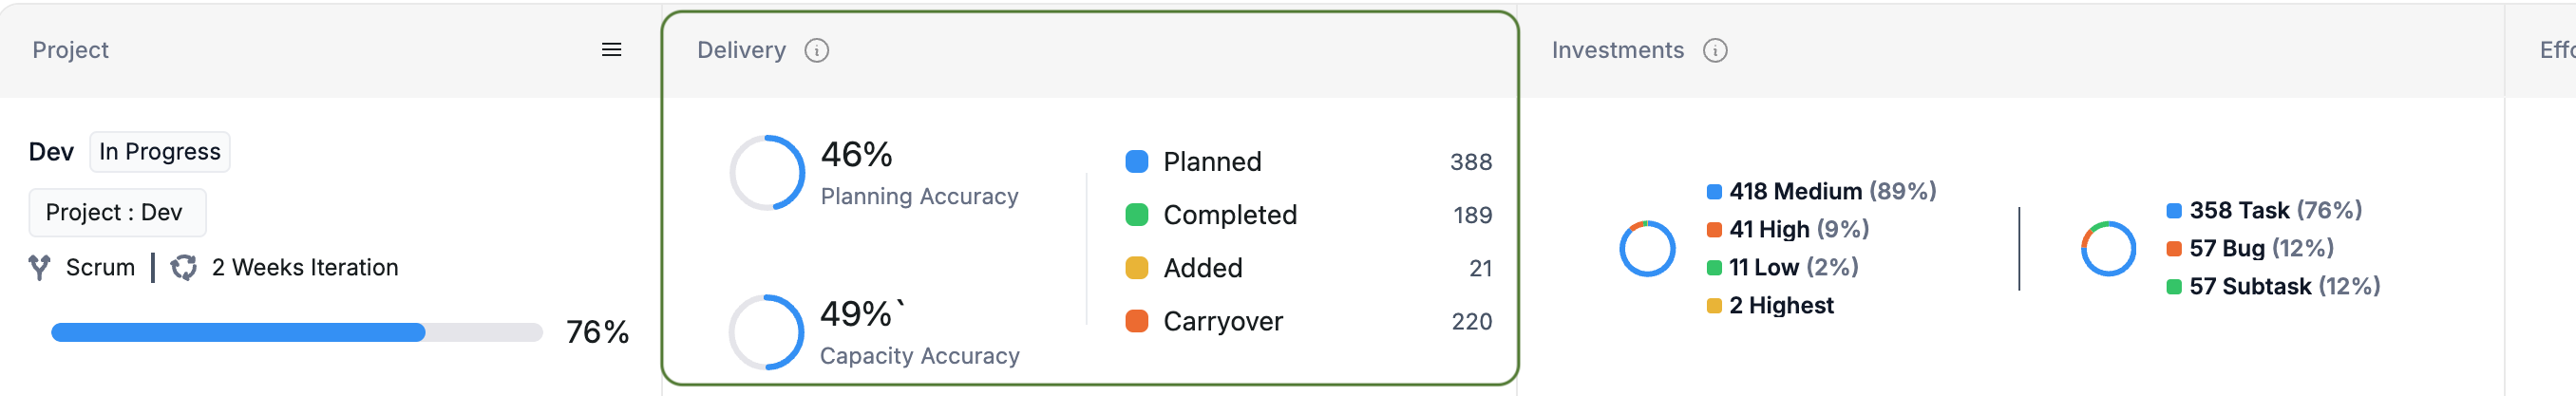
For Scrum Projects, it highlights planning and capacity accuracy by assessing the planned, completed, added, and carried-over tasks across all sprints within the selected date range. These metrics—planned, completed, added, and carried-over—are aggregated to provide a comprehensive view of the project's overall performance.
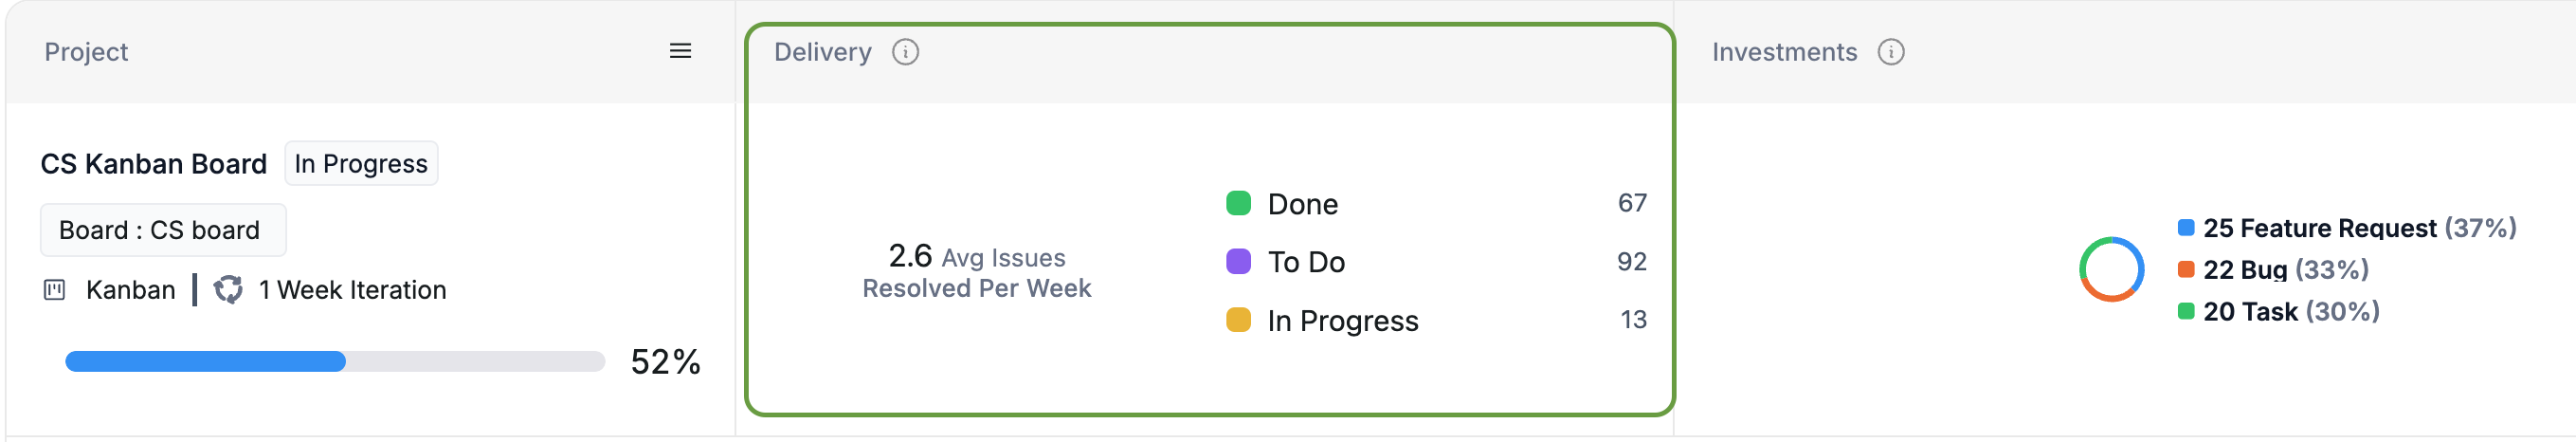
For Kanban Projects, it displays the number of issues or story points resolved each week, averaged over the entire selected date range. This average is calculated by breaking down the Kanban project's delivery into weekly segments. Additionally, it provides a breakdown of tasks based on their workflow status (To Do, In Progress, Done). These metrics reflect the most recent data for the selected period, showing the current count of issues in each workflow status.
Task Priority Breakdown
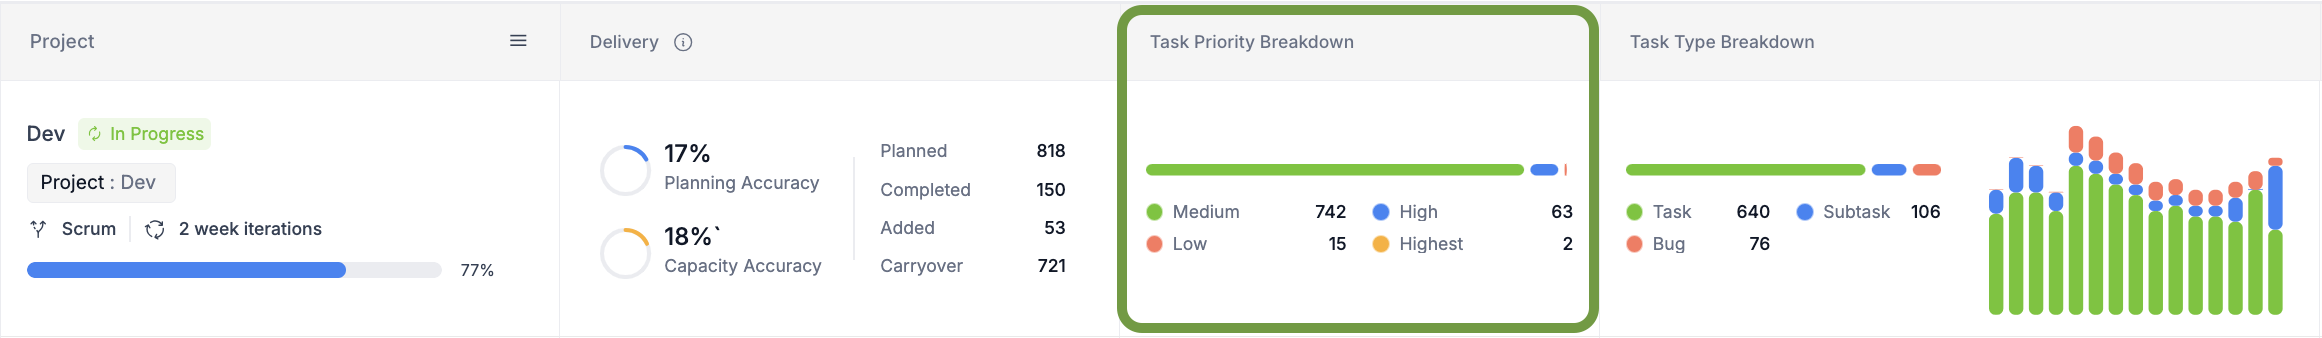
This section provides a clear overview of your team’s task prioritization. It categorizes tasks into four priority levels: Highest, High, Medium, and Low. The layout displays both the percentage distribution and the exact count of completed tasks for each category within a given sprint or week. Only tasks that have been marked as completed are included—excluding those that are in progress, carried over, or incomplete—to provide an accurate measure of priority-based performance.
Task Type Breakdown
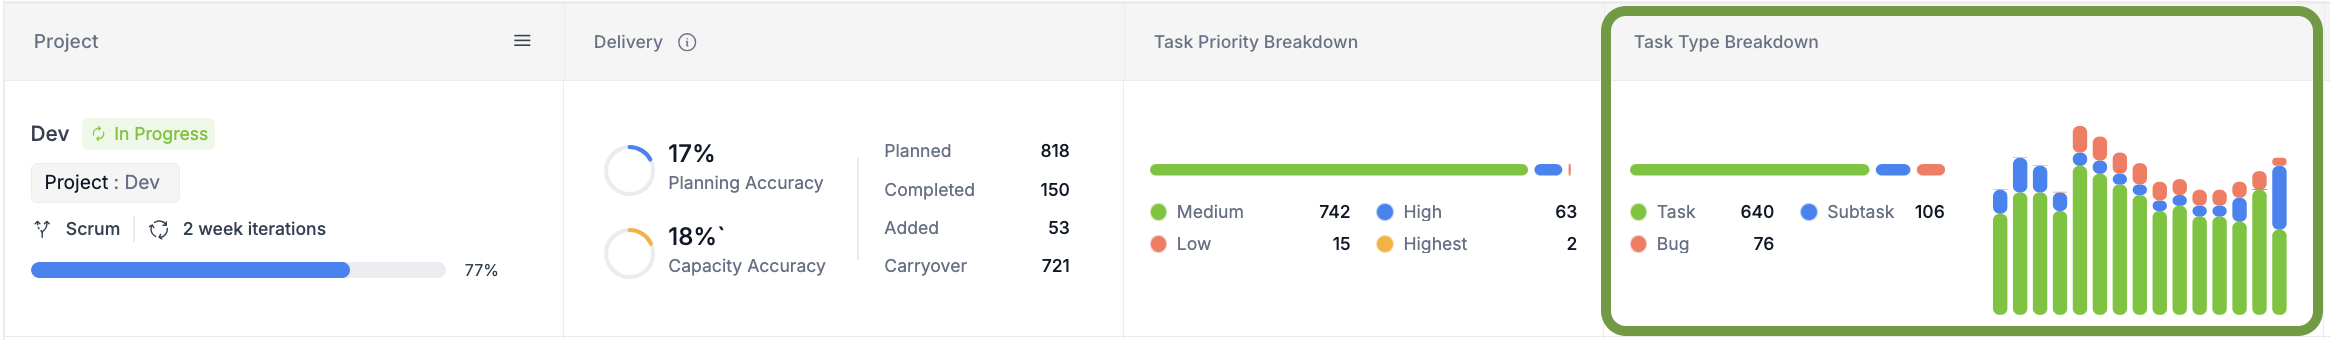
This section delivers a comprehensive breakdown of task types, such as Bug, Task, Epic, etc., with refined visuals and analysis. It presents both the percentage share and the total number of completed tasks per category for a selected sprint or week. The data is derived solely from tasks that have been completed, ensuring clarity and accuracy.
The integrated stacked bar chart offers a sprint-by-sprint trend, allowing you to monitor shifts in task type distribution over time. You can click on any of the sprint here to go to the sprint's detail view.
People Effort
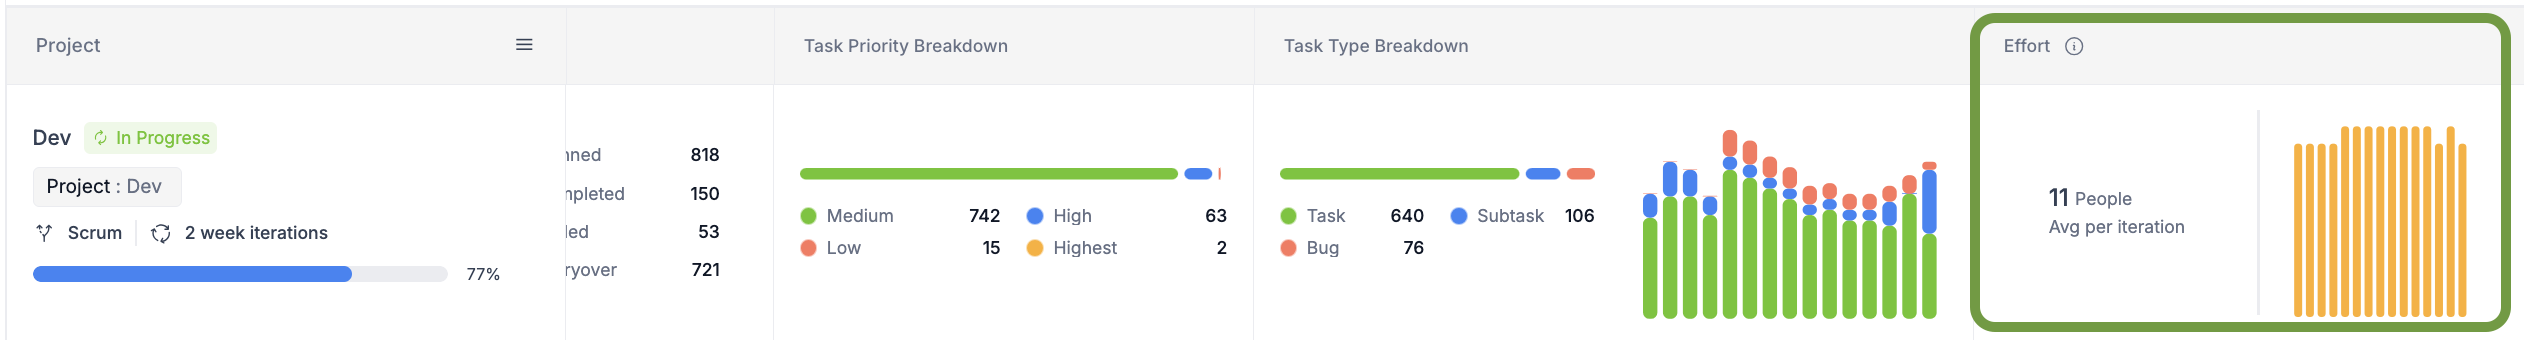
This section provides insights into the level of team involvement in the project. It displays the average no. of people that contributed to this project per sprint or week with the bar chart depicting the number of contributors in recent sprints, allowing you to visualize variations over time. This information is calculated from tasks marked as completed during a specific sprint or week, excluding any in progress, carried-over or incomplete tasks.
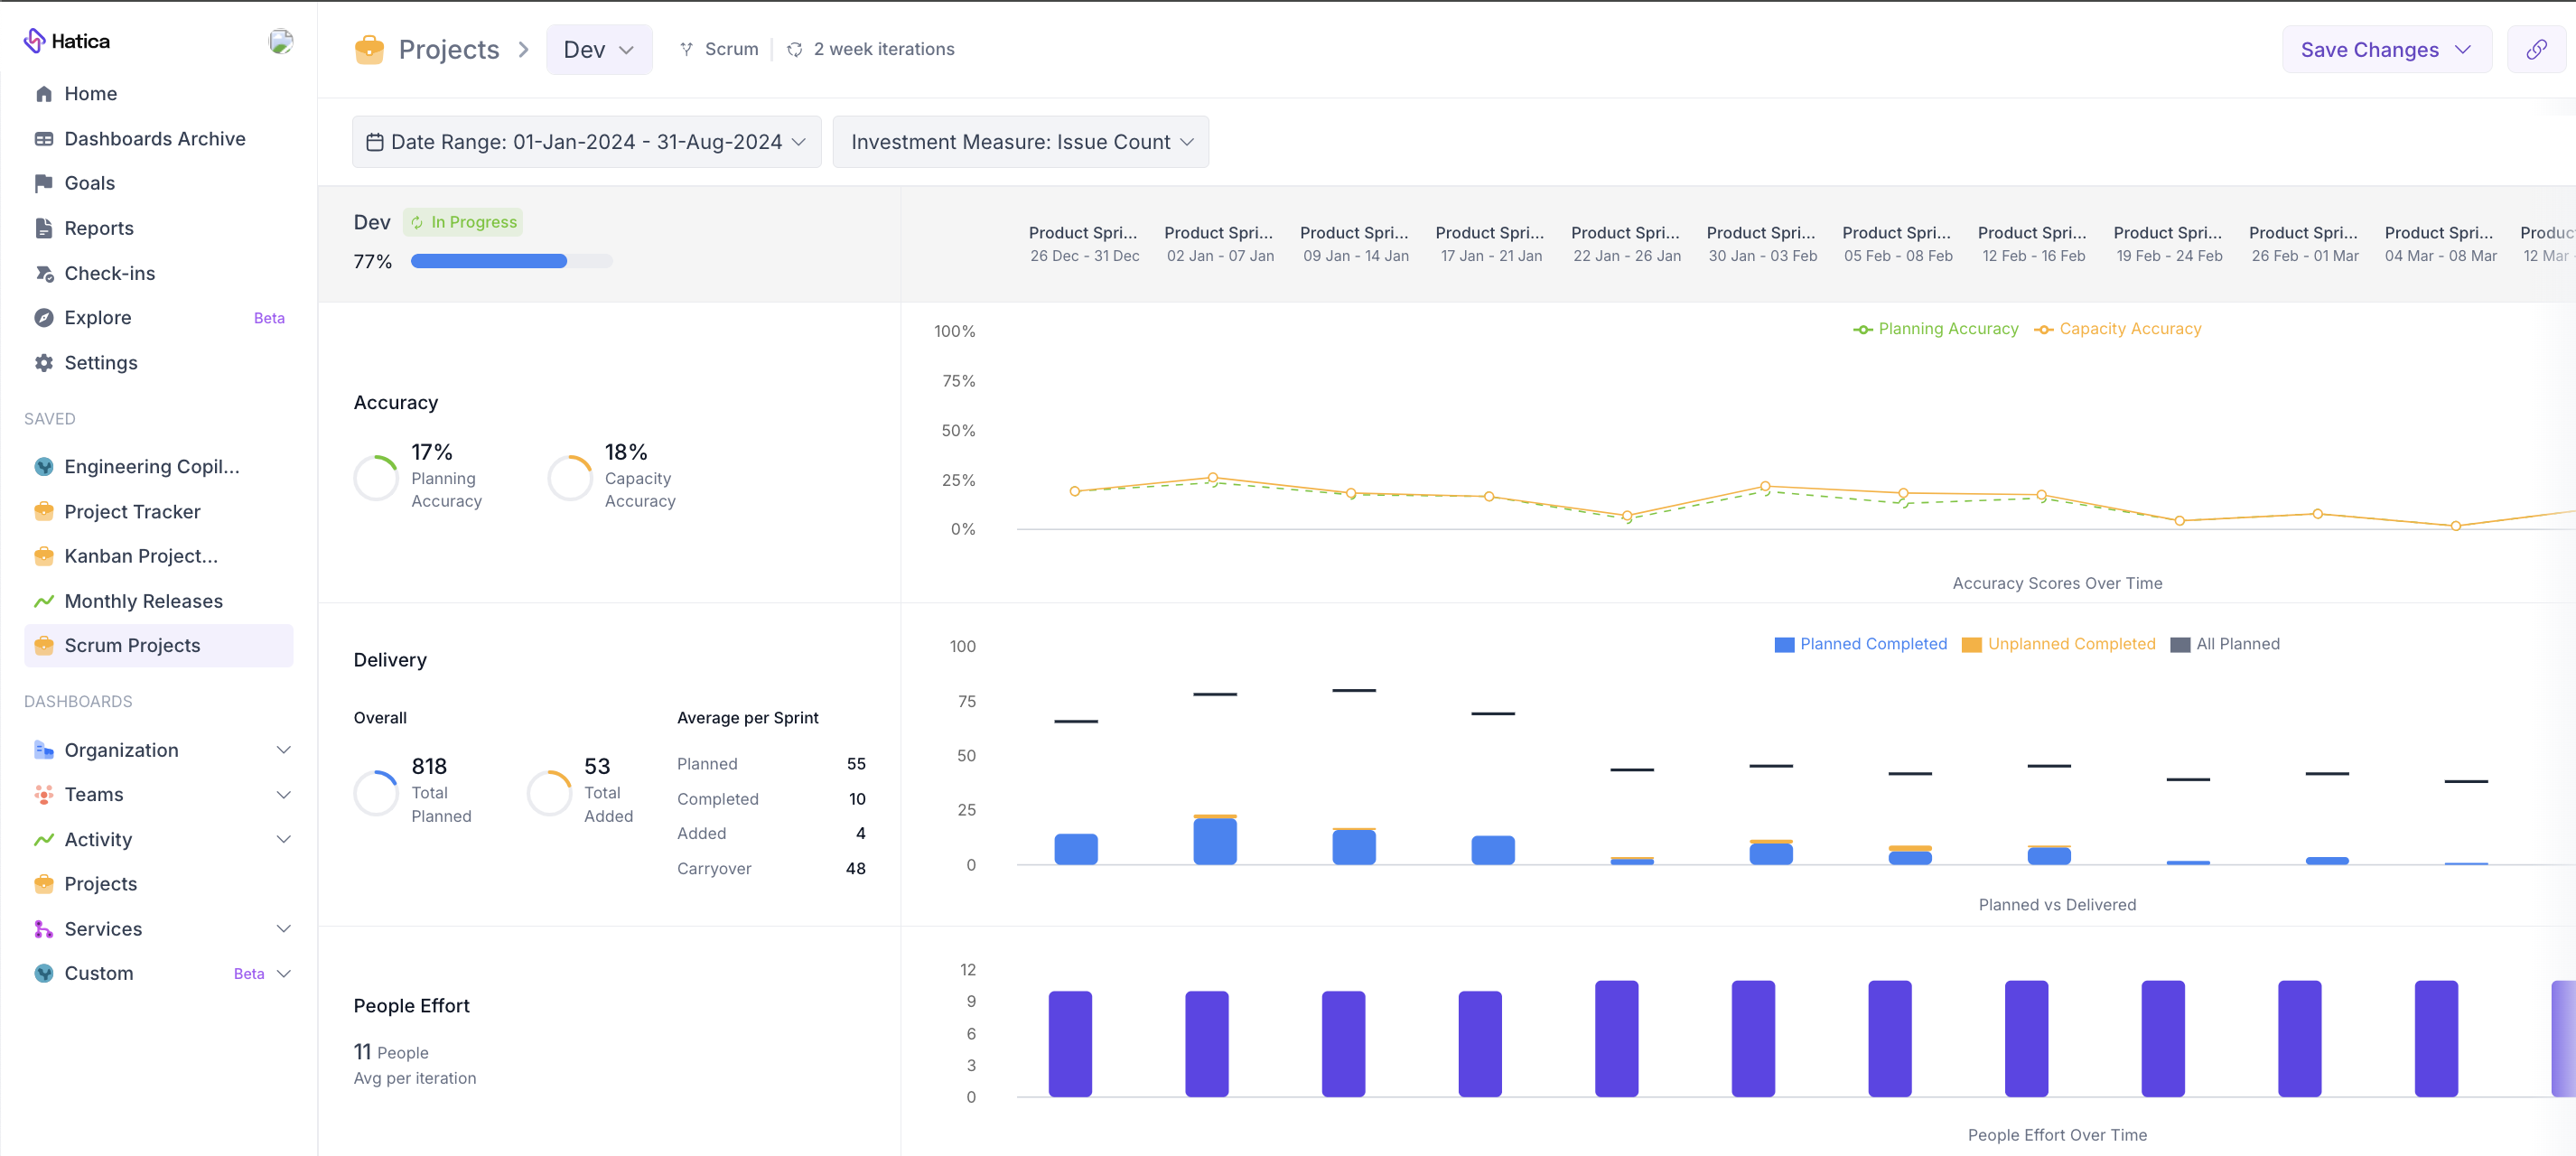
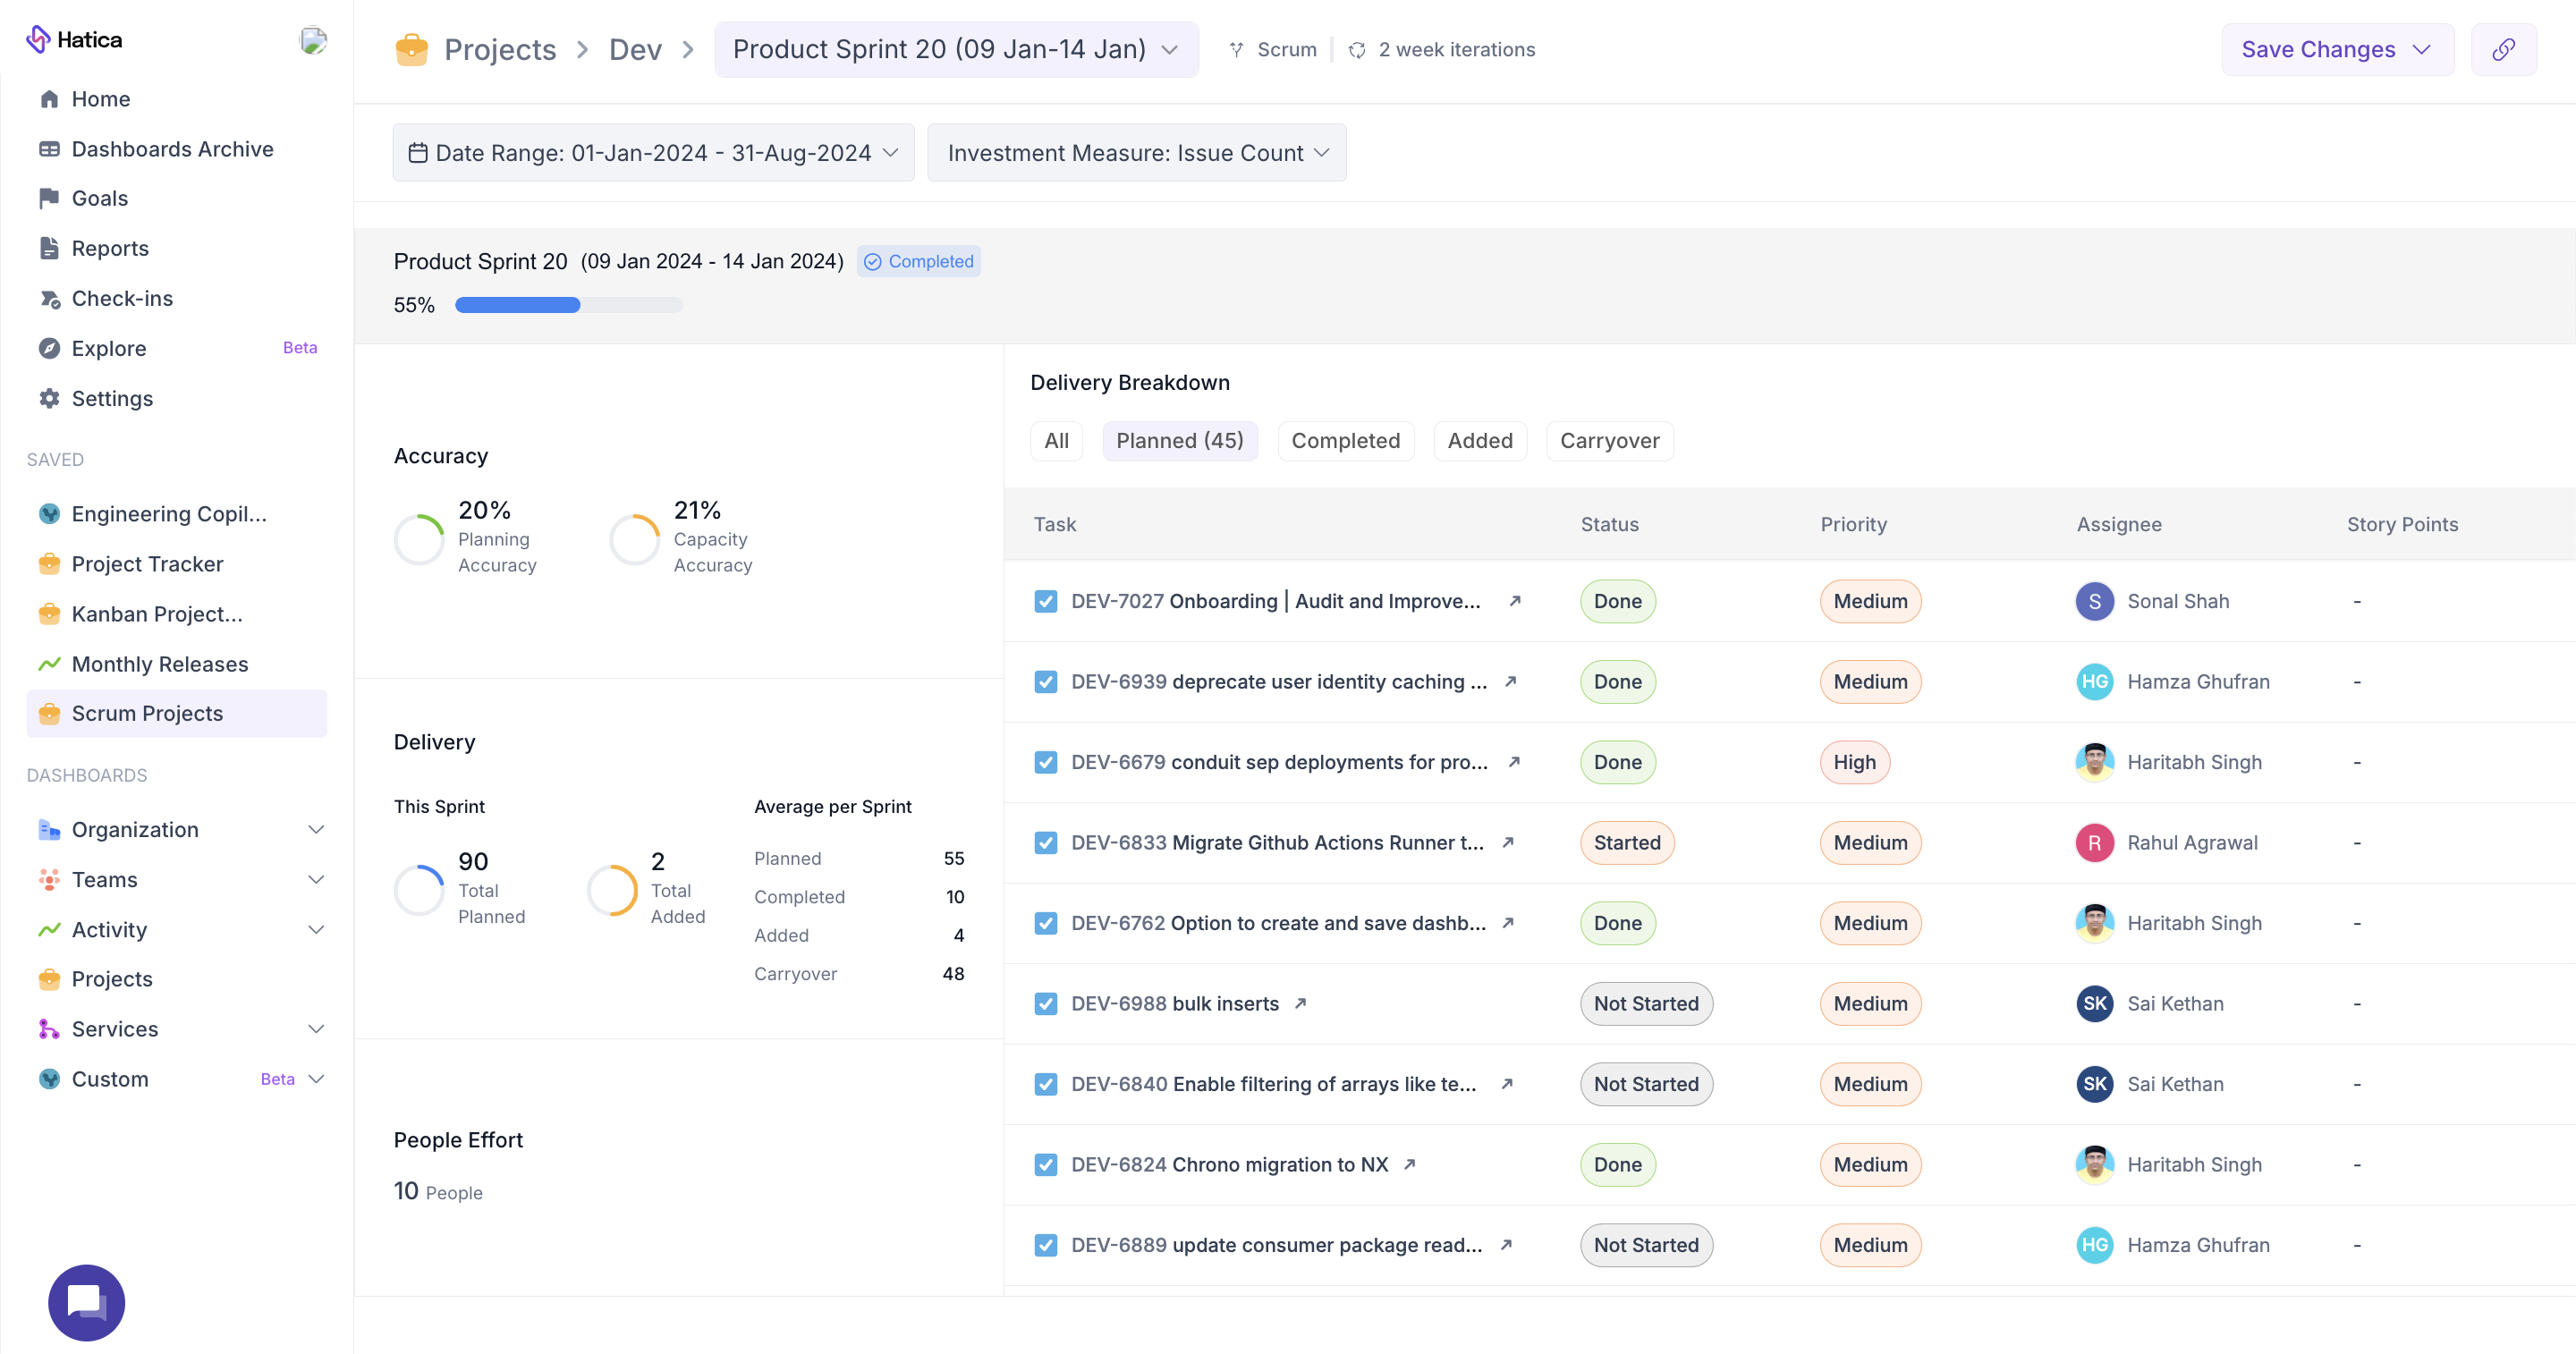
Project Details: Expanded View
Get a detailed look at your project's performance by selecting any project from the list. The Expanded View helps you understand all the important metrics by breaking them down by sprints or weeks, depending on your project's methodology (e.g., Scrum or Kanban).
On the left side, you'll see key totals for each metric, like overall accuracy for Scrum projects. On the right, you’ll find trends that show how these metrics change over time for each sprint or week.
Hovering over any point on the charts will highlight related data across all metrics, giving you a snapshot of that specific time period.
Clicking on a specific sprint or week opens a sprint/week detail view, with detailed performance metrics and associated tasks for that particular sprint/week. This granular view makes it easier to identify trends and make informed decisions to drive project success.
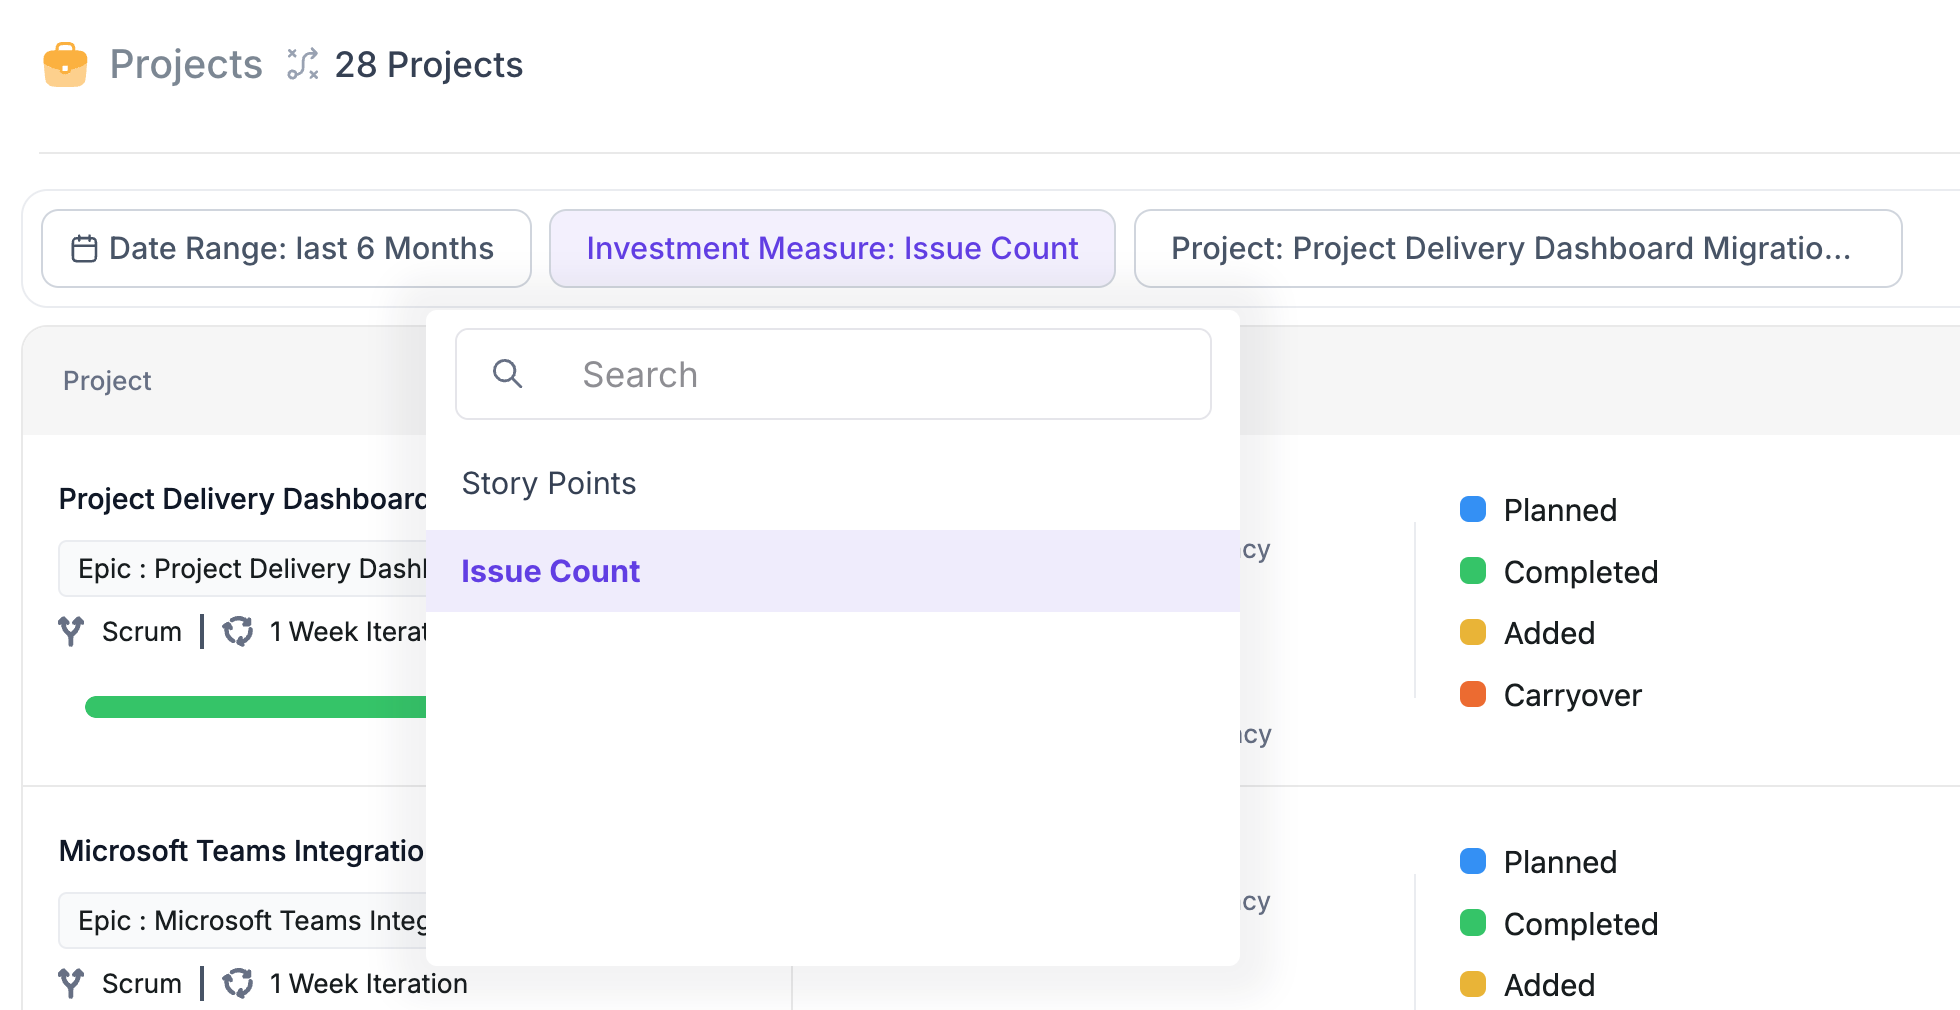
Filters
- Date Range filter: This helps you filter data for the desired duration. When you select a particular date range, you see the sprints/weeks that fall in the selected date range.
- Investment Measure: Measure for the effort spent, either story points or issue count.
Accuracy (Scrum)
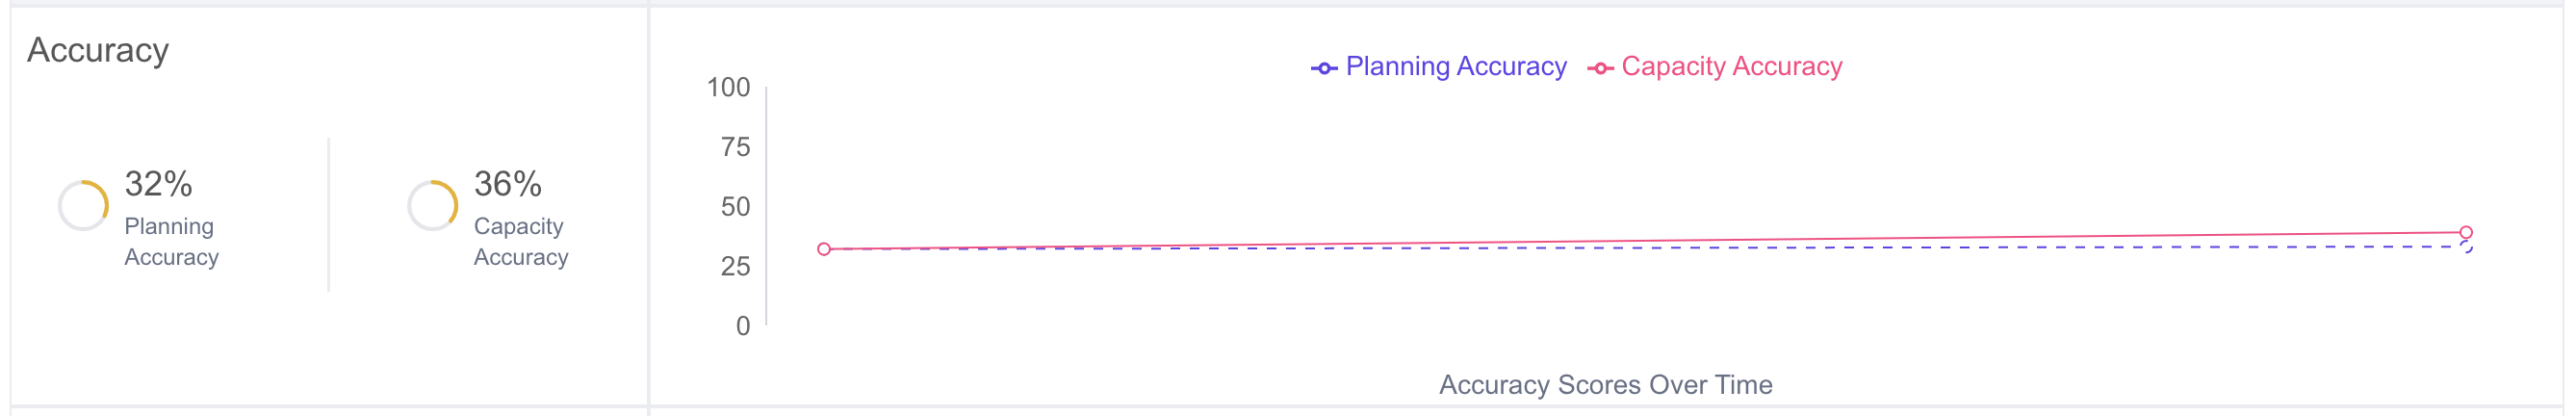
In Scrum, teams work in sprints: they plan a set of tasks, complete them, and then review their performance. This process helps teams improve their planning and execution with each sprint.
To give you insight into how well your sprints are planned and executed, Hatica tracks two main metrics:
- Planning Accuracy
- Capacity Accuracy
The trend chart on the right displays these metrics for each sprint within your selected date range. This chart allows you to see how your planning accuracy and capacity accuracy have changed over time, helping you to understand trends and make adjustments to improve your sprint planning and execution.
Velocity (Kanban)
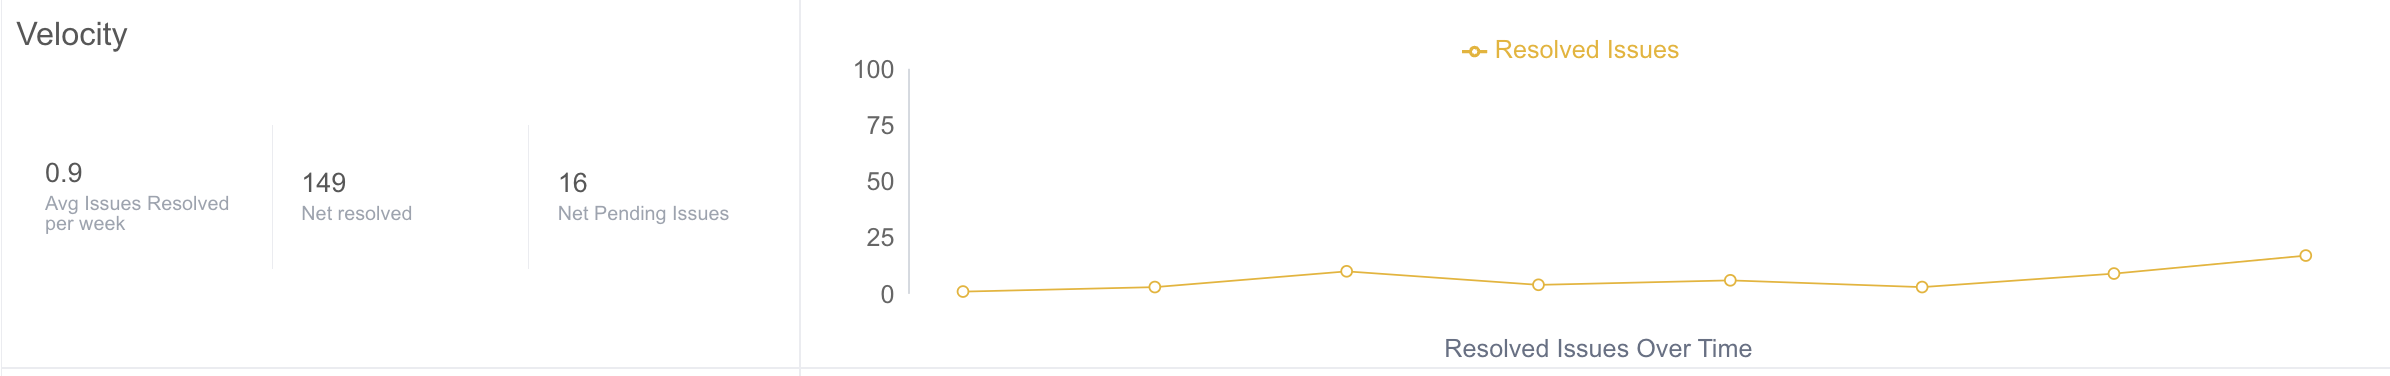
In Kanban, Hatica measures growth in project delivery through "velocity," which tracks the number of tasks completed each week. Unlike Scrum, Kanban doesn’t use sprints or iterations, so metrics like planning or capacity accuracy aren't applicable. Instead, velocity provides a continuous view of your team’s progress.
Velocity is represented by two key metrics:
- Average Issues Resolved per Week
- Net Issues Resolved
The trend chart on the right shows how many tasks your team completes each week. This helps you visualize how your team's performance changes over time and track their progress. With this, you can easily understand how efficiently tasks are being finished and monitor overall progress.
Delivery (Scrum)
This displays an in-depth look at the tasks managed during sprints for the selected date range, covering how many were added, planned, completed, and carried over. It also compares the number of tasks actually completed (both planned and unplanned) against the number of tasks that were initially planned.
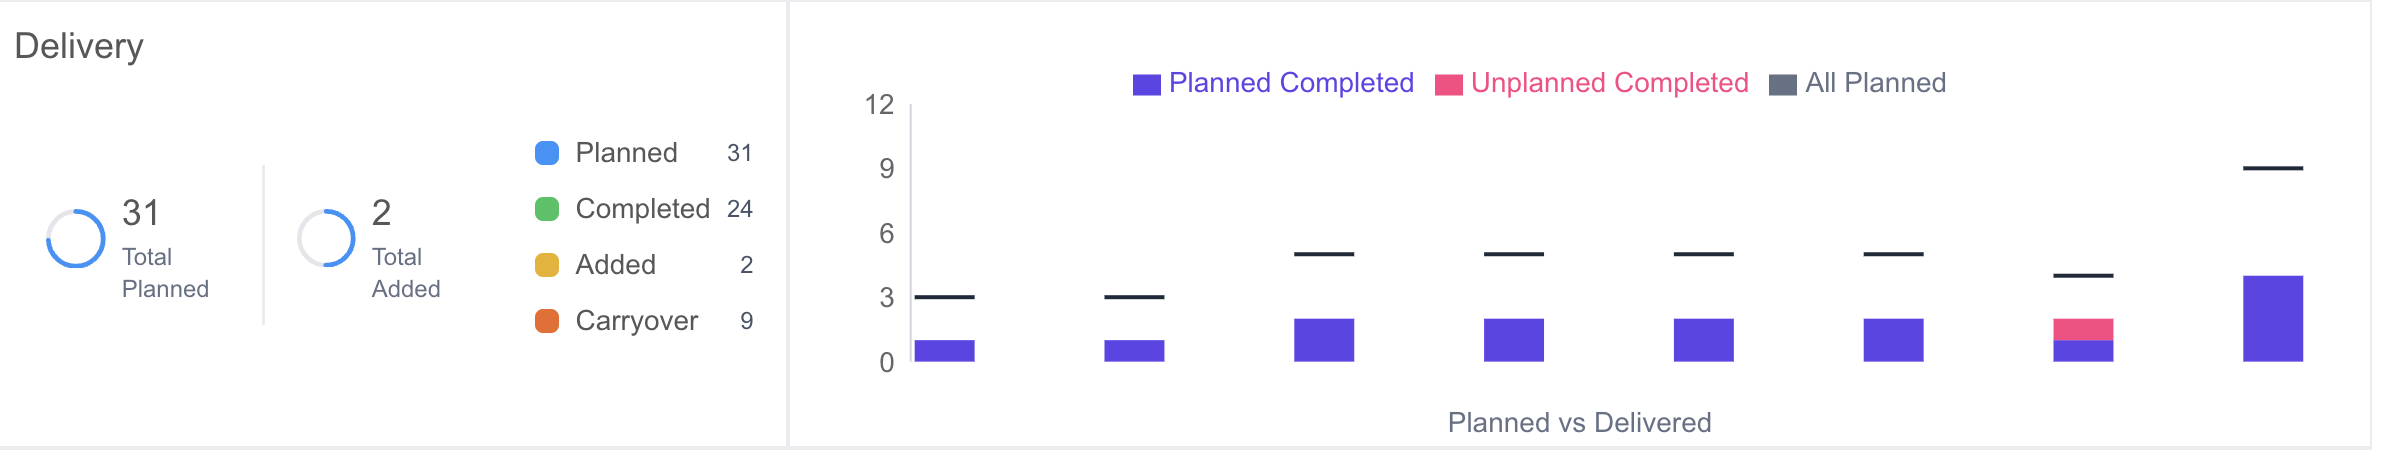
- Total Planned
- Total Added
- Average Planned, Completed, Added and Carried Over issues per sprint for the selected time period.
The following stacked bar chart visualizes the number of issues completed (both planned and unplanned) compared to the number of issues that were actually planned for each sprint. The line marker represents the planned number of issues:
- Large Gap Between Line Marker and Stacked Bar: Indicates a significant number of incomplete issues.
- Unplanned Issues Completed Exceeding Line Marker: Suggests that more unplanned tasks were completed than planned ones, pointing to potential planning inaccuracies and process gaps.
This chart provides a clear picture of how well the team is meeting its sprint goals and helps identify areas for improvement in the planning and execution process.
Delivery (Kanban)
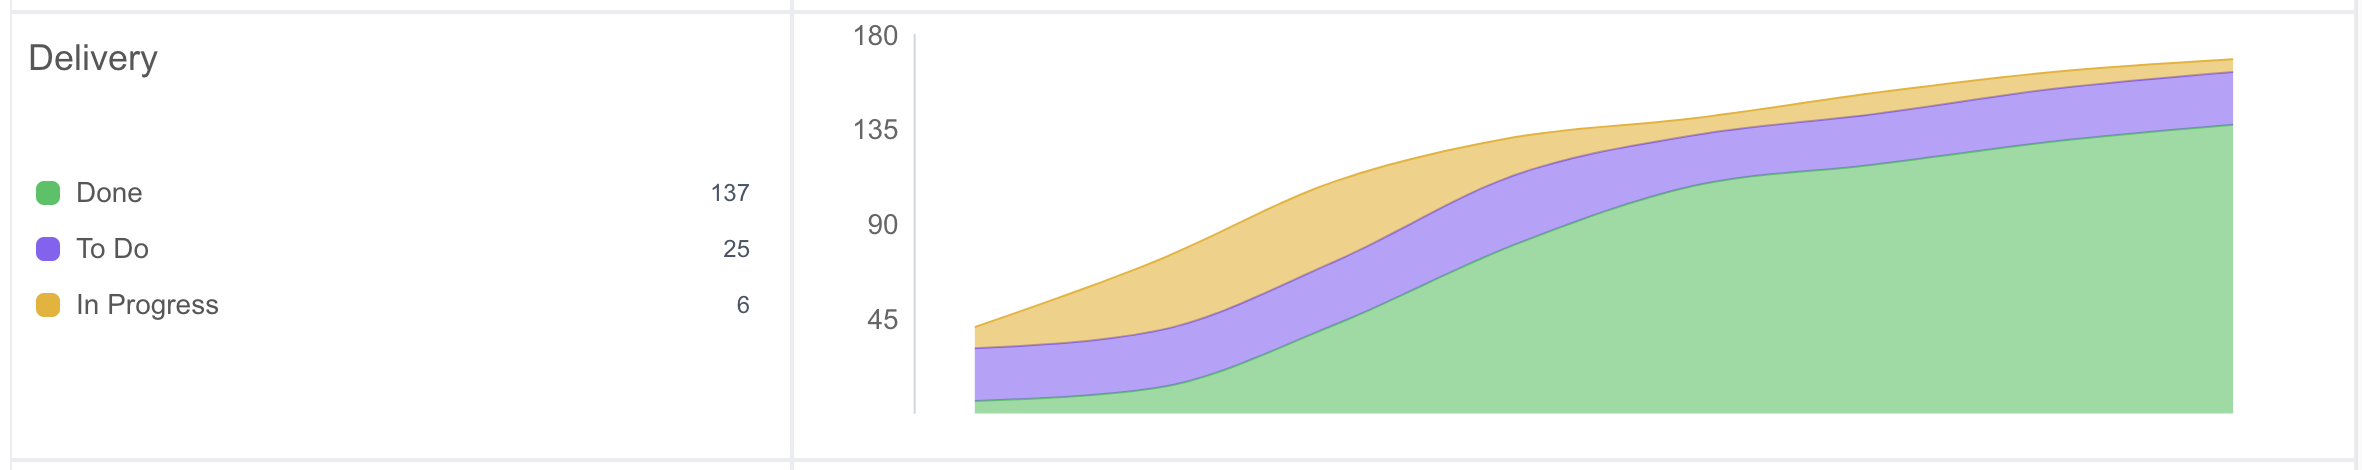
For Kanban Projects, the Delivery section provides a comprehensive view of your team's workflow efficiency and task progression using a Cumulative Flow Diagram (CFD). The CFD visually represents the total issues or story points in each workflow state—To Do, In Progress, and Done—over time, utilizing distinct swim lanes sourced from connected boards. This visualization offers a clear snapshot of the project's progress and status at a glance.
Because Kanban follows a continuous flow methodology, the To Do, In Progress, and Done categories encompass all tasks up to the end date of the selected iteration. Here's how each category is defined and calculated:
- Backlog: Tasks that remain in the Backlog and have not yet moved to To Do.
- Todo: All tasks that have not yet been started up to the end date of the selected date range.
- In Progress: All tasks actively being worked on during the selected date range.
- Done: Tasks completed both during the specific week and any tasks finished earlier within the selected date range.
The Cumulative Flow Diagram not only shows the distribution of tasks across different states but also highlights the flow and accumulation over time. By visualizing these cumulative counts, the CFD helps you track how work flows through each stage, spot areas where tasks are piling up, and make informed decisions to optimize your processes. This comprehensive visibility into task states ensures that your team can maintain a balanced workload and continuously improve delivery efficiency.
Task Priority Breakdown
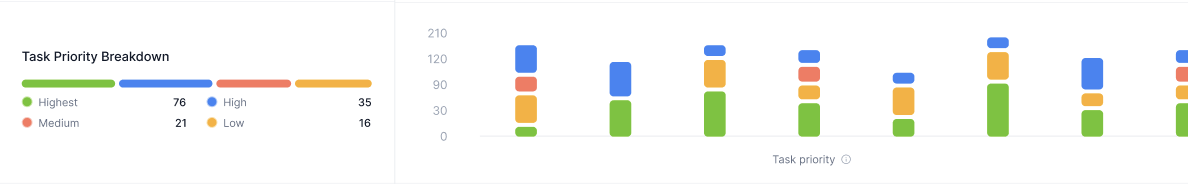
The Task Priority Breakdown section provides insights into how work is distributed based on priority levels across sprints or weeks. This visualization helps teams analyze how much of their completed work falls under each priority category, ensuring that high-impact and critical tasks receive the necessary focus. The stacked bar chart offers a sprint-by-sprint or week-by-week trend, allowing users to monitor shifts in task prioritization over time.
By identifying patterns in priority distribution, teams can assess whether they are allocating their efforts effectively and making the necessary adjustments to maintain a balanced workload.
Task Type Breakdown
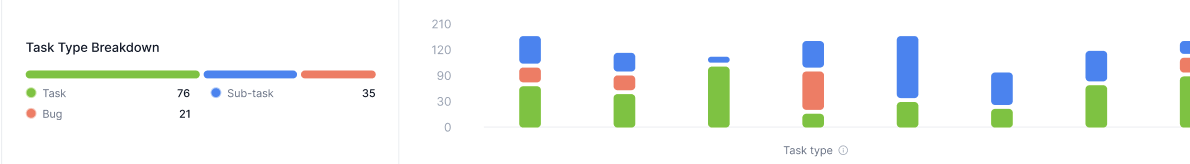
The Task Type Breakdown section classifies completed tasks based on their type, such as:
- Task
- Sub-Task
- Bug
This breakdown provides visibility into the nature of work being completed, helping teams evaluate whether they are spending the right proportion of their effort on development, bug fixes, or other types of work.
The stacked bar chart visualizes trends across multiple sprints or weeks, allowing users to track changes in task composition over time. Clicking on any sprint or week in this section navigates to the Sprint/Week Detail View, where users can explore specific task details further.
By leveraging this data, teams can refine their planning strategies, balance engineering efforts, and optimize workflows based on the evolving nature of their projects.
People Effort
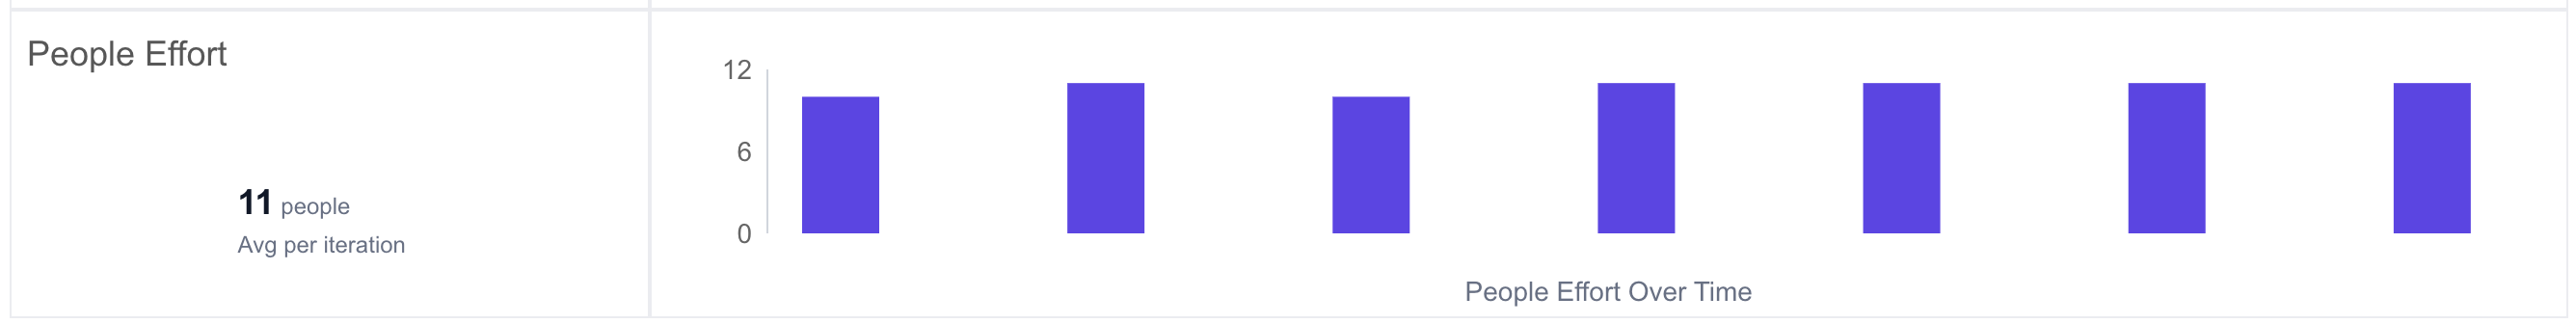
Number of people who completed a story point or issue for the project in each iteration.
Sprint/Iteration Detail View
Clicking on any sprint (for Scrum) or iteration (for Kanban) in the Project Details Page opens a detailed view of that period's performance. This view provides a breakdown of key metrics, including Accuracy, Velocity, Delivery, and Investment Breakdown, along with a detailed list of tasks included in that sprint or iteration.
For Scrum Projects
- Planned Work: Tasks included at the beginning of the sprint.
- Added Work: Mid-sprint tasks introduced after planning.
- Completed Work: Tasks finished within the sprint.
- Carried Over Work: Tasks that remain incomplete at the end of the sprint.
For Kanban Projects
- Backlog: Tasks that remain in the Backlog and have not yet moved to To Do.
- To Do: All the Tasks on the board with the To Do Status.
- In Progress: All Tasks on the board that are in the In Progress status on the last day of the selected week, regardless of when they were moved to In Progress.
- Done: All Tasks on the board that are in the Done status on the last day of the selected week, cumulated from all previous weeks within the selected date range.
- Done This Week: Tasks that were moved to Done at any point during the selected week.
- Started This Week: Tasks that were moved to In Progress at any point during the selected week.
This granular breakdown helps you understand precisely which tasks were planned versus added on the fly, how many made it across the finish line, and which ones still need attention. By combining these filters with the summarized metrics (like Planning Accuracy or velocity), you get a comprehensive view of each sprint or iteration, making it easier to spot trends, address bottlenecks, and refine your team’s workflow.
Use Cases
- Understand the sprint on sprint or week on week velocity for the team
- Compare the people contribution to people allocated to the project
- See if the Planning accuracy is >80%, which is an indicator of proper planning, or is it lower than 60%, which is an indicator of poor planning
- Review the Capacity accuracy to check if the bandwidth of the team is closer to what was planned or does the team have more/lesser capacity that assumed during planning
- Track the planned vs added metrics to see how many unplanned items are being added after the sprint/cycle has commenced
Insights
Use this dashboard to get insights into the following
- Are the task planned up to the available capacity?
- What is the ratio of planned & unplanned tasks?
- Is the team’s planning inline with their execution?
- Where is the team investing?
- What is the average people contribution per sprint/cycle?
FAQs
Why are there more sprints showing in the Efforts Overview than expected?
In Hatica, projects can be customized with different criteria like task types and labels. This means issues in a project might be spread across several sprint boards. When we gather data for a project, we include all sprints related to those issues. As a result, you might see more sprints in the Efforts Overview than you expected.
Why are project start & end dates configurable and why are these optional?
Some projects are time-bound and hence start & end dates are available, but since not all projects have a fixed start & end schedule, these fields are optional. Note that for projects where an end-date is provided, the project status will change to at-risk or delayed based on the end-date provided.
What is the cycle for a Kanban project?
For Kanban projects, the cycle time is automatically set to 1 week and is not configurable.
How are carried over tasks identified?
Tasks that are in a To-Do or In Progress state at the end of the sprint are marked as carried over tasks.
How is carried over task count aggregated?
Carried over tasks are counted at sprint boundaries, so at the each sprint Hatica identifies the carried over task count for that sprint. If the date range used on the Projects dashboard exceeds sprint boundary and spans multiple sprints, Hatica identifies the carried over task count for each sprint boundary. The sum of carried over tasks across each sprint boundary is the final carried over task count for the given date range.
Note that not all carried over tasks might be included in the subsequent sprint, so it is possible that some carried over tasks are not completed at all.
We use multiple boards on the same Jira project, how to track this in Hatica?
In the Add Project page, select the corresponding board and assign it a Project name to track it separately. Note that it is possible to have overlapping Project definitions i.e. 2 boards being tracked under Project1 and each of the boards also being tracked under 2 different projects.
Why is there a mismatch in task count in Jira vs Hatica?
There are multiple reasons why Hatica task counts might differ from the underlying issue tracking system
- Hatica does not have access to the underlying projects & issues due to the PAT that is configured
- Hatica has not yet synced with the underlying issue tracking system
- Hatica only counts tasks mapped to Hatica users. If a user is not present in Hatica, tasks assigned to the user are not visible in Hatica
How are story points calculated for parent-child tasks across different projects?
If a parent task belongs to one project and its child task belongs to another project, the story points for each task are calculated separately. This avoids double counting and ensures that each project's metrics reflect only the effort specific to that project.