Review Collaboration Dashboard
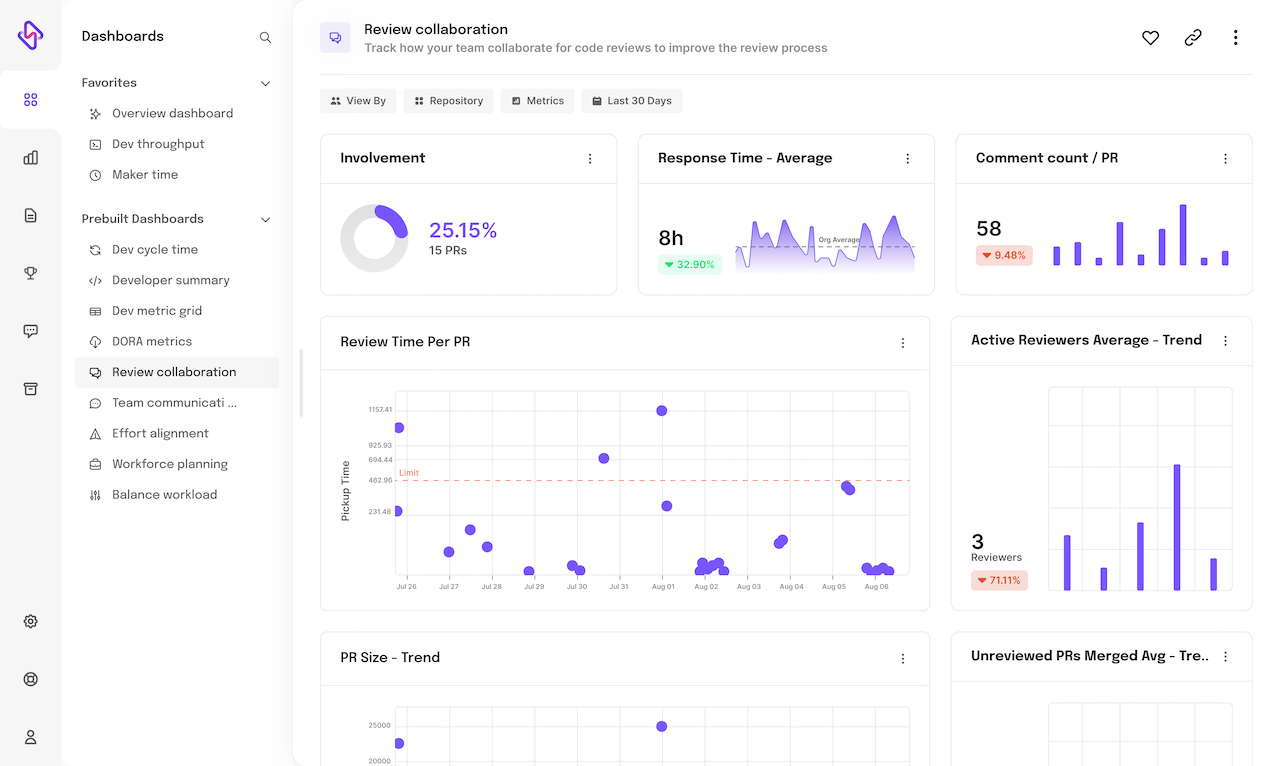
Track how your team collaborate for code reviews to improve the review process - Review Collaboration dashboard showcases the Pull Request collaboration metrics and helps identify inefficiencies.
Video walkthrough
Apps powering this dashboard
- GIT/VCS tools
Available filters
-
Date range picker
-
Repositories
-
View by Teams (managed teams, custom teams) and individuals
Usage
-
Get visibility into collaboration metrics of Pull Requests (PRs)
-
Identify bottlenecks in communication during PR reviews
-
Is collaboration considered a part of maker time?
Available filters
-
Date range picker
-
Repo
-
View by Teams (managed teams, custom teams) and individuals
Further reading
SPACE metrics, a holistic understanding of a developers productivity can help leaders and managers accurately understand both the productivity and well being of their engineers.
-
Here's an introduction to SPACE developer productivity and how it can help engineering teams: https://www.hatica.io/blog/space-developer-productivity/ (opens in a new tab)
-
Here's an in-depth article on the various SPACE developer productivity metrics, their value, and how to use them: https://www.hatica.io/blog/space-developer-productivity-metrics/ (opens in a new tab)
-
Here's a short guide on how engineering and well-being metrics can help you prevent engineer burnout: https://www.hatica.io/blog/can-deep-work-solve-dev-burnout/ (opens in a new tab)