Organization Overview
While specific Hatica modules solve for specific use-cases to improve decision making and problem solving for engineering teams by improving overall work observability, the Org Overview dashboard helps executives and leaders overseeing multiple teams view the most important metrics as recommended by Hatica.
Org Overview aggregates data from all your connected integrations to give you a holistic picture of the performance and productivity pertaining to all the teams set up on Hatica.
Data Sources
- VCS tools power metrics like Cycle Time, Coding Time, Pick-up Time, and Review Time.
- Project Management tools - NA
- CI/CD tools power metrics like Deploy Time, Change Failure Rate and Lead Time.
- Communication tools power metrics like Maker Time.
Metrics
- Cycle Time (opens in a new tab)
- Coding Time (opens in a new tab)
- Pick-up Time (opens in a new tab)
- Review Time (opens in a new tab)
- Deploy Time (opens in a new tab)
- Deployment Frequency (opens in a new tab)
- Lead Time
- Change Failure Rate (opens in a new tab)
- Maker Time (opens in a new tab)
How to infer data
The Org Overview dashboard is an opinionated dashboard. The aforementioned metrics are the most important metrics for an executive or a top-level admin trying to ascertain their org’s overall development velocity, quality and productivity.
The top half of the dashboard gives you a birds-eye view of the key Engineering metrics for the entire organisation2.
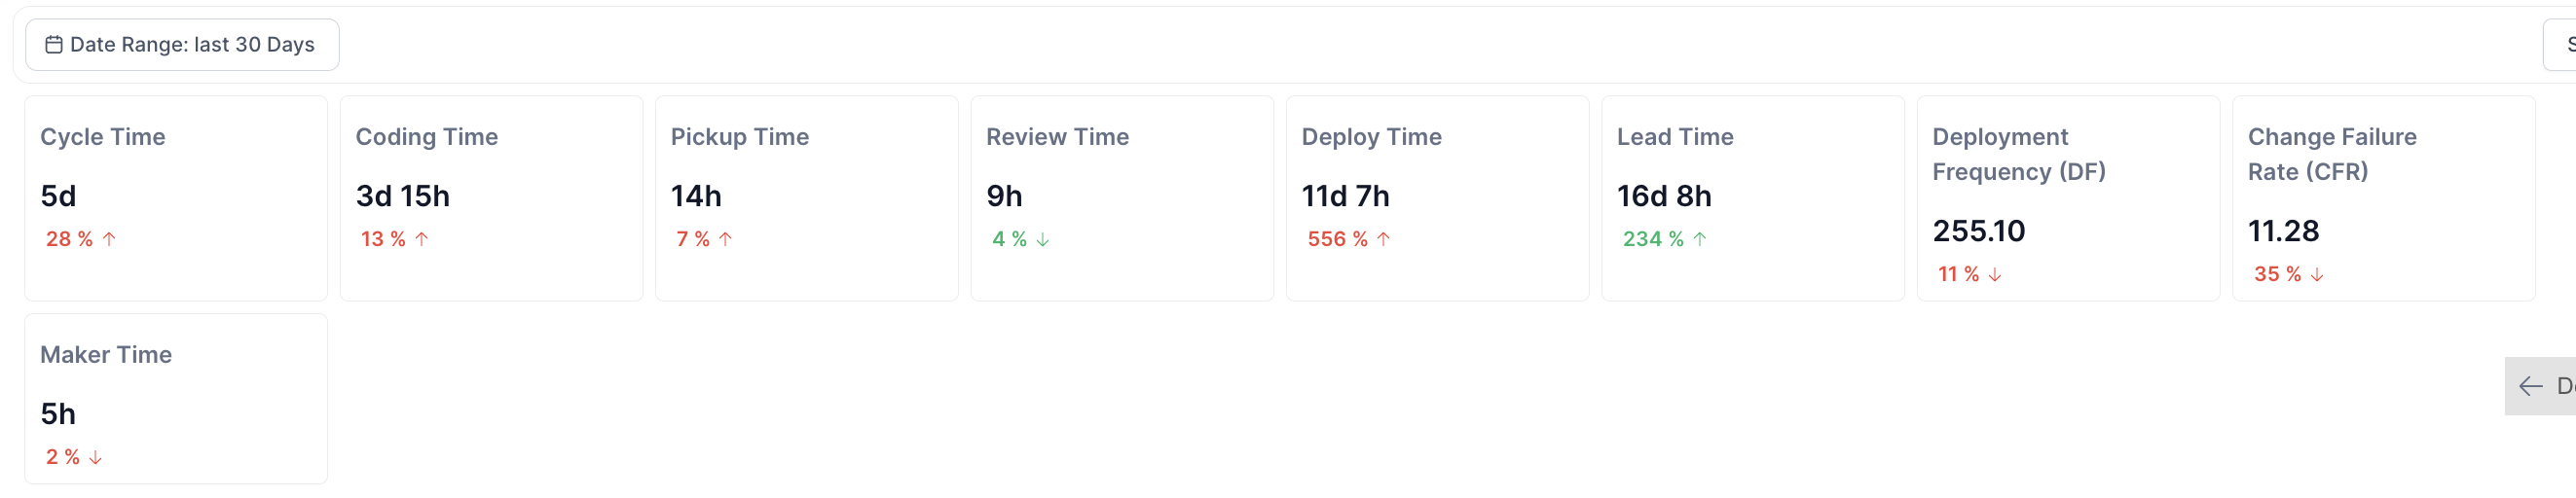
Each card will also give you an idea about how we have fared for that metric in comparison to the last selected period. You’ll see red/green arrows along with the change to give you an idea about a trend that the system observes.
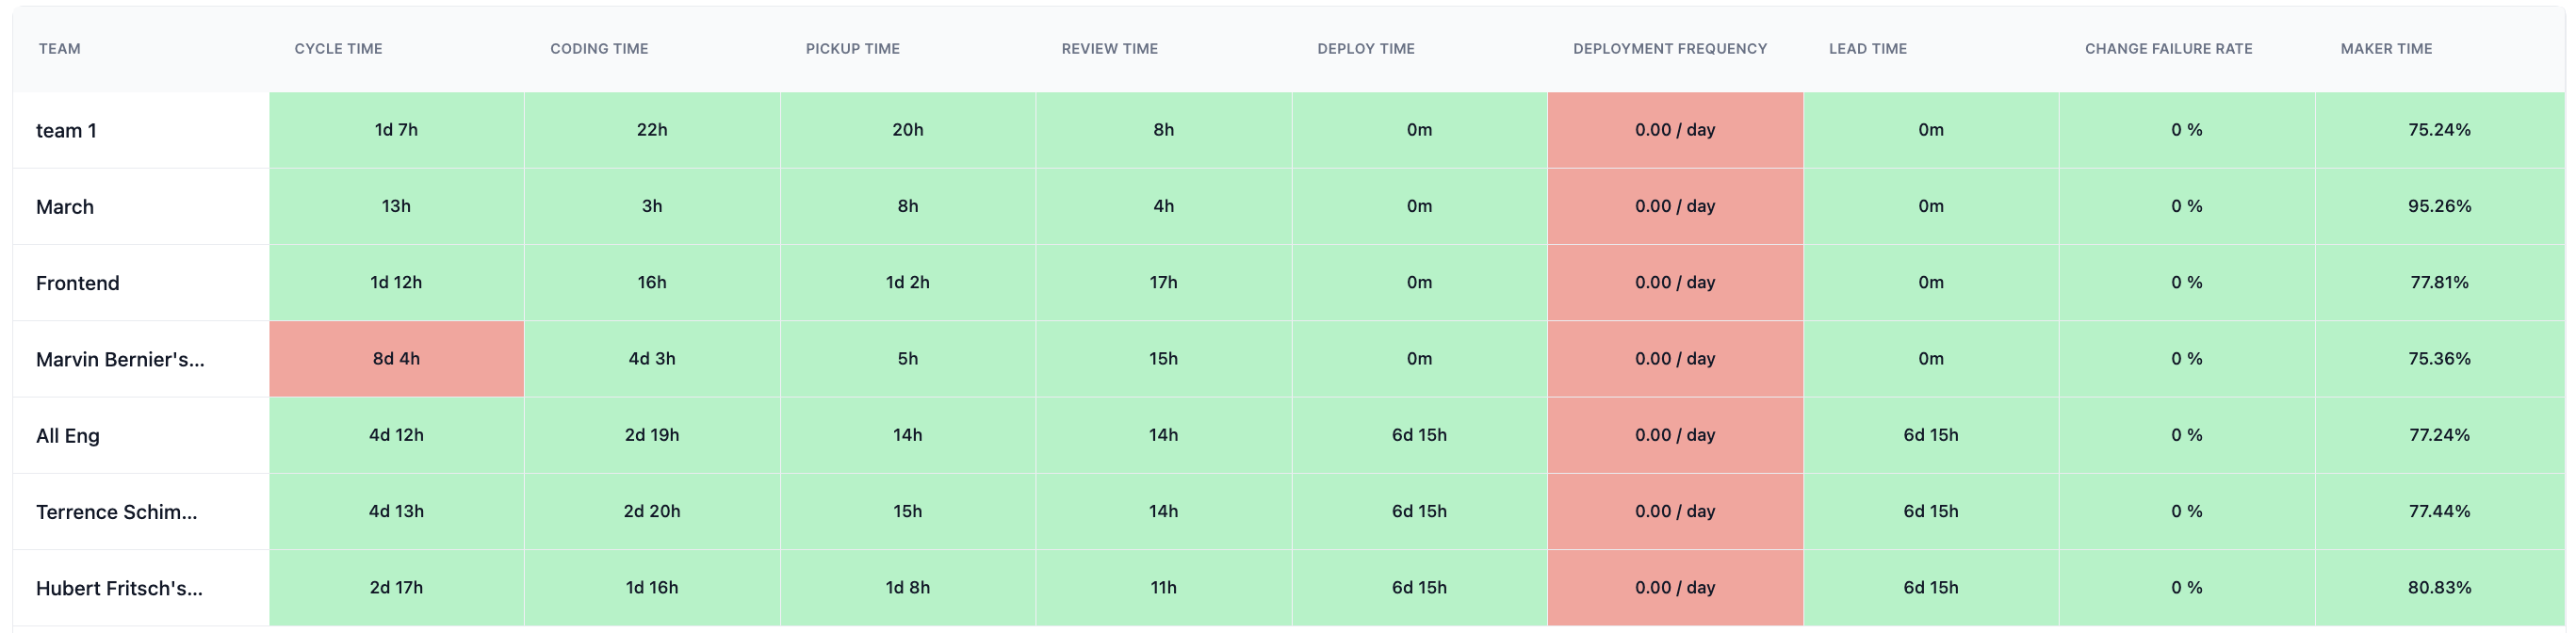
Below the cards, you’ll see a grid-view of all teams to understand how teams compare within the organisation. You’ll observe that each cell in the grid is assigned one of the three traffic-light colours.
Metric selection criteria
The metrics listed in the metrics section (opens in a new tab) have been selected after careful deliberation with industry leaders and personas this dashboard is built for. Hatica believes that these are the most important metrics for any engineering executive interested in an org-level report card with an opinionated view across the aforementioned metrics and guage high-performing teams or teams with room for improvement.
Use cases
- Get a birds-eye view of your org’s performance.
- Head-to-head comparison of teams to understand strong/weak performers.
- Understand which team(s) is leading/lagging one/combination of metrics.