Check-in Analytics
Check-in Analytics enables you to visualize the submissions and data collected from your check-ins.
Visualizing Different Question Types
Check-in Analytics offers a variety of visual representations for different question types, including:
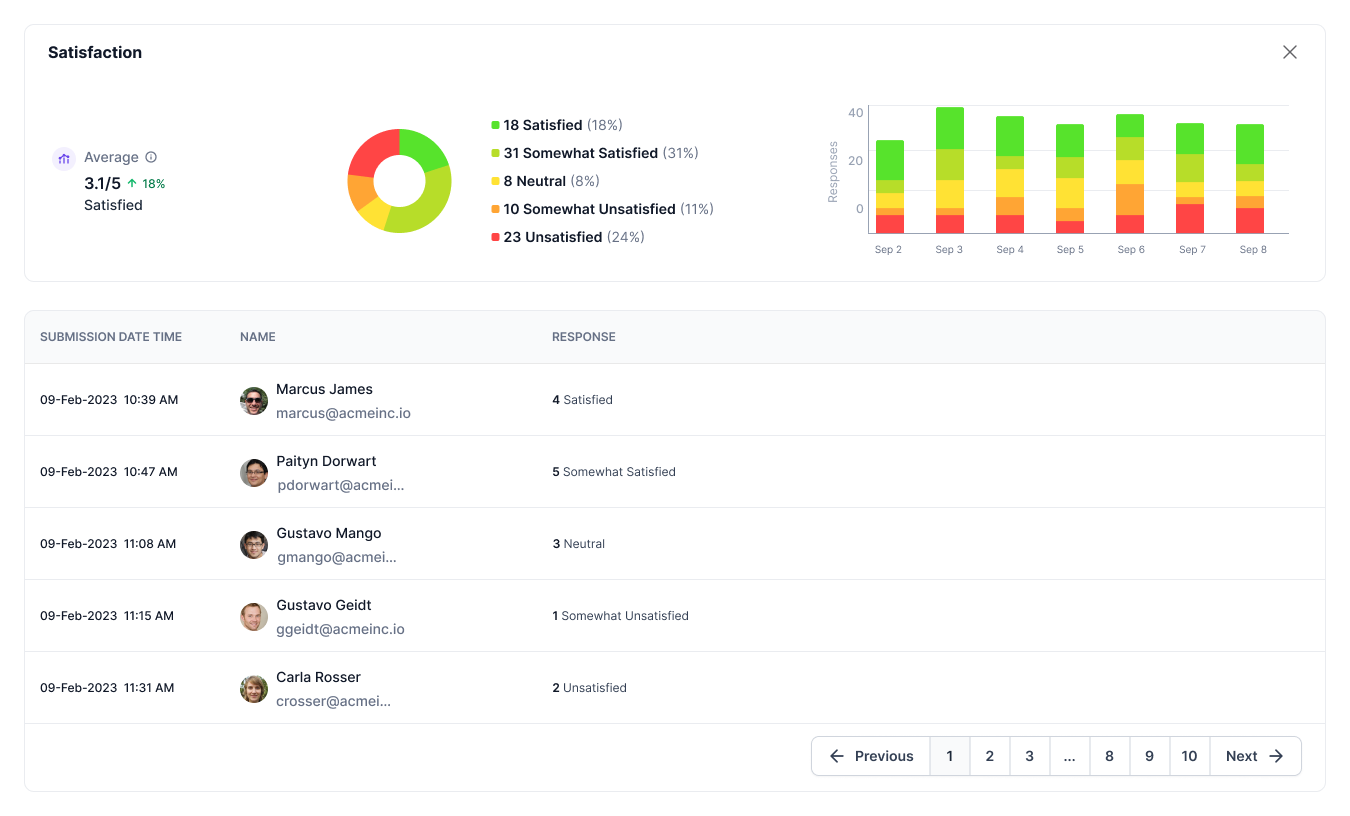
Satisfaction
Assess the overall satisfaction levels of your team members and gain insights into how content they are with specific aspects of their work.
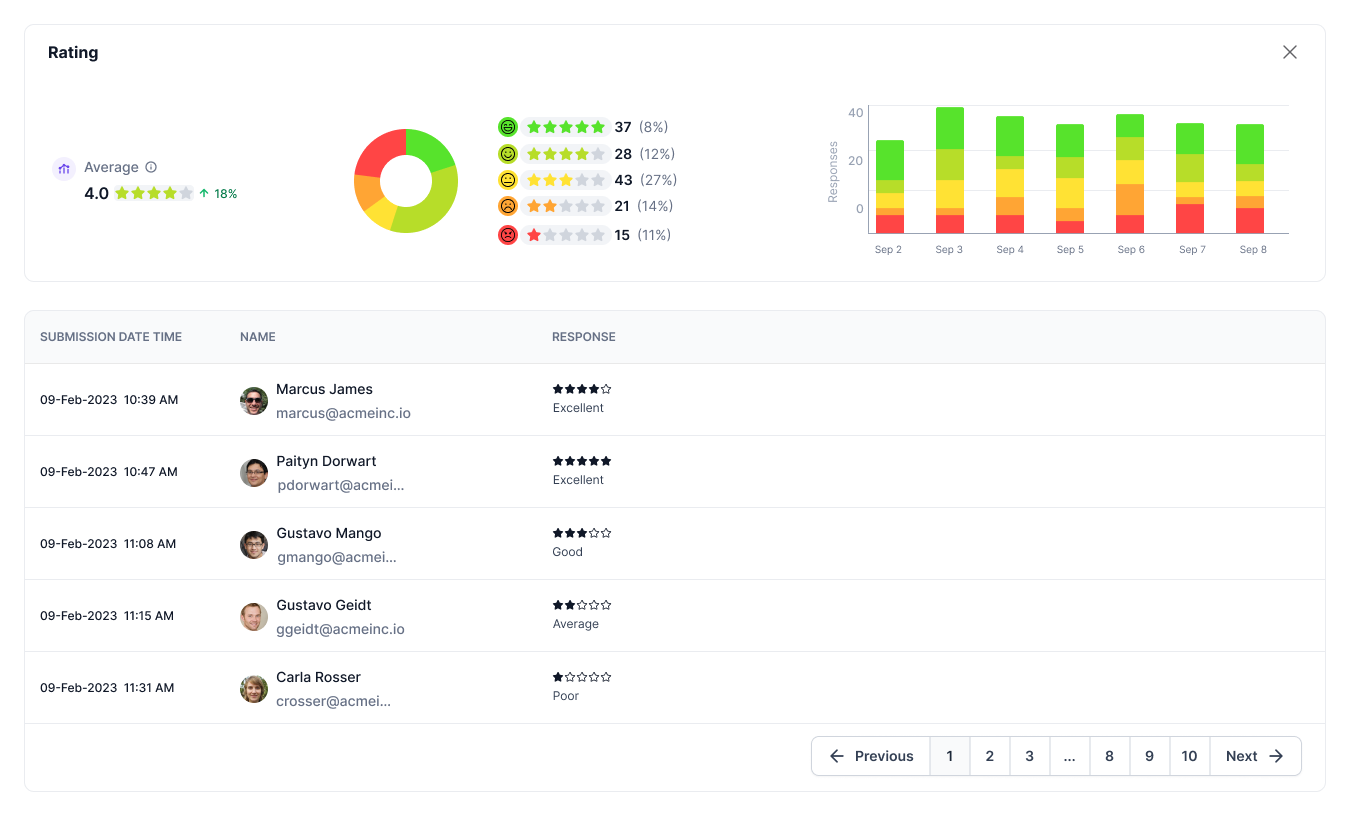
Rating
Visualize responses to your rating-based questions and analyze scores provided by your team members for different criteria. You can also look at the average rating and visualize your team's rating on various aspects of the work and company.
Net Promoter Score (NPS)
Visualize responses from your Net Promoter Score (NPS) survey, gaining insights into your NPS Score and the breakdown of ratings submitted by your team members.
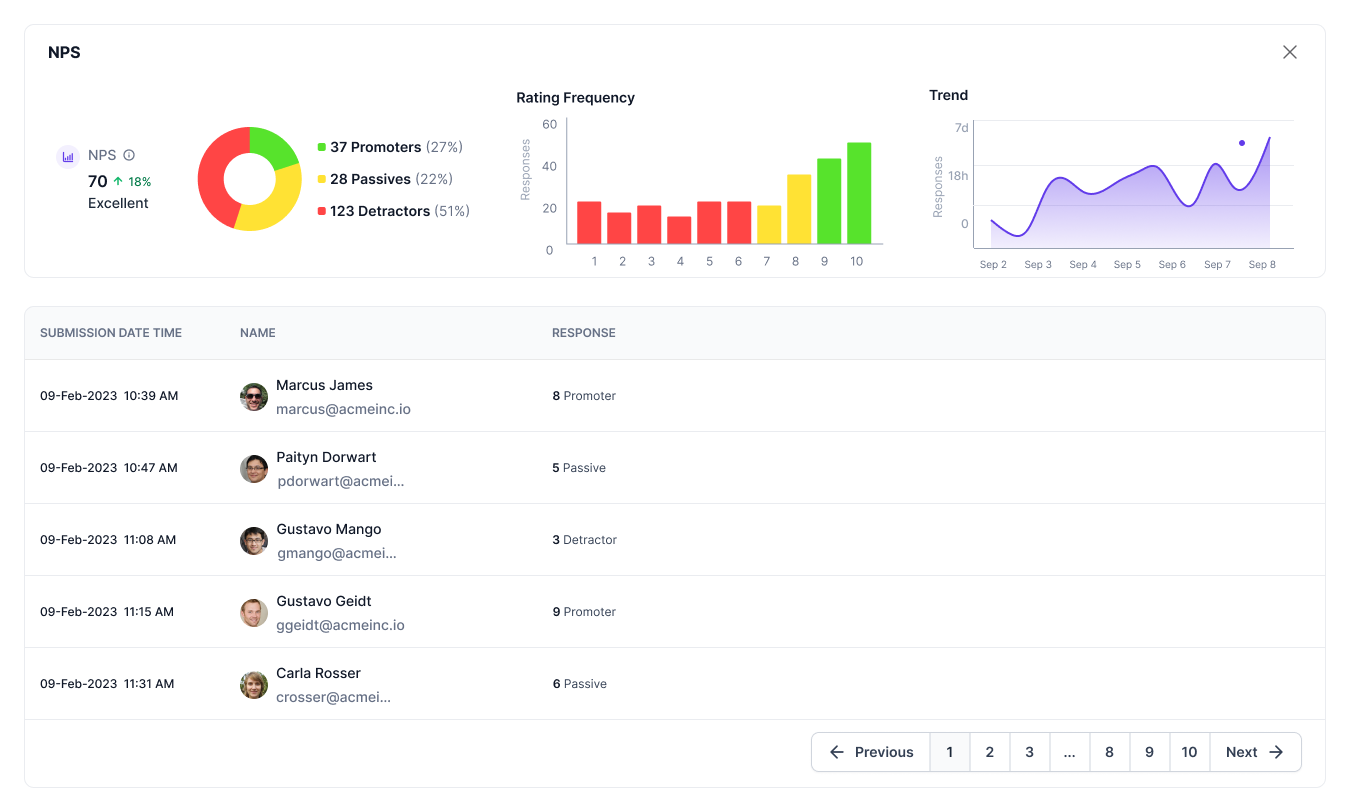
NPS is a widely used metric measuring customer or employee engagement and satisfaction. Participants are grouped into three categories:
- Promoters (9-10): Highly likely to recommend.
- Passives (7-8): Satisfied but not actively promoting.
- Detractors (0-6): Dissatisfied and potentially spreading negative feedback.
NPS is calculated by subtracting the percentage of Detractors from the percentage of Promoters.
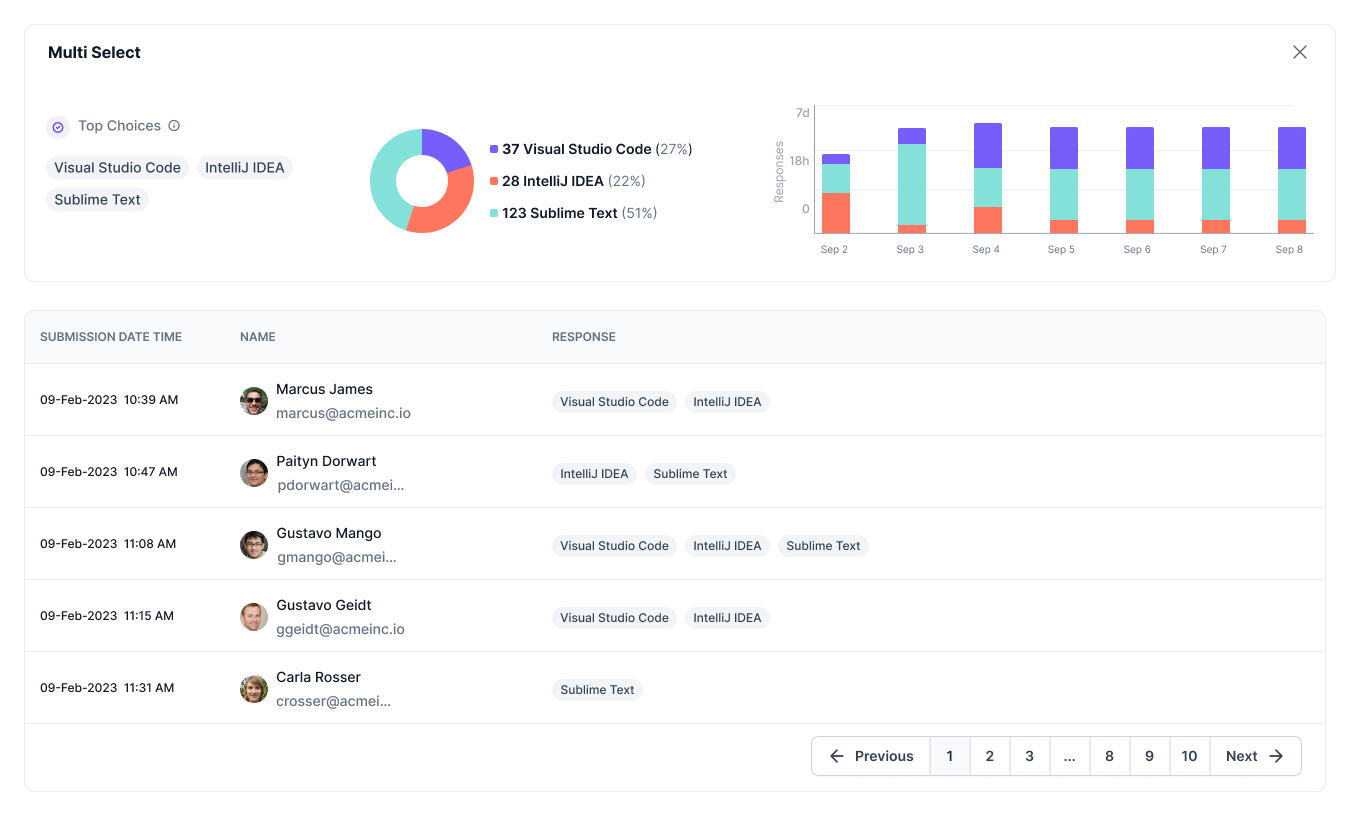
Multiple Choice
Visualize responses from multiple-choice survey questions, gaining insights into response distribution and identifying top choices among them. Understand which options are most frequently selected by survey participants.
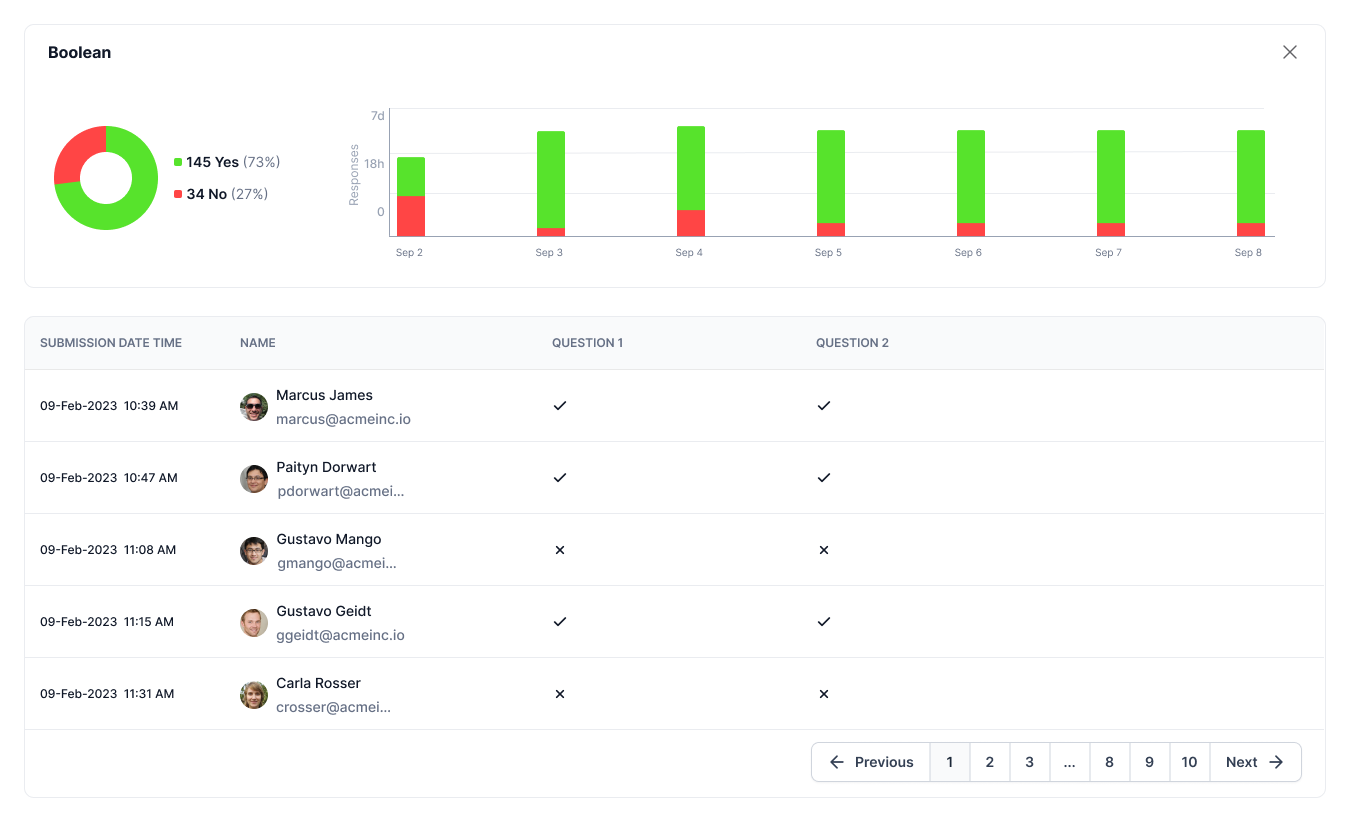
Boolean
Visualize Boolean survey responses to identify common responses and understand response distribution.
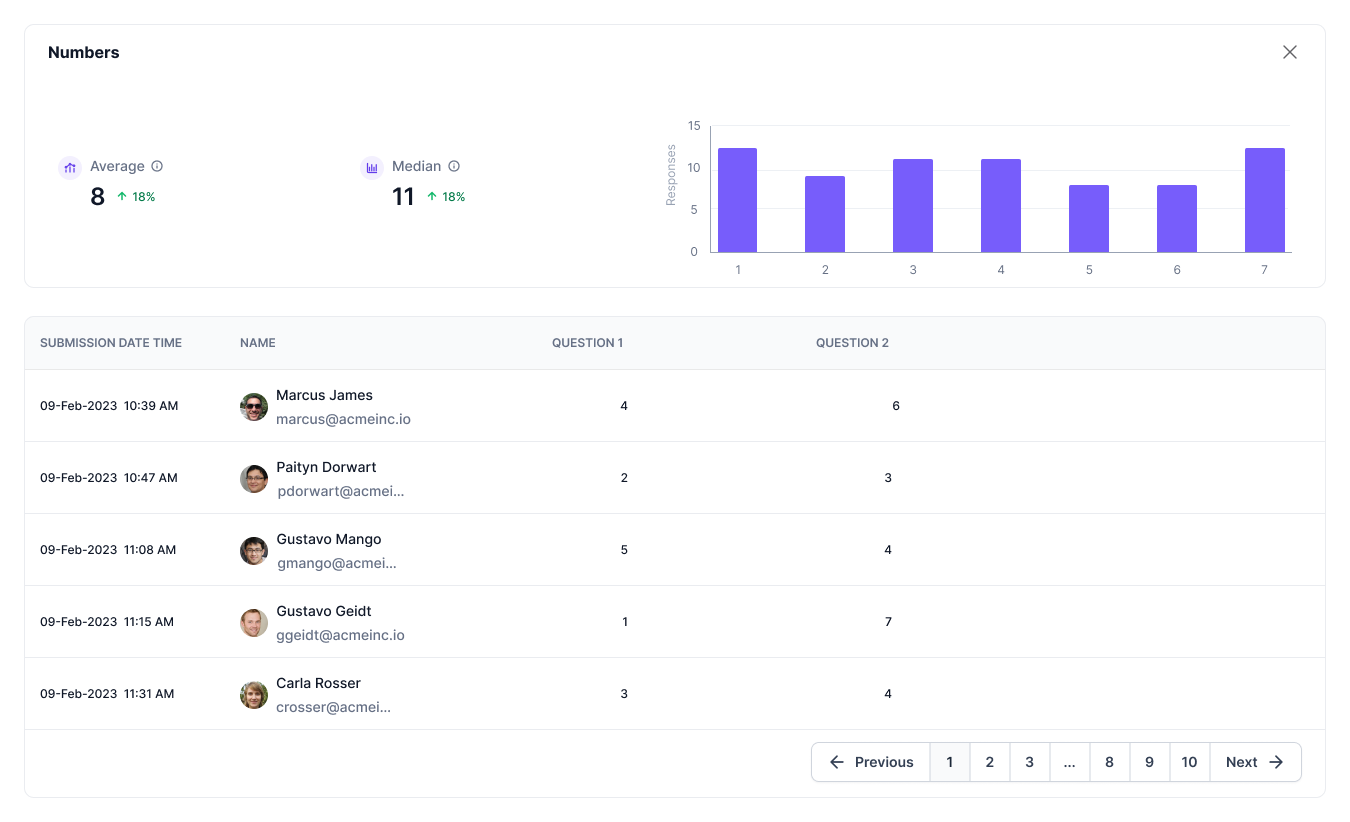
Numbers
Visualize responses to numeric questions where your team provides numerical inputs. View the Average and Median of the numeric responses.
- Average: The sum of all values divided by the number of values. It measures the central tendency of a data set.
- Median: The middle number in a set of numbers arranged from smallest to largest. If there are two middle numbers, the median is their average. The median is a useful measure of central tendency unaffected by outliers, which can skew the mean (average) of a dataset. The median is also suitable for non-normally distributed data.
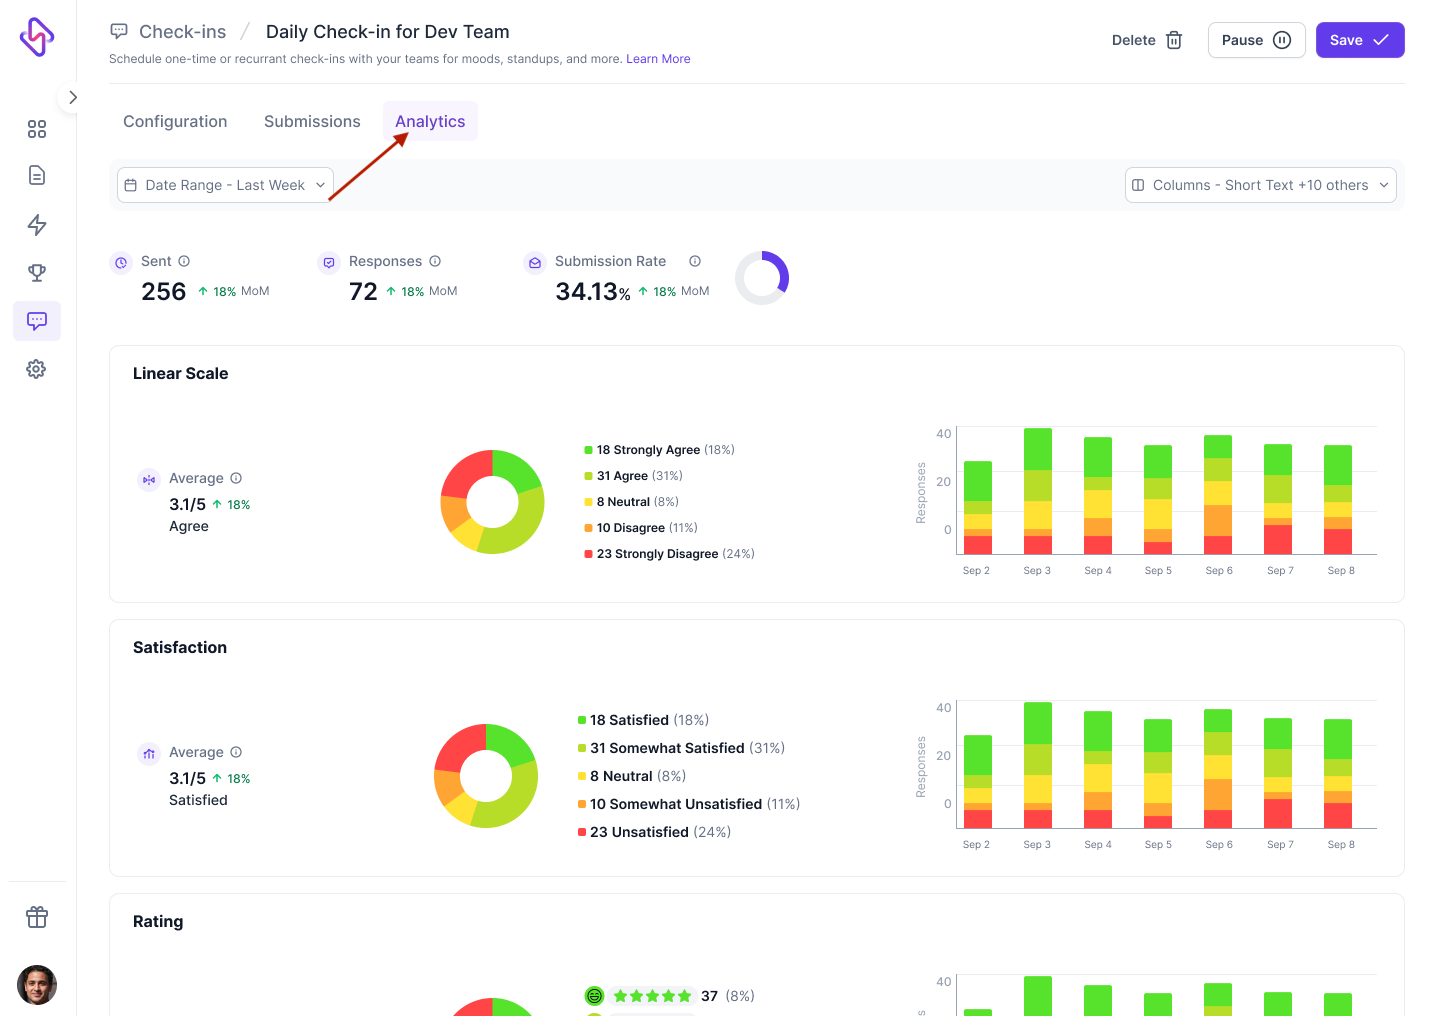
Viewing Analytics for a Check-in
To view Analytics for a check-in, follow these steps:
- Go to the Check-ins tab (https://app.hatica.io/checkins (opens in a new tab)) in your Hatica Dashboard and find the check-in you want to view analytics of. You can filter the list by check-in type or status to simplify your search. Click on the Edit button.
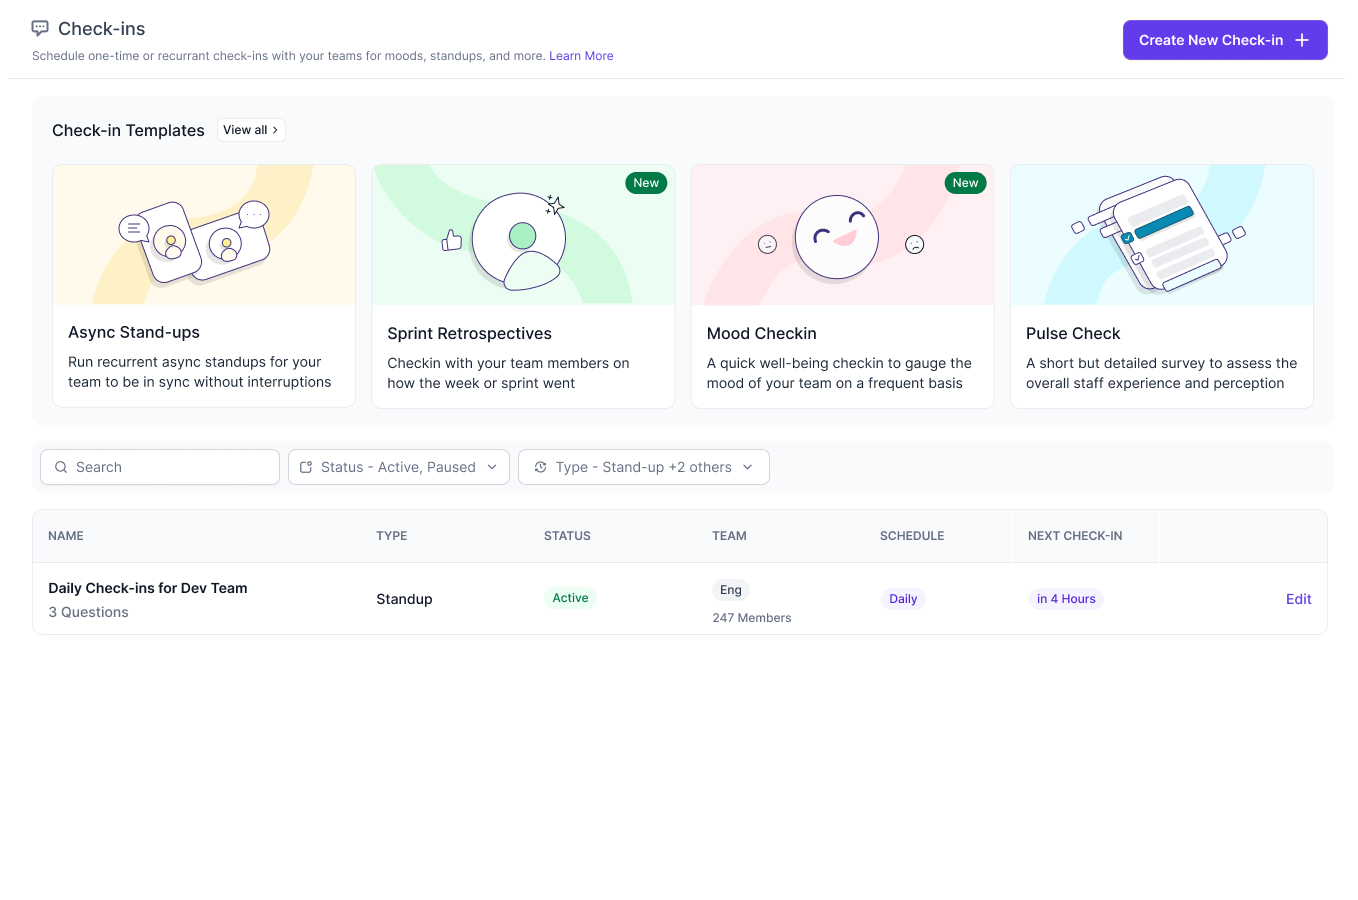
- Inside the check-in update screen, click on the Analytics tab.