Dev Metrics Grid Dashboard
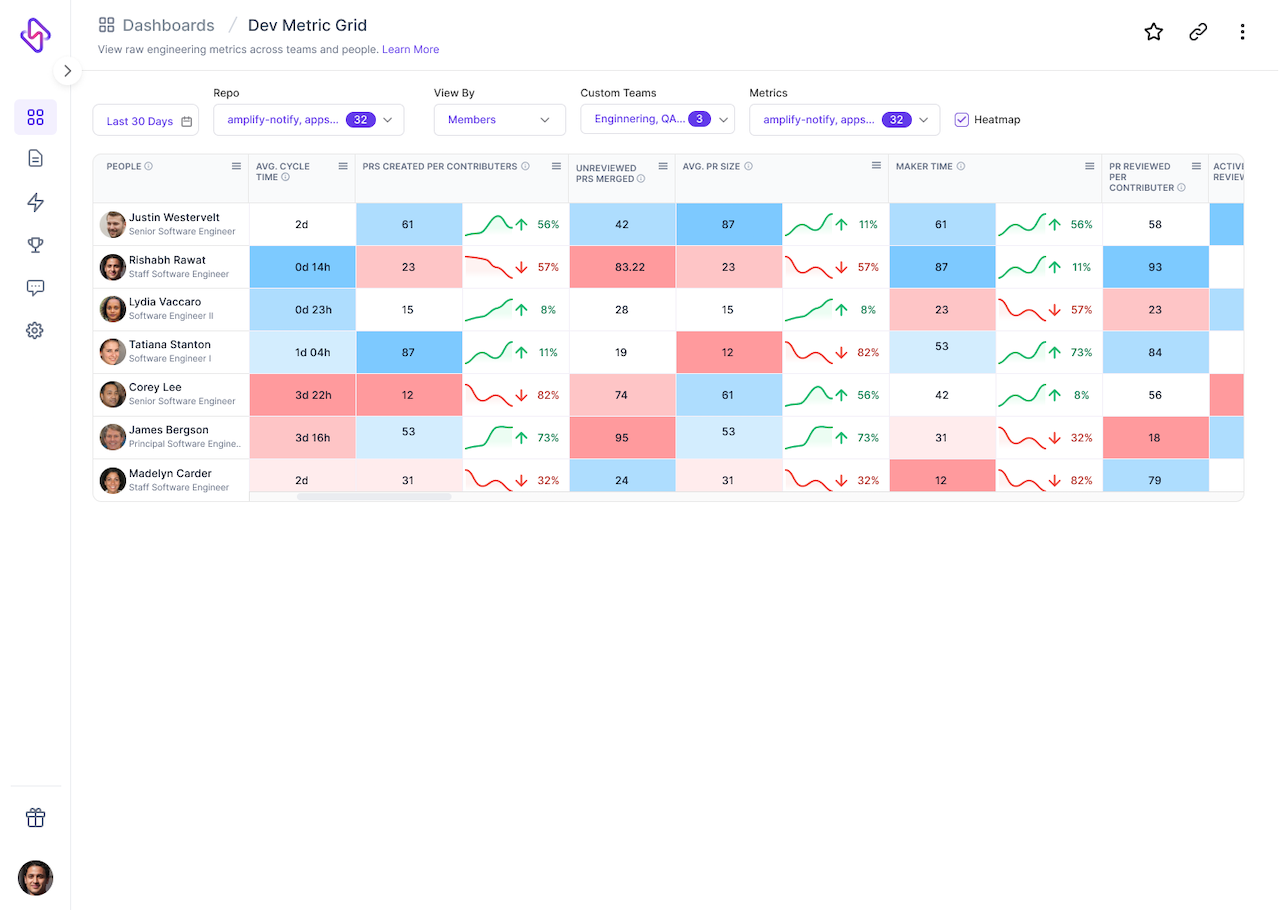
A grid of engineering metrics to get a quick understanding of your team - The dev metric grid dashboard helps you View raw engineering metrics across teams and people.
It contains some of the important metrics listed, per team, along with their severity.
Apps powering this dashboard
-
GIT/VCS
-
CI-CD tools
-
Communication tools
-
Incident Management tools
Check out all apps supported by Hatica here: https://www.hatica.io/connectors/ (opens in a new tab)
Available filters
-
Filter by Repository (Multi-select)
-
Filter by Metrics (Multi-select) - Select "n" number of metrics to be displayed on the grid.
-
Date Range Picker
-
View by Teams (managed teams, custom teams) and individuals.
Some reasons to use this dashboard
-
View metrics from different dashboards for your teams or team members, all in one quick table
-
Helps highlight the metric severity using color codes