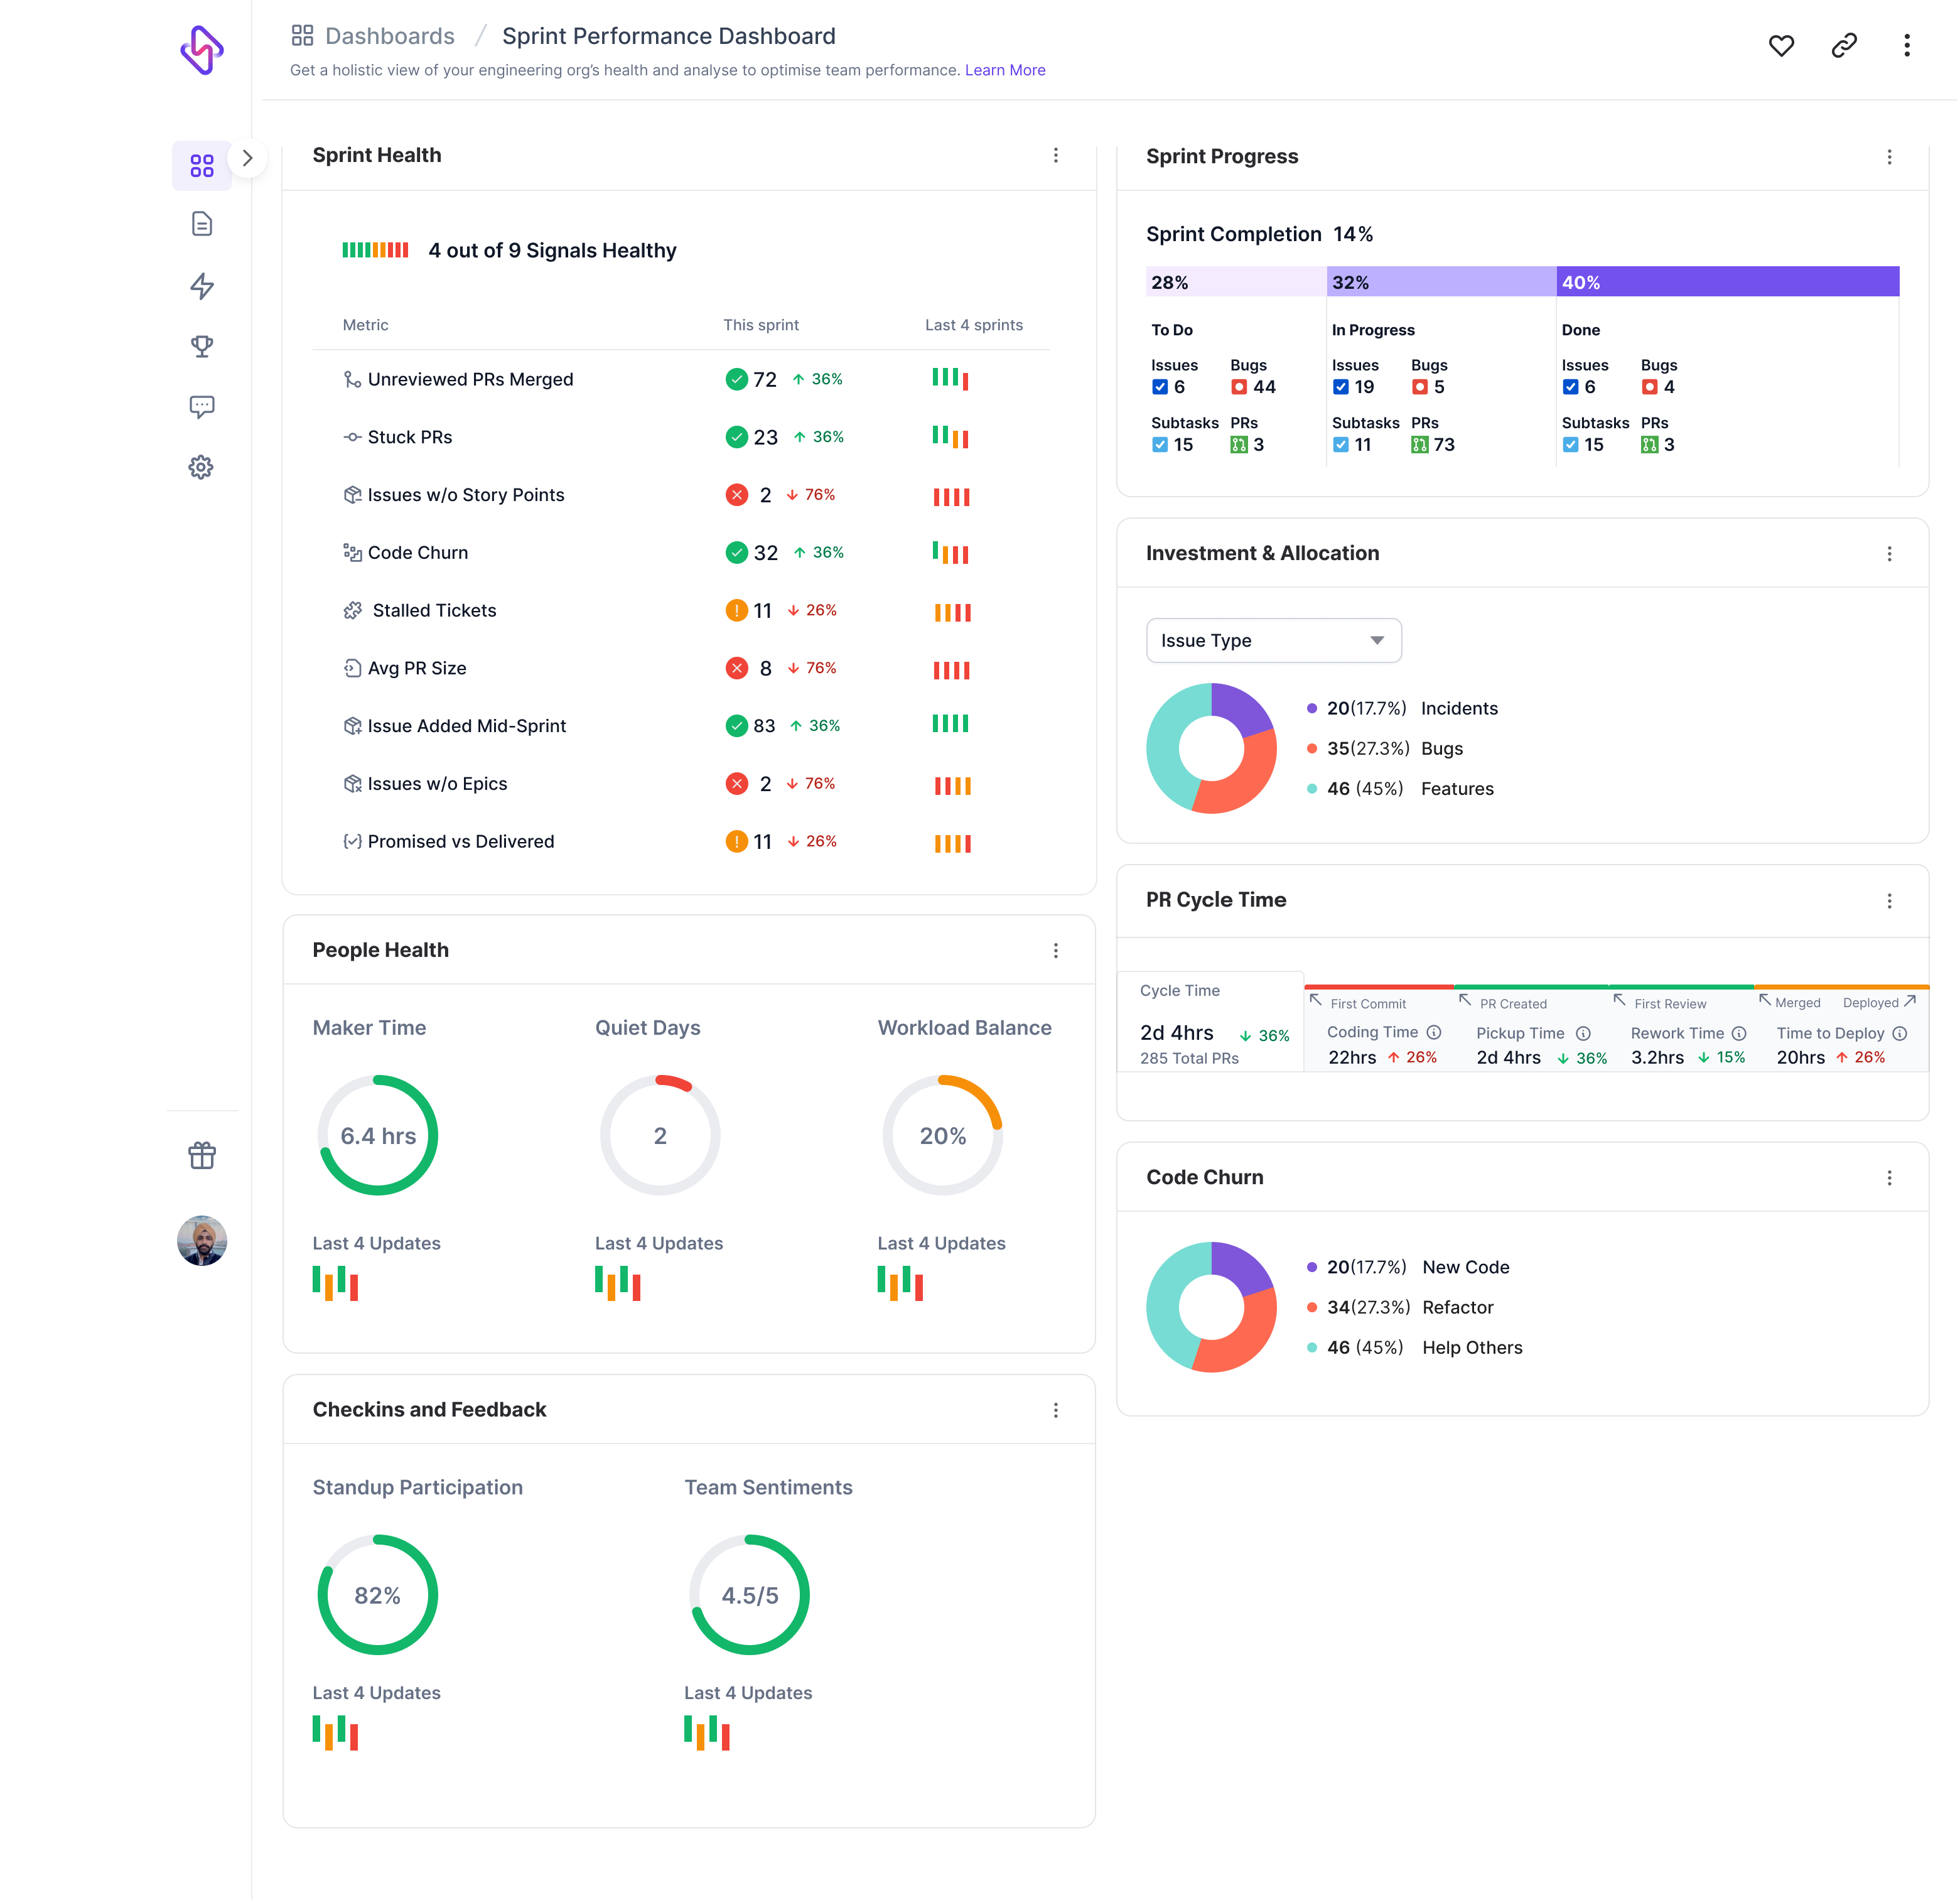
Sprint Performance Dashboard
The Sprint Performance dashboard enables engineering teams with data to run effective Sprint retrospectives. Most engineering teams run Sprint retros/equivalent ceremonies to reflect on what is working well & what is not. These retros usually occur at the end of a Sprint and before commencing the next one.
In these retros, teams look at Jira data (or equivalent) to review what was planned vs what was delivered. This is often-times, a unidimensional view of progress and misses out on Qualitative aspects of how the sprint was executed.
This dashboard has a Signals section which captures the important qualitative aspects. In addition, there is a trend of these qualitative signals spanning the last 4 sprints. Together, these enable teams to identify one-off issues vs persistent issues; with the latter possibly requiring some attention and fixing.
Video walkthrough
Data sources
- Project Management tools
- VCS tools
- Connected Calendar
- Check-ins
Filters
- Filter by Sprint
Sprint health signals
Unreviewed PRs Merged
- Formula: Number of PR merged in the sprint without a PR review.
- Threshold:
0and any number>0marks this signal Red. - How to use: This is a hygiene metric and teams should aim to be Green at all times
Issues w/o PR
- Formula: Number of issues closed in the sprint without any linked PR.
- Threshold:
0and any number>0turns this signal Red. - How to use: For engineering teams, this is an important metric and having PRs linked to the corresponding project issue is critical for traceability. Additionally, correlating data between the Dev Cycle Time & Project delivery dashboards requires this linkage. For teams that don’t rely on Git PRs to resolve issues, such as Support or Ops teams, this signal might not be relevant. For eg. issues that are resolving by changing a configuration may not involve a PR.
Issues w/o Story Points
- Formula: Number of issues closed in the sprint without any story points assigned to the issue.
- Threshold:
0and any number>0turns this signal Red. - How to use: For feature teams this is an important metric to track because Story points along with the Project Delivery dashboard will help the team understand their delivery velocity. There are many teams that do not rely on Story points, for these teams the signal will always be Red.
Avg PR Size
- Formula: Total lines of code changed (added + deleted) divided by total number of PRs merged in this sprint.
- Threshold:
300lines of code change and any number>300turns this signal Red. - How to use: This signal is in-line with the industry best practice of keeping PRs changes to
<300lines. Note that this 300 lines of change and not 300 lines of new code. The rationale being that from a review, stability quality & release perspective it gets harder to manage large-scale changes.
Issues added mid-sprint
- Formula: number of issues that were added to sprint after sprint was started
- Threshold:
0and any number>0turns this signal Red - How to use: This signal is a reflection of how the team is planning the sprint, whether they are leaving time in the sprint for unplanned issues. A Red signal once in a while might be acceptable but being Red sprint-after-sprint is indicative of planning misses. It can be argued that teams should leave 10-20% buffer in each sprint for unplanned issues. However, this approach allows teams to never get better at planning or foreseeing issues before they become critical.
Issues w/o Epics
- Formula: number of issues closed in the sprint without any corresponding Epic
- Threshold:
0and any number>0turns this signal Red - How to use: This signal aims to measure work done by the team in the sprint that is not aligned with the product roadmap or an organisational priority. The assumption this signal makes is that all big efforts are planned as Epics and issues are tagged to the Epic. Teams that don’t plan using Epics or track issues against Epics will always have this signal in the Red.
Promised vs Delivered
- Formula: Total number of issues planned divided by total number of issues closed
- Threshold:
1.0and any number<1.0turns this signal Red - How to use: This signal measures the planning & delivery accuracy and teams that are Green have a health plan-and-do ratio. For teams that are Green and have a signal
>1.0, this is a reflection of over-delivery for eg. planned 10 issues, delivered 12 issues. The 2 issues were unplanned, so either these were added mid-sprint or the team took these as a stretch task. Consistent over-delivery is reflection of a higher velocity & throughput from the team but could also reflect poorly on the Team’s well-being.
People health
This section provides a sprint-level view of the team’s well-being metrics during the sprint. As with the Well-being dashboard, these metrics provide visibility on
- Does the team have enough time to spend on developing software vs. spending time in meetings
- Is the time available in contiguous blocks vs being fragmented
- Are there enough quiet days where the team can focus on developing software
By surfacing these are a sprint level, the team has a view of time that is actually available for engineering.
Code churn
This section highlights the kind of code contributions made during the sprint viz.
- New code: new lines of code that have been added to the code base
- Churned code: changes made to the existing code base updated code that was merged within the
last 21 days - Refactored code: changes made to existing code base updated code that was merged more than
21 days ago
This helps teams understand whether the sprint delivered new value to customers vs restructured existing code for maintainability or fixes.
PR cycle time
This section highlights the cycle time metrics for the sprint viz.
- Coding time: elapsed time from the first commit to PR creation
- Pickup time: elapsed time from PR creation to first PR review
- Review time: elapsed time from first PR review to PR merge
- Deploy time: elapsed time from PR merge to deployment
These are the same metrics surfaced on the Dev Cycle Time dashboard but focused on the selected sprint. This helps teams understand & compare the sprint’s development cycle time vs historical data.
Investment allocation
This section categorises the work delivered in the sprint by the underlying issue type. This helps teams understand the nature of work that was delivered in the sprint viz. new features vs bug fixes vs incident resolution. The issue types are obtained from the underlying project management system.
Use-cases
- Conduct data-driven retros to help you reflect better on the sprint performance by looking at data across
- Qualitative & Quantitative data to help teams understand areas of consistent performance and consistent gaps
- Identify areas of strengths & improvement on a sprint-over-sprint basis
- Bring distributed teams together by fostering open discussion and feedback. This form of open communication is designed to promote trust, transparency, and sustainable productivity – all of which aids in the team working together towards a shared goal, thereby promoting cohesion
Insights
Use this dashboard to get insights into the following aspects of the sprint
- What went well in the sprint?
- What didn’t go so well?
- How can we improve incrementally?
- Which are the areas where we need to improve as a team?
- Why is a Signal consistently red
- Focus on signals that are consistently green & recognise these team’s strengths
- Is the team’s time spent in engineering trending up across sprints or is there a downward trend?
- Does the team has 80% quiet days and average of >6hrs of Maker time?
FAQ
What is the source of this data?
- PR & code related data is sourced from the underlying VCS (Github, Bitbucket etc)
- Issues & sprint data is sourced from the underlying Project management system (Jira, Azure Boards etc.)
- Meeting data is sourced from connected calendar (G-Suite or Office 365)
Are the signal thresholds configurable?
No, the signal thresholds are not configurable at this time
What are the thresholds for Red & Green indicators?
The thresholds vary by signal; refer to the Sprint health signals section for details on each signal