Organization Investments
One of the key pillars of Hatica is to enable Alignment of Engineering efforts with business & user needs and this dashboard is our way of driving that Alignment.
Amongst the hardest questions that Engineering Leaders & Finance Leaders have to answer is what area is Engineering investing on. Usually this ends up being a combination of data from Issue tracking tools, combined with Excel sheets & a variety of VLOOKUPs. The Investment dashboard in Hatica provides an at-a-glance answer to this exact question.
Using this dashboard, it is easy to address to determine which category of work is being prioritised at an overall Engineering level as well as by each Team. Work allocation is visible at an Epic & Task level to make it easy to dive into the details.
Data Sources
The primary data source for Investment allocation is your Issue tracking system i.e. Jira, Azure DevOps etc. Data from Git/VCS tools is also used in case the PRs are linked with the corresponding ticket
Filters
- Time range: The data is balanced only for completed weeks or months; due to FTE calculations, for the current week/current months the data will be incomplete
- Criteria: Work type or Capitalization. Work type relies on the Investment Allocation configuration to categorise each issue. Capitalization relies on the in-built cost capitalization rules to compute capitalizable engineering costs
- Allocation: View the data by Full-Time Equivalent headcount or Cost
- Interval: Monthly reporting is the only supported interval at this time
- Custom Teams: to filter the data for specific teams
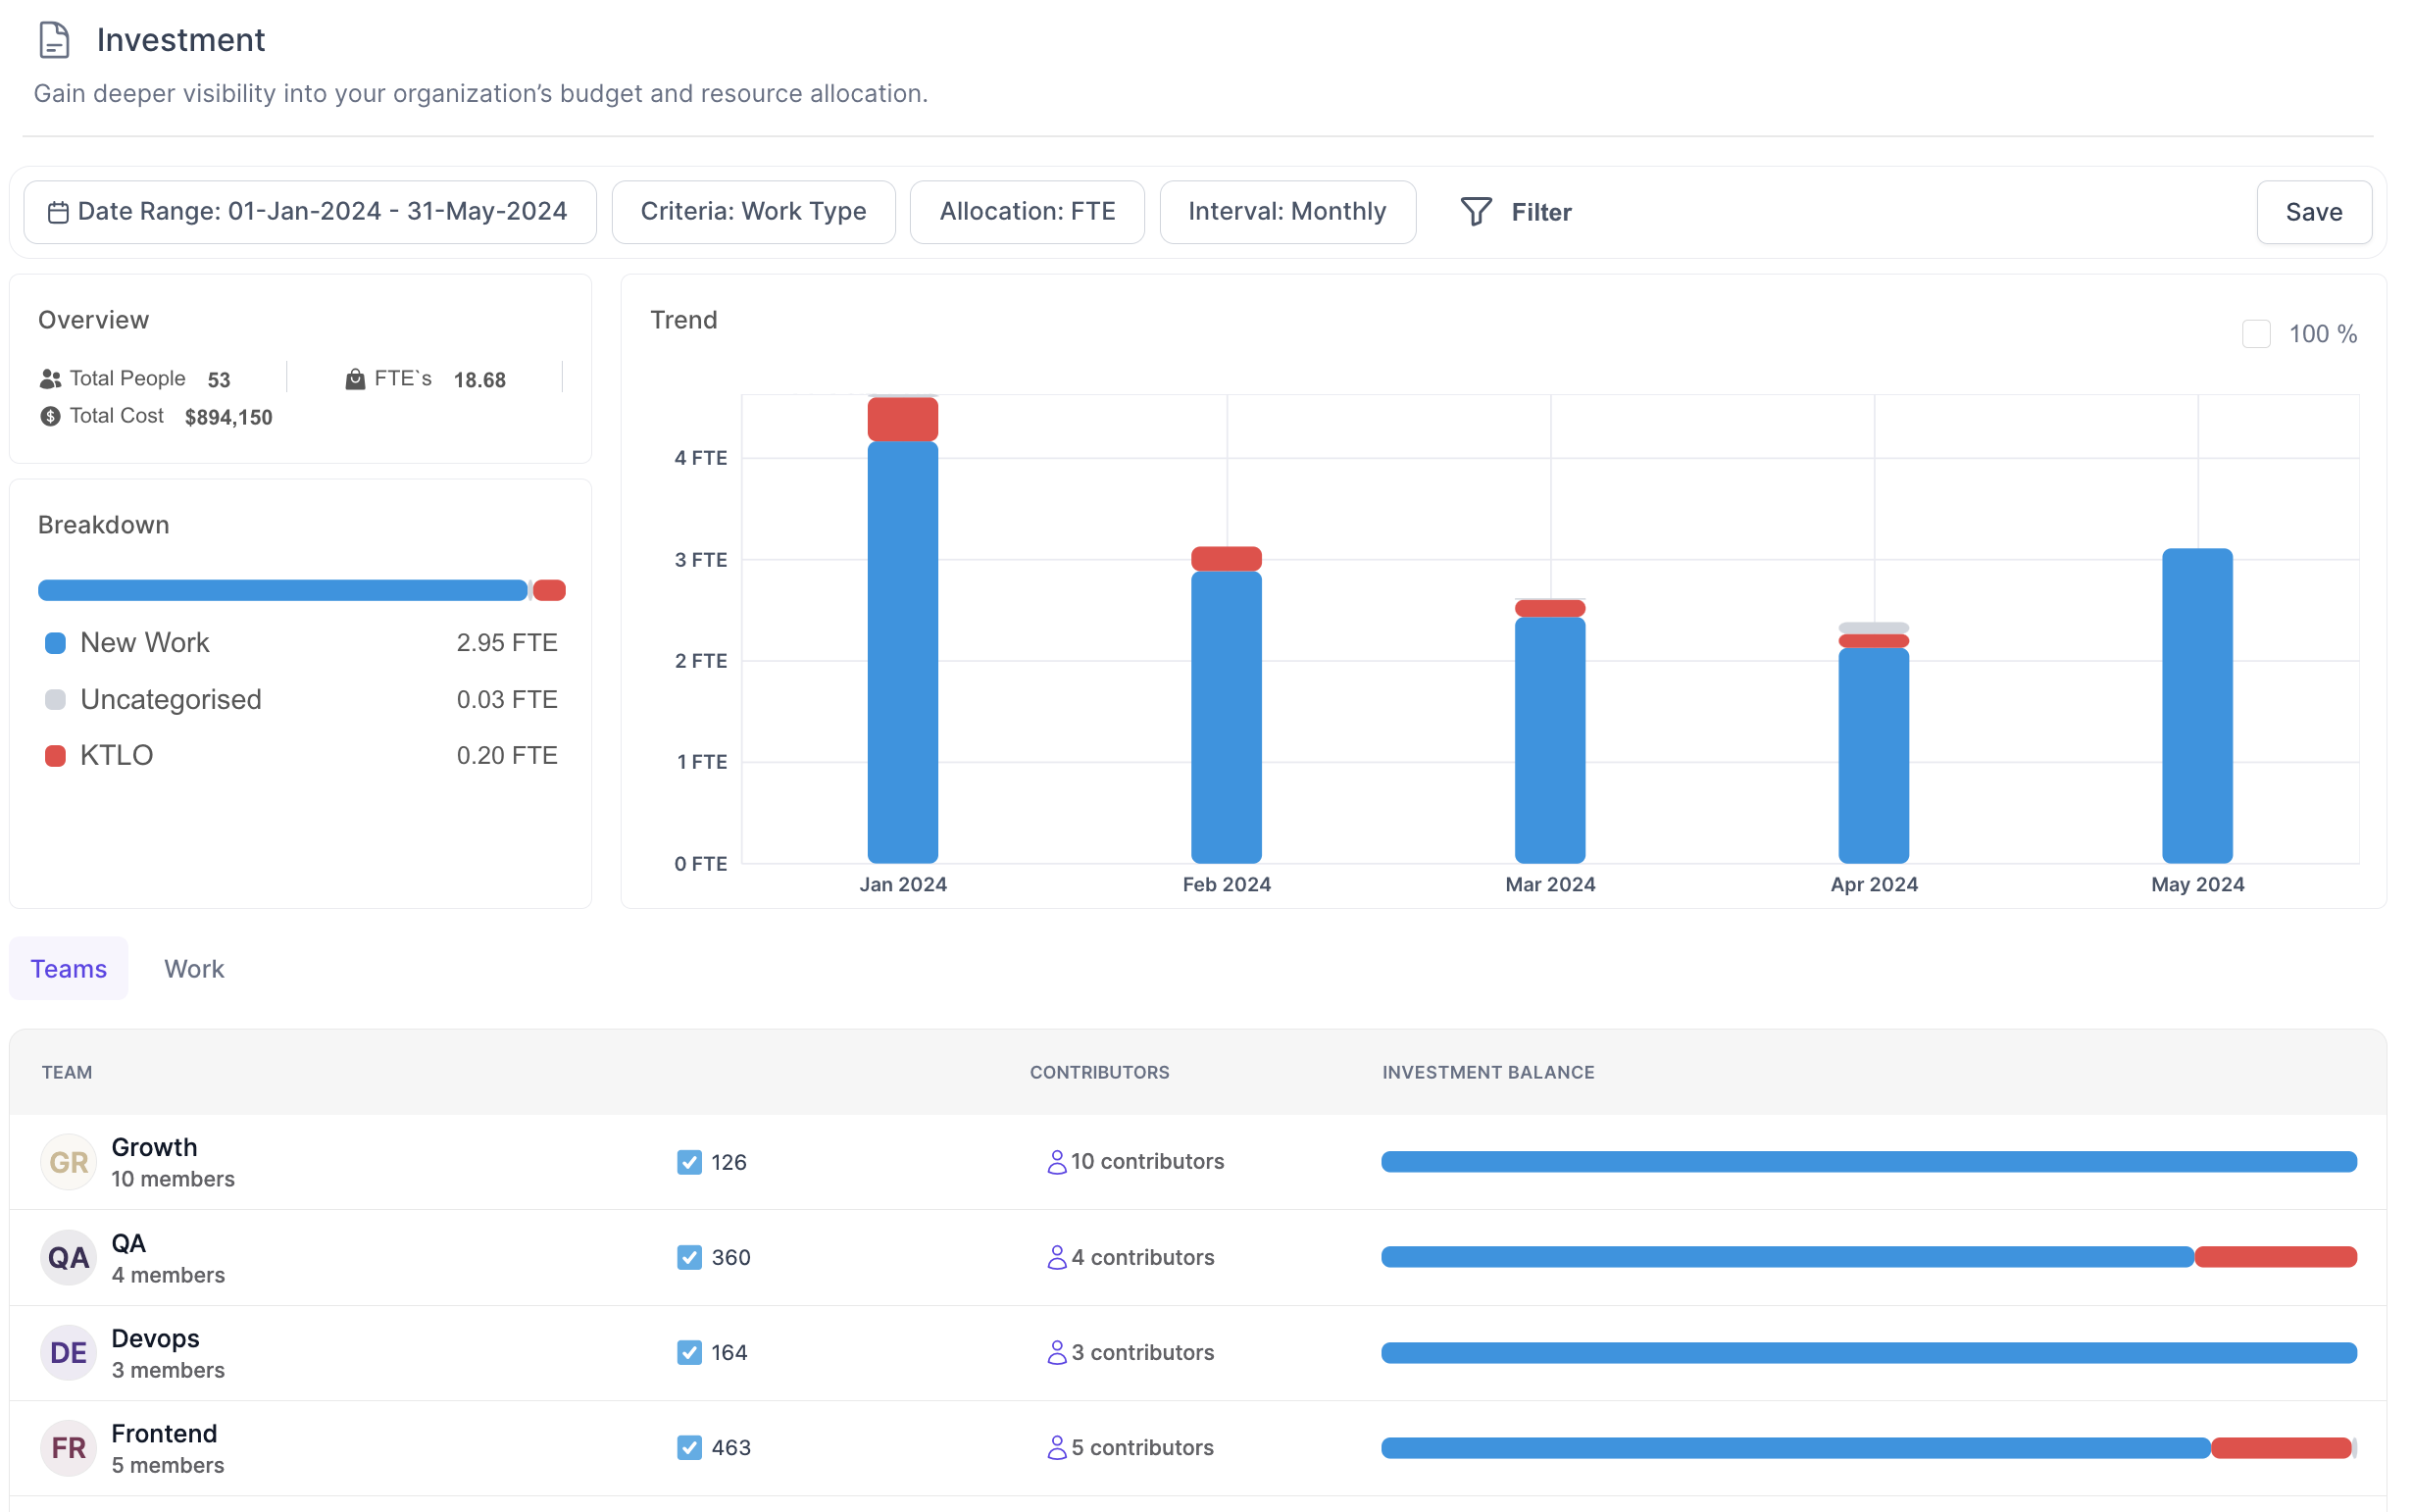
Overview
This widget displays
- Total people in the organization
- Full-Time equivalent work delivered in the selected date range by the selected team
- Total cost: of the selected teams in the selected date range
Breakdown
This section depicts the breakdown of as per the selected Criteria
- For Work Type criteria
- Breakdown displays a simple stacked bar proportionate to the investment in each category of work
- Each category of work is displayed along with the FTE or Cost data, as per the Allocation filter. This is the amount of FTE or Cost invested in that category of work.
- For Capitalization criteria
- There will always be 2 categories - Capitalizable & Non-capitalizable
- Capitalizable: is the amount of FTE or Cost, as per the Allocation filter, that can be Capitalized
- Non-capitalizable: is the amount of FTE or Cost, as per the Allocation filter, that cannot be capitalized
- In the Capitalization view there is an Export button which provides complete backup data in an Excel format for Finance teams to easily validate & capitalize software costs. Refer to this section for further details on how to use the Excel sheet
Trend
The trend widget displays period-over-period data to easily understand how the investment patterns are shifting over time.
Use the 100% checkbox to normalize the data for all months to 100% and understand the relative change in investments over time. This shifts the Y-axis of the Trend graph from FTE count to percentage.
Teams
When the Custom Teams filter is not applied, the dashboard displayed the investment categorisation for all Teams configured in the system. When a specific team is selected, via the Custom Teams, filter this section is not displayed.
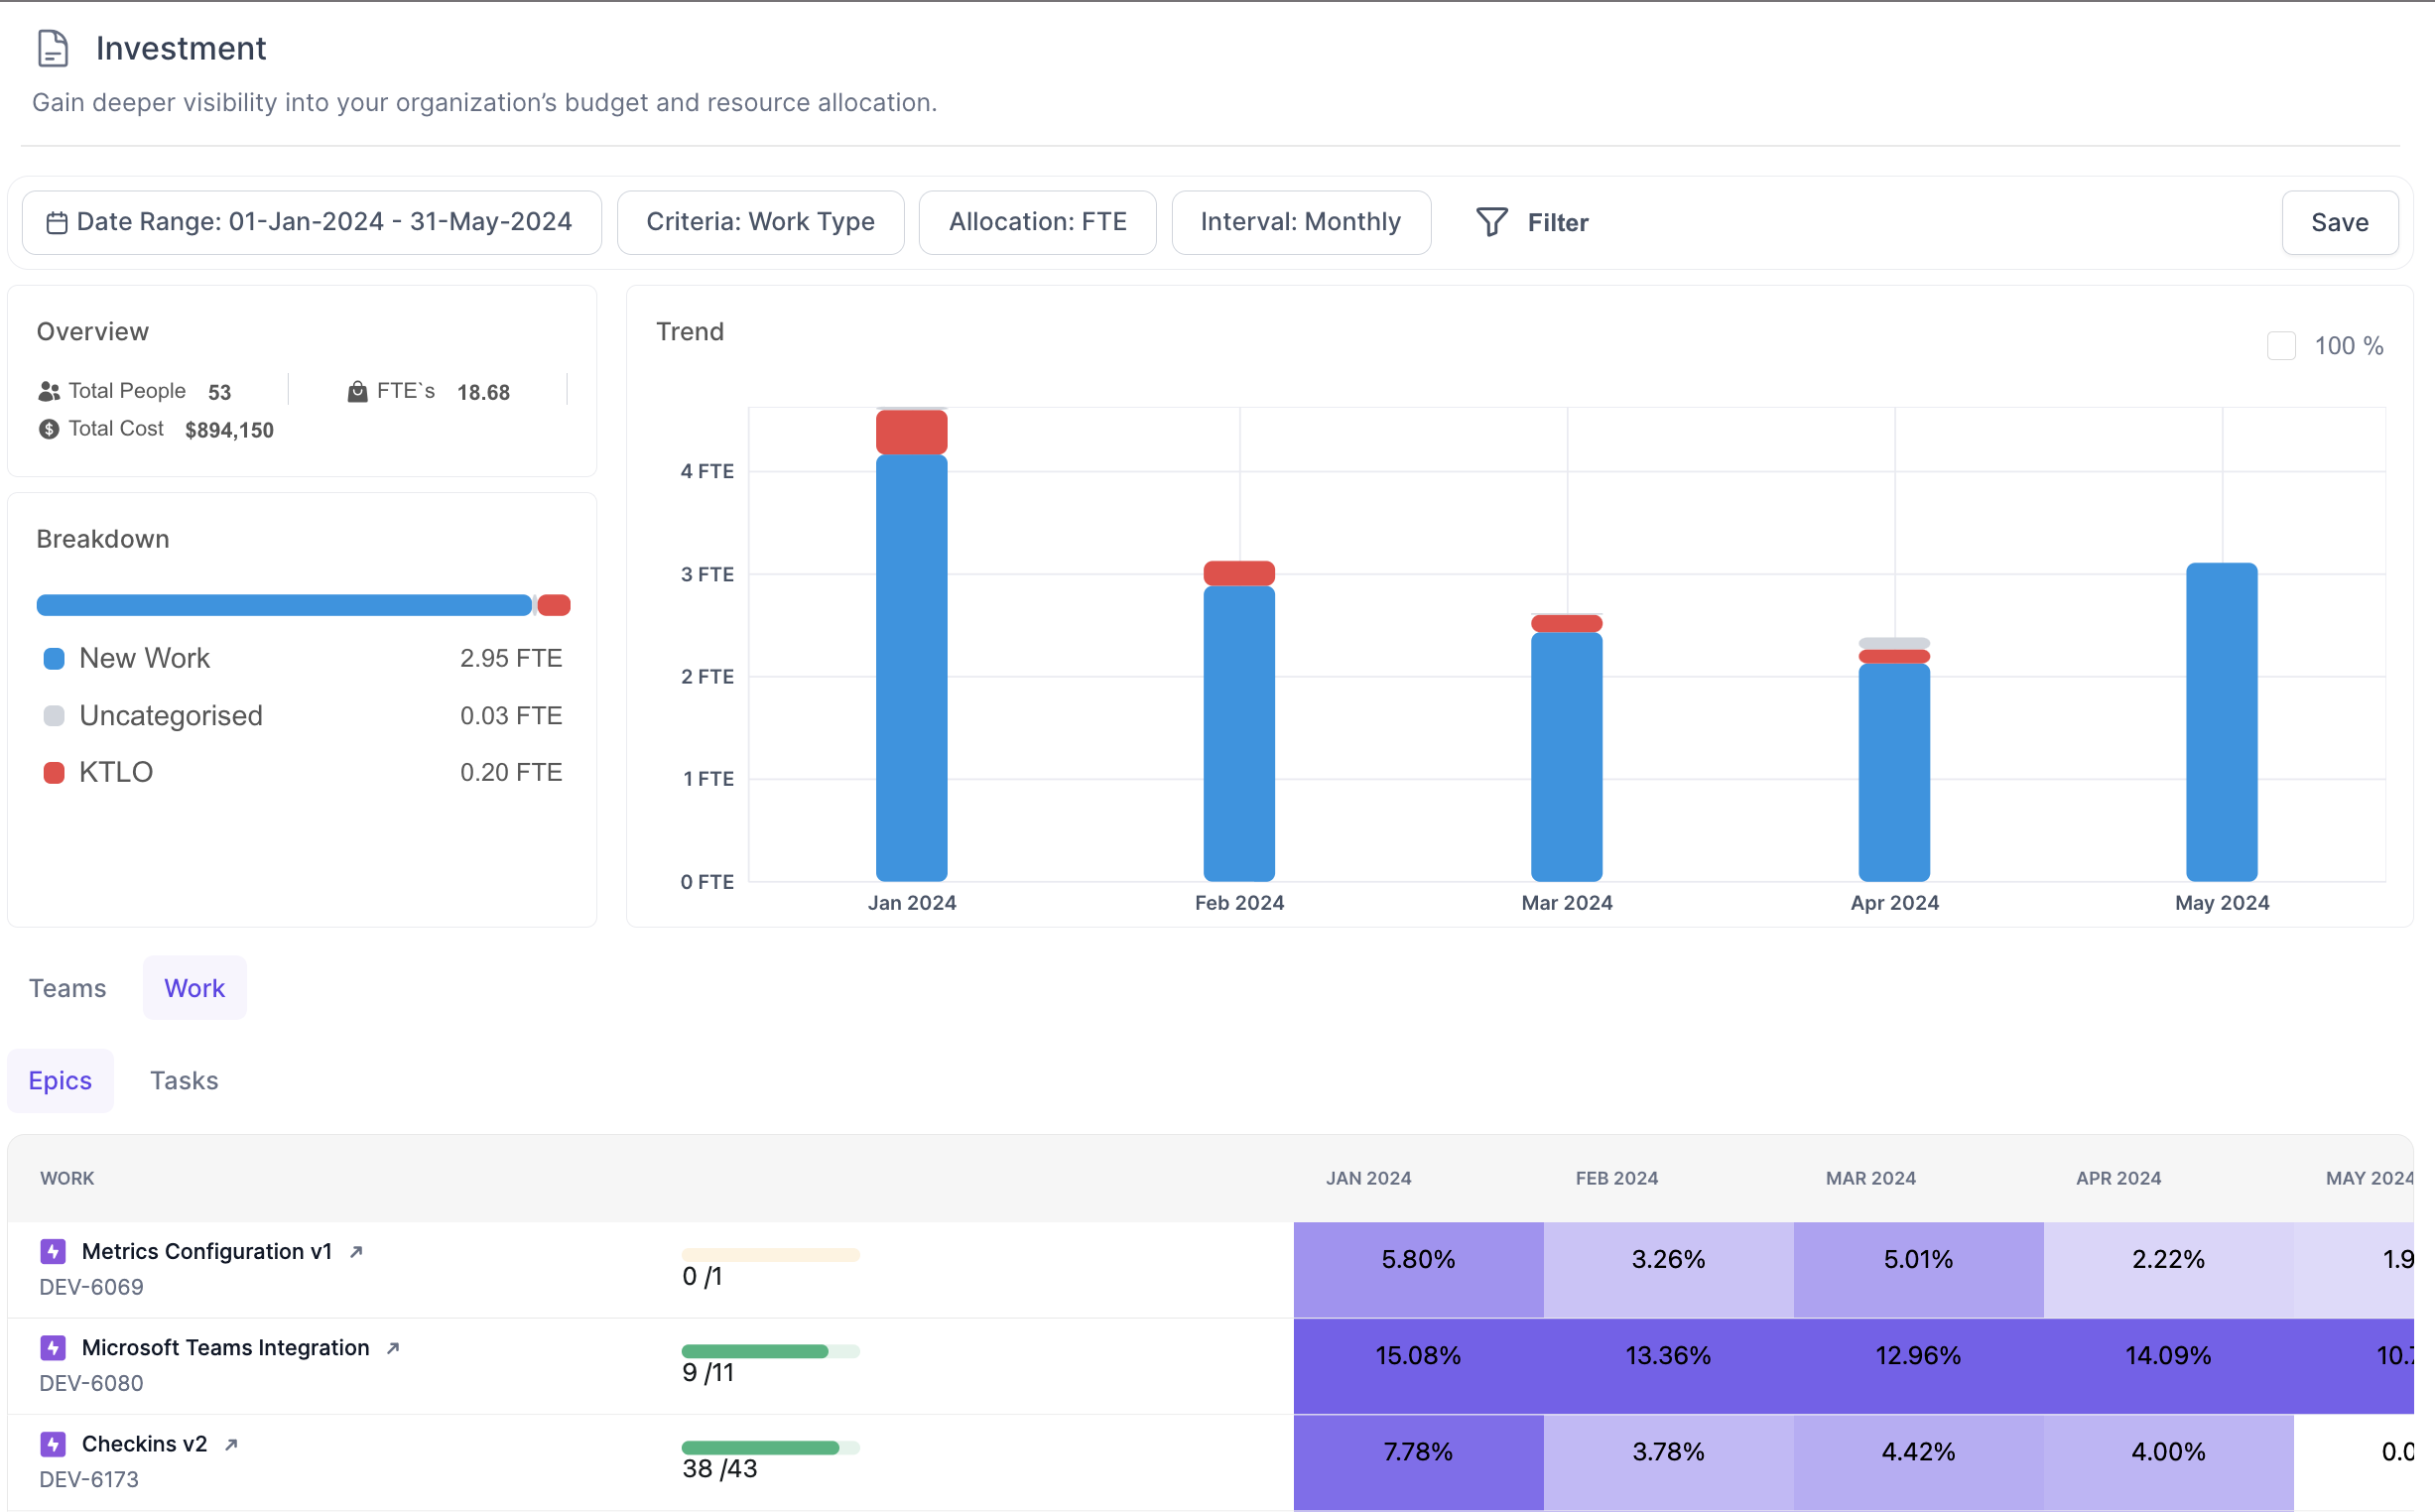
Epics
This section displays all Epics on which any effort was invested in the selected time period. All tasks that have moved from a To-Do state to an In-Progress state or to a Done state are considered for calculating the efforts.
If any Epic had its status change or any issue in the Epic has a status change, the Epic will appear in this section.
The progress bar against each epic indicates the number of sub-tasks in the epic that have been completed. The bar is color-coded as follows
- Epics that are 100% completed are indicated in Green
- Epics that are >50% & <100% complete are indicated in Blue
- Epics that are <50% complete are indicated in Orange
The FTE invested on the epic in each month is displayed in the grid, epics with more effort are highlighted in bold and epics with less efforts are mildly highlighted.
In the Capitalization view, the capitalization of each Epic can be manually toggled and over-ridden. The updated capitalization value is used in the exported Excel sheet i.e. if an Epic was capitalizable by default and was marked as non-capitalizable, the exported Excel spreadsheet after this revision, will exclude all efforts spent on this Epic from capitalization calculation.
Note that the effort spent on the Epic is not discarded; only the capitalization is removed.
Tasks
This view displays a list of tasks that had any effort invested in the selected time period. All tasks that have moved from a To-Do state to an In-Progress state or to a Done state are considered for calculating the efforts.
In the Capitalization view, the capitalization of each Task can be manually toggled and over-ridden. The updated capitalization value is used in the exported Excel sheet i.e. if a Task was capitalizable by default and was marked as non-capitalizable, the exported Excel spreadsheet after this revision, will exclude all efforts spent on this Task from capitalization calculation.
Note that the effort spent on the Task is not discarded; only the capitalization is removed.
Understanding your investment allocation
Investment allocation works best once the investment categories are configured. By default, Hatica ships with 3 investment categories
- New Work: this includes all tasks of type Story and Task
- Keeping the lights on (KTLO): this includes all tasks of type Bug
- Uncategorised: all other task types are consider Uncategorised, including any custom ticket types
Consider the following example:
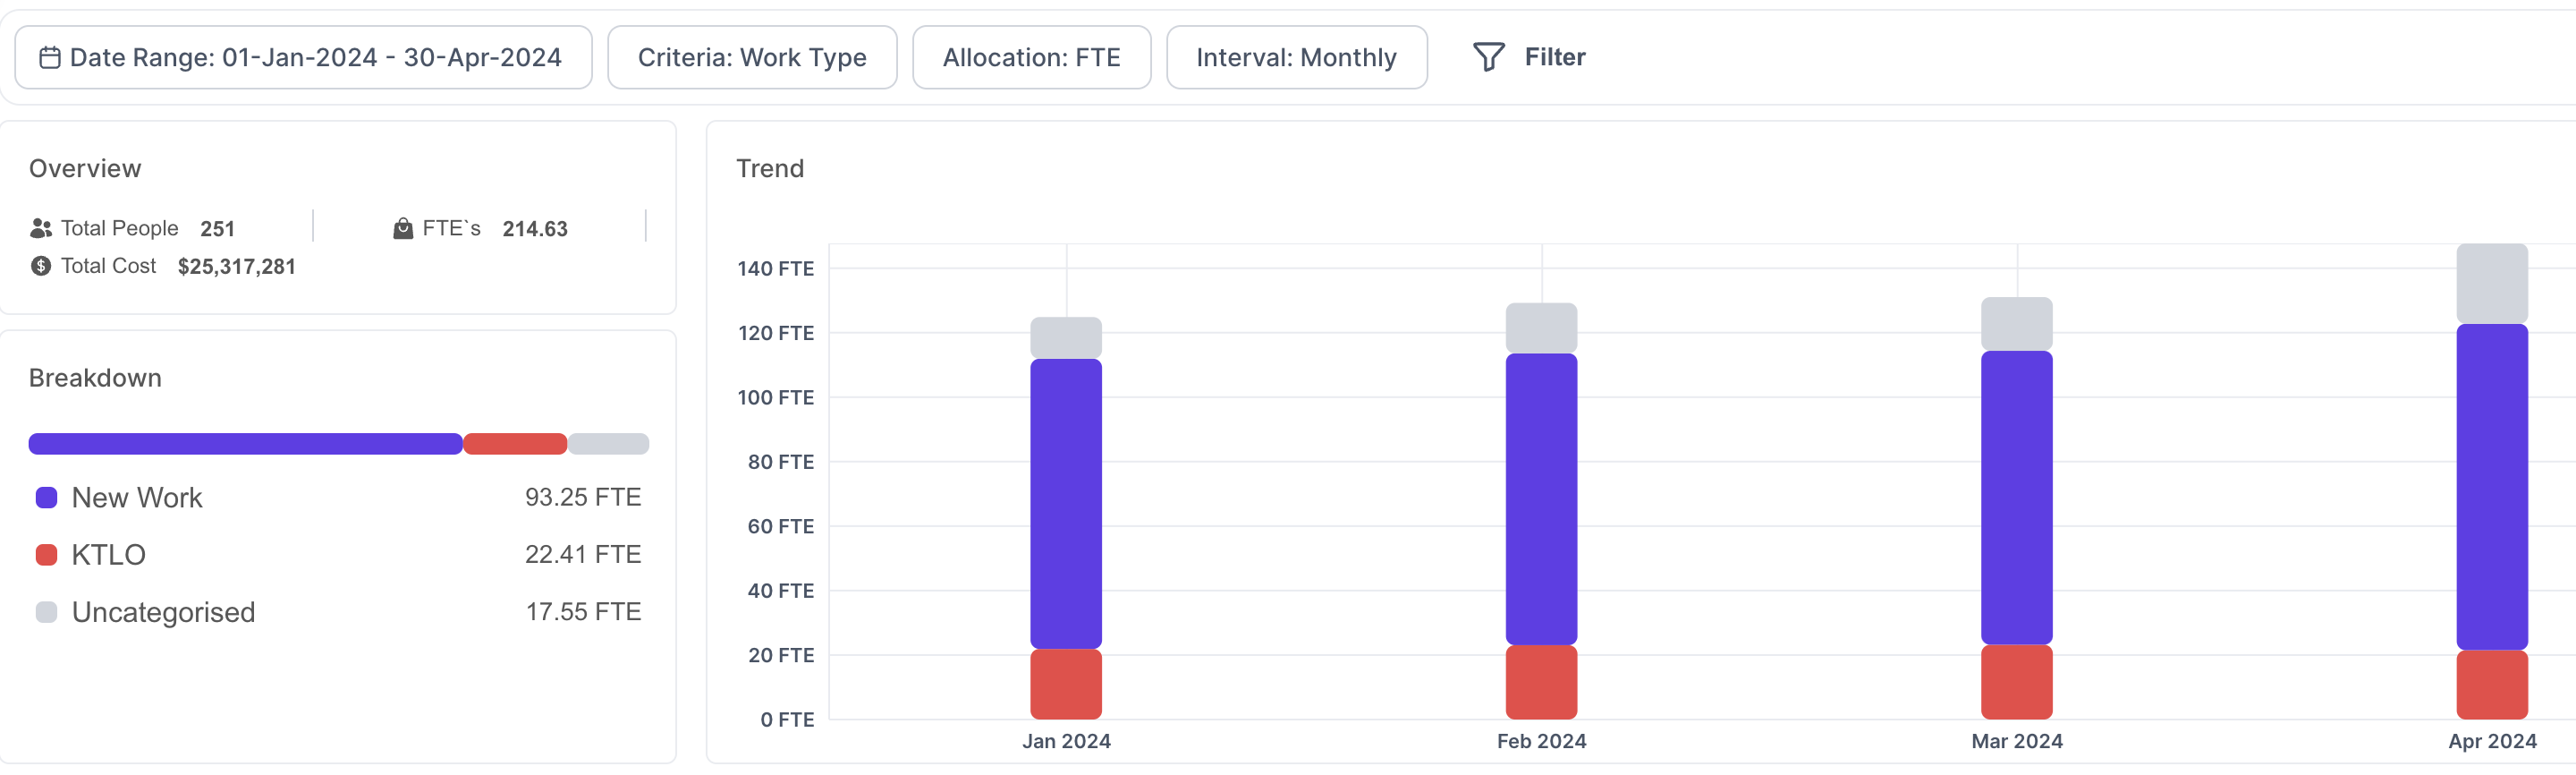
It is evident that the Engineering bandwidth has increased in the selected time period, with total contributors increasing from over 120 FTEs to over 140 FTEs over a 4 month period. However, the KTLO investment is nearly flat, which means significant additional investment or productivity improvements have happened towards New Work & Uncategorised work. Also the Uncategorised work has increased significantly in the month of April. This might be indicative of a new priority or shifting some bandwidth towards task types that are not yet configured under any investment category in Hatica.
Understanding Cost Capitalization
The fundamental premise behind Cost capitalization is to allow treatment of software development cost as long-term assets instead of expenses. Once categorised as Assets there are a variety of Accounting treatments that come into play, the foremost being the ability to amortise the costs over a period of time, resulting in higher profitability i.e. instead of incurring the entire expense at once, it is spread over time.
Note that there are a variety of default capitalization rules that Hatica employs by default; these can be further over ridden via manual adjustments.
The ascertain software costs for capitalisation the first step is to apportion effort for all complete tasks, which is done in using the Full-Time Equivalent calculation.
Understand the exported Excel spreadsheet
The Excel spreadsheet has 3 tabs
- Summary: this tab has details from the filters, overview & breakdown sections of the dashboard
- Breakdown-month: this provides a month-on-month summary of capitalizable and non-capitalizable FTE/Costs. Note that the Normalized FTEs value is FTE equivalent for the selected time period and not a sum of values of the selected months.
- Breakdown - work items: this tab provides a detailed list of tasks that are considered for capitalization in the selected time period. This includes the following columns:
- Time Period (month): the month for which this task has effort allocation. This is set to the 1st date of the month
- Ticket owner: name of the member to whom the task was assigned
- Ticket ID: the Jira/equivalent ticket ID
- Ticket Title: the Title of the ticket
- Ticket Type: the type of the issue i.e epic, bug, task, custom
- Task Link: the direct URL to the task
- Epic ID: if the task is linked to an epic, this is the ID of that Epic
- Allocation FTE: the full-time equivalent effort spent on this task
- Is Capitalizable?: whether the task is capitalizable or not; this is a boolean field (True|False). Manually adjusted values of the Capitalizable field are reflected in this field.
When working with the Breakdown tab note that the numbers will tally as follows
- For any given time period, the sum of Allocation FTE for all tasks under an Epic will be equal to the Allocation FTE of the Epic itself
- For any given month, the sum of Allocation FTE of all Capitalised tasks will be equal to the Capitalized FTE for the Month
- For any given month, the sum of Allocation FTE of all Non-capitalised tasks will be equal to the Non-capitalized FTE for the Month
Configuring investment categories
Use Settings → Investment Categorization to configure investment categories; each investment category can use a combination of the following attributes
- Issue Type
- Label
- Epic
- Project
For visual distinction, it is recommended to pick distinct colour codes for each investment category.
Note that it is possible to have overlapping categories; however, we recommend avoiding overlapping them. If you configure overlapping categories, the system won’t report an error, but you will see the same work being counted against multiple categories. For example, if “task type = bug” is kept under two categories, say, KTLO & Defects, then when you look at investment allocation, the work & $ will be reported twice - once under KTLO & once under Defects.
Changes made to investment allocation categories could take up to 24 hours to reflect.
FAQs
Who has access to this dashboard?
Access to the Investment Allocation dashboard is restricted to Admins only
Why is the investment data for the current month inaccurate?
The Full-Time equivalent calculation relies on data for a full time period hence the investment data for the current month will be incomplete. The date filter does not block selecting the current time period.
Why is the Effort for an Epic across the months, not adding up to 100%?
The month sums up to 100% not the rows, because FTE is computed at a month level.
How is the cost per FTE calculated?
FTE cost is defaulted to $300,000 per year in Hatica and all cost computations rely on this cost.
What costs can be capitalized?
The accounting guidelines allow capitalization of direct costs such as salaries, benefits, and other direct costs associated with the development team involved in the software development process.
How to configure exact costs for each engineer?
Since engineer compensation is sensitive data, Hatica does not have provision for computing the exact compensation at an engineer level. Also, when Finance teams run capitalization calculation they need to consider other variations for eg the state of Texas has the Texas Research & Development Tax Credit, which may influence where R&D activities are performed.
Similarly there are other compensation variations for eg
- Engineers at different levels of seniority
- Engineers that work remotely or work from international locations
Considering all this, Hatica offers the raw data via in Excel, which finance teams can use to run VLOOKUPs and compute the capitalization for regulatory filings.
How is Allocation FTE calculated?
FTE is full time equivalent so for every member the FTE calculation is a portion of their time for which they had tasks in progress. If a developer had 1 task in-progress for an entire week the FTE allocation for that week would be a 1. If a member has, say, 2 tasks in progress then the FTE calculation divides the allocation equally across both tasks. If a user had a task in progress for 1days out of 5days, the FTE allocation for this task would be 0.2 FTE.
Note that while the above examples are using “weeks” as the boundary, in practice only a monthly boundary is used and the app only supports monthly boundaries for Allocation FTE calculation.
Which tasks are capitalised and which ones are not?
All tasks that are linked with an Epic, regardless of the task type, are considered Capitalisable by default. Any tasks that are not linked with an Epic are considered non-capitalisable by default. To change the capitalisation handle for any tasks, use the “Capitalizable” toggle in the app, this allows for individual tasks can be included or excluded from capitalisation.
How are tasks rolled up?
Since Epics are the instrument for capitalisation, the FTE allocation for all tasks within the Epic is rolled up under the epic. In the exported Excel sheet, the numbers will tally as follows
- For any given time period, the sum of Allocation FTE for all tasks under an Epic will be equal to the Allocation FTE of the Epic itself
- For any given month, the sum of Allocation FTE of all Capitalised tasks will be equal to the Capitalized FTE for the Month
- For any given month, the sum of Allocation FTE of all Non-capitalised tasks will be equal to the Non-capitalized FTE for the Month
Why is it important to define investment categories carefully?
Since this dashboard is an org-level construct and visible only to Admins, it makes sense to define the categories carefully & with management buy-in.
Are the default Investment categories sufficient?
The default investment categories are actually very good for 80% of scenarios. The only thing it doesn’t handle is custom task types (if you use those).