Change Failure Rate
Change Failure Rate is the percentage of deployments that cause a failure in production. Note that this is not a measure of deployments failures, but changes that cause the application for fail.
This metric is configurable under app.hatica.io/services/dora (opens in a new tab) and currently supports either a PR label Regex or a PR title Regex to recognise PRs containing the fix for a recent failure. The regex is using JS regex notion (opens in a new tab) .
Computation of the metric
- Data on the total number of production deployments (The total number of production deployments or releases you’ve made) and "fix-only" deployments (The number of production deployments or releases causing an incident or a failure) is gathered from CI/CD tools.
- The number of “fix-only” deployments is subtracted from the total production deployments to determine the number of change failures. Then, the number of change failures is divided by the number of changes to obtain the team's change failure rate.
Industry Benchmarks
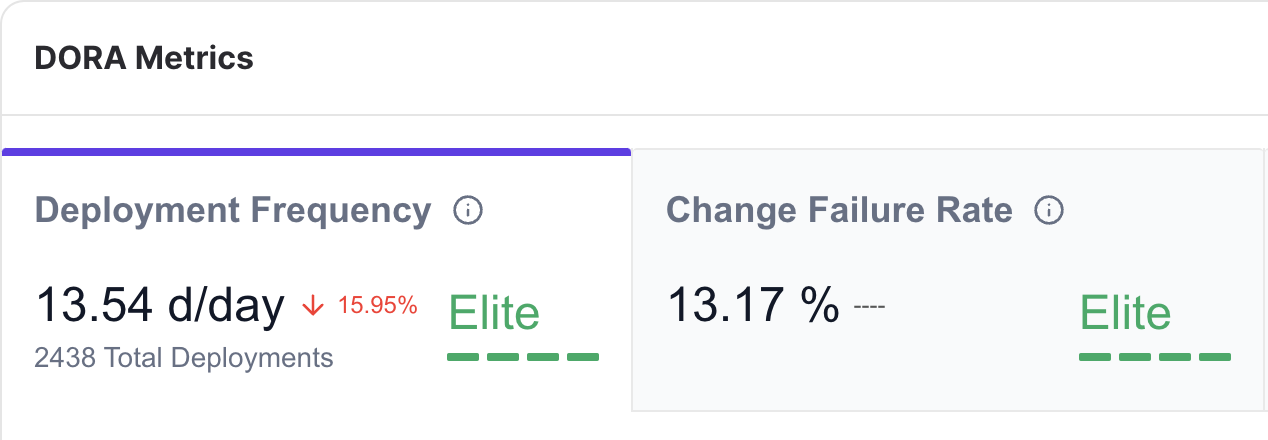
The DORA performance grades for Change failure rate are:
-
Elite - Between 0-15%
-
High - Between 16-30%
-
Medium - Between 31-45%
-
Low - Between 46-60%
Dashboards where this metric is used
- DORA Metrics dashboard
Use cases of this metric
- Use CFR to understand how often does the team break things in production while moving fast
- Understand which services, teams, members have high Change Failures
- Compare CFR & MTTR data to understand failures induced by changes vs incidental failures that are not due to application changes