Activity Log Dashboard
The Activity Log Dashboard offers a bird's eye view of the team's daily activity and enables engineering managers with
360-degree visibility into team’s activity: by bringing together data from Jira, Git and other tools to view PRs, commits, tasksSurfacing work blockers and burnout risks: Views signs of potential blockers that are slowing down the work. Zoom in to see the task, commit or PR behind the activity and get context to make informed decisions.Planning & Completion rates: by integrating Check-Ins, the Activity Log lets you understand the plan & compare it with the completed work. All Check-in input is surfaced in the Activity log to facilitate this analysis.
Video walkthrough
Data sources
- GIT/VCS tools
- Project Management tools
- Check-ins
Filters
- Date range picker
- View by Teams (managed teams, custom teams) and individuals
- Activity types (Git and Project activities)
How to infer this data?
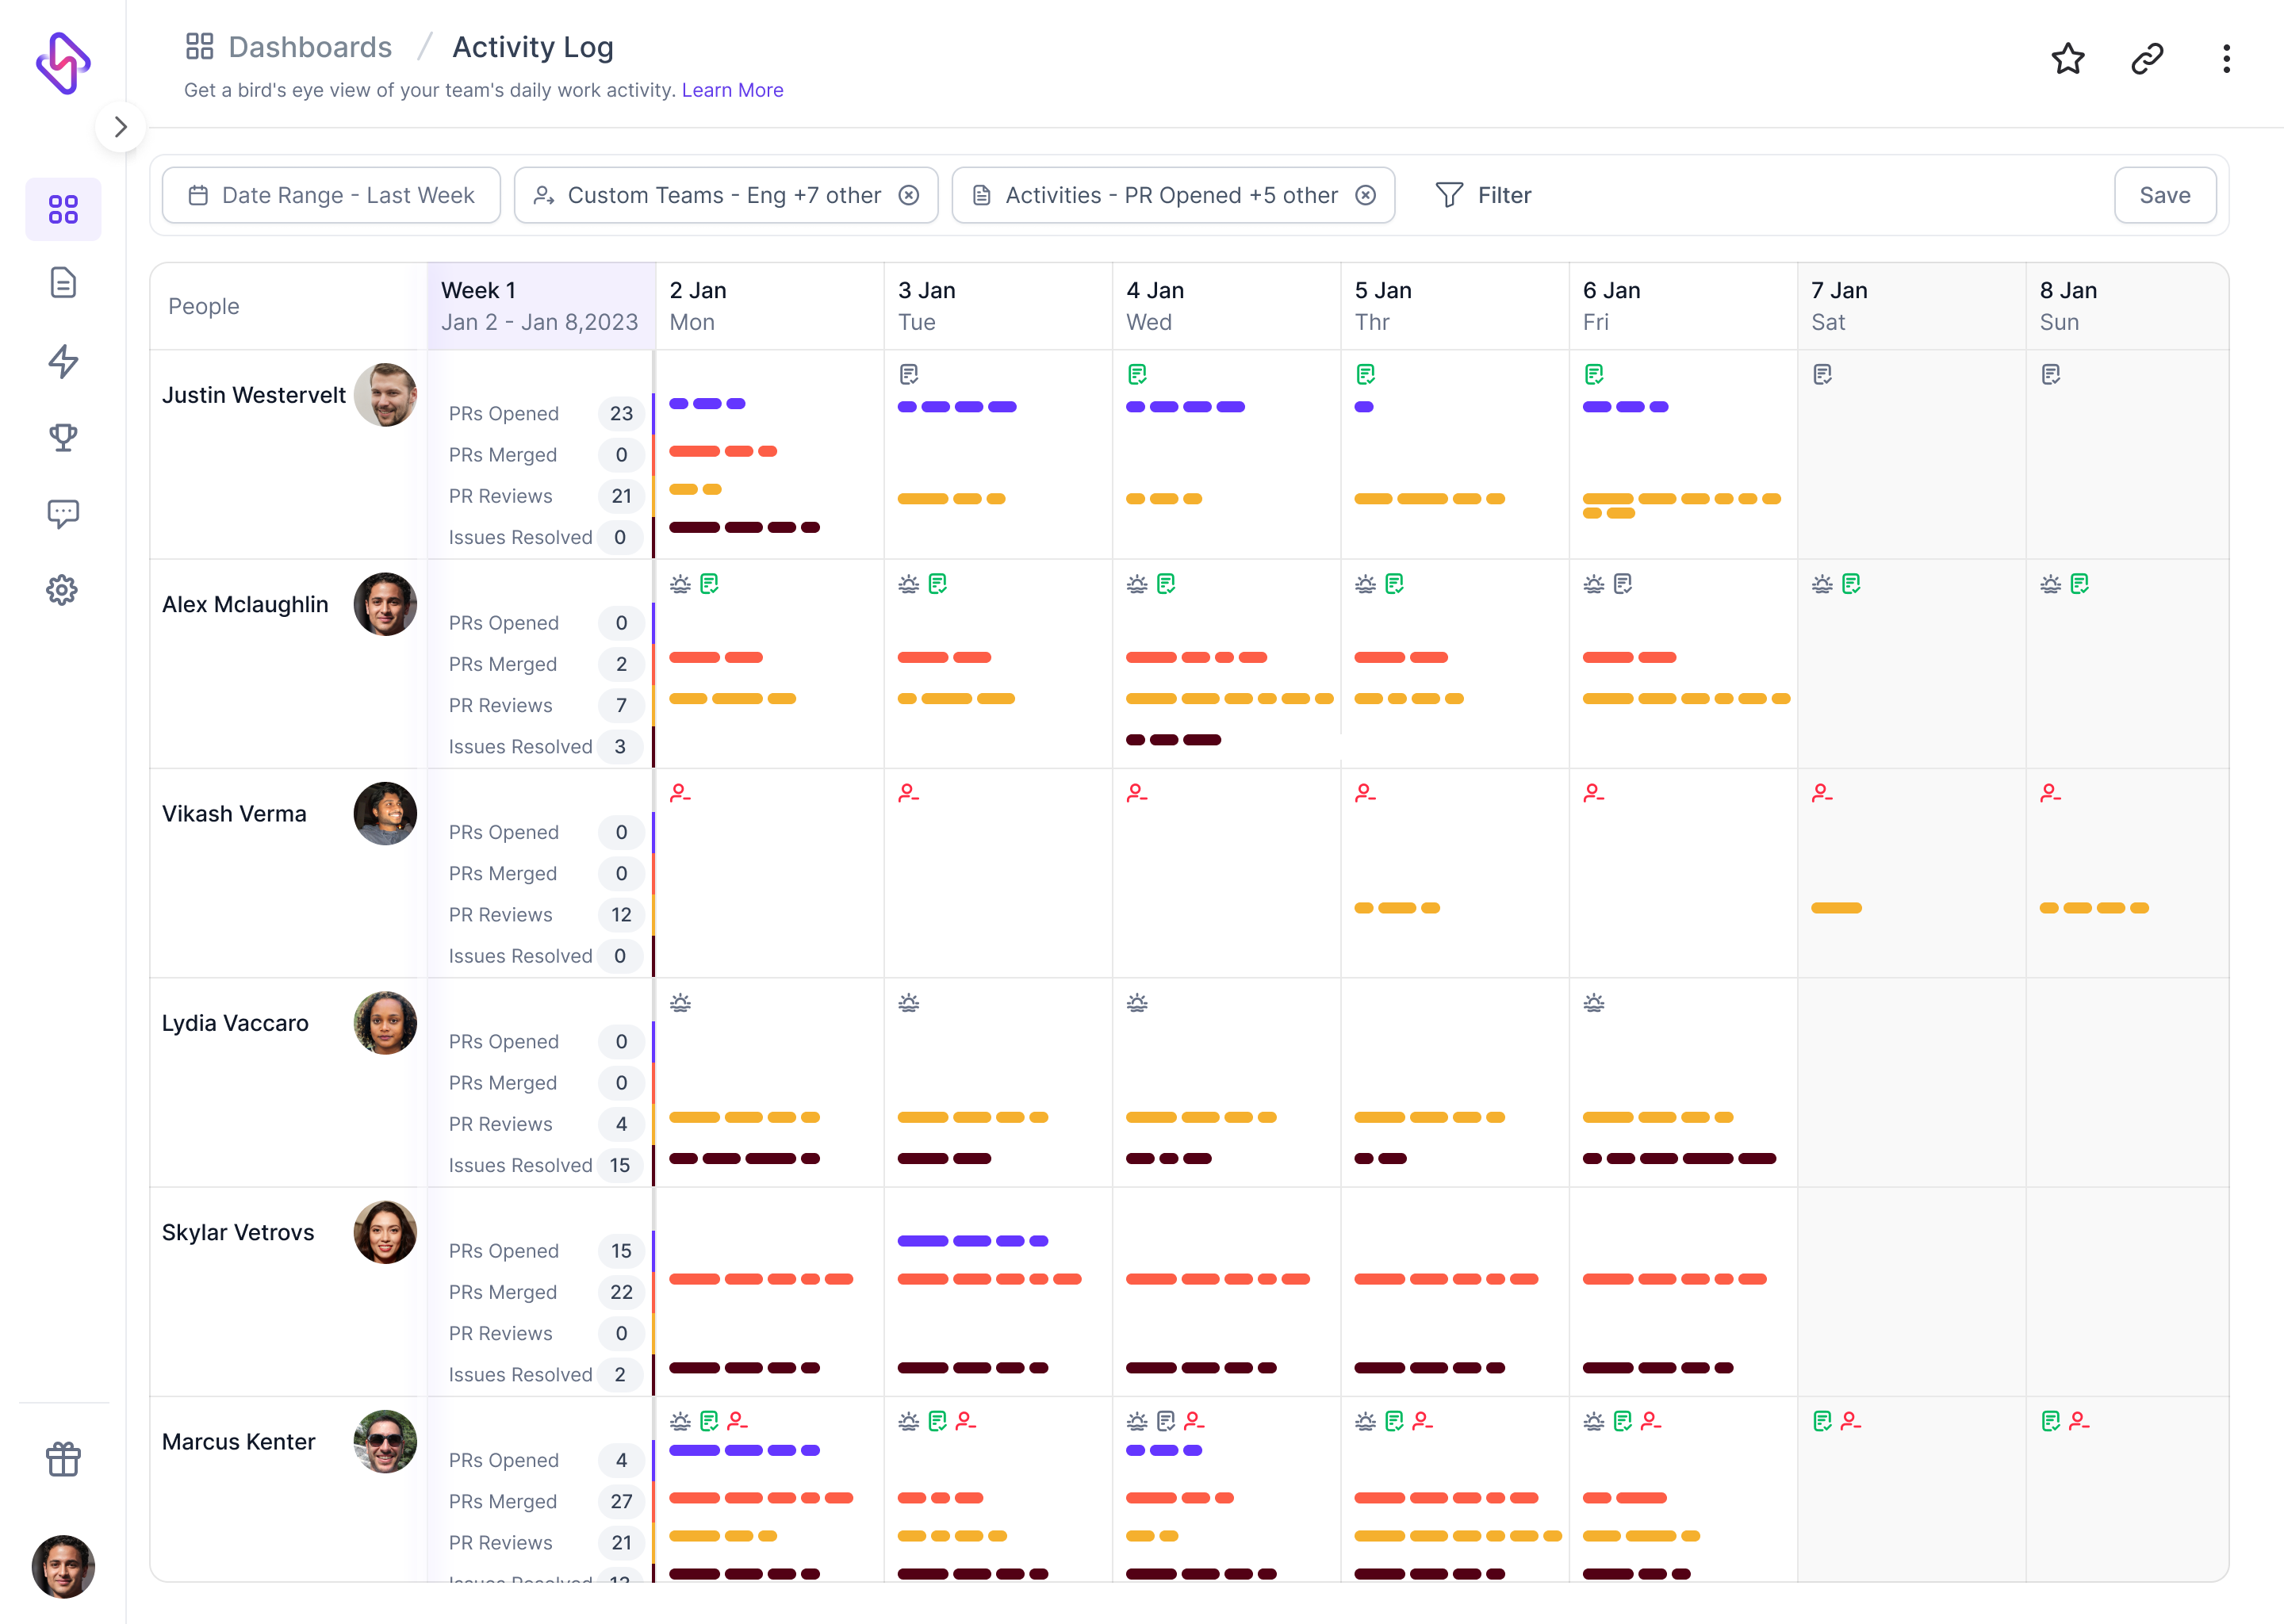
Each activity type is color-coded to make it easier to understand instances of that activity across the time scale. Few other things to note in this view:
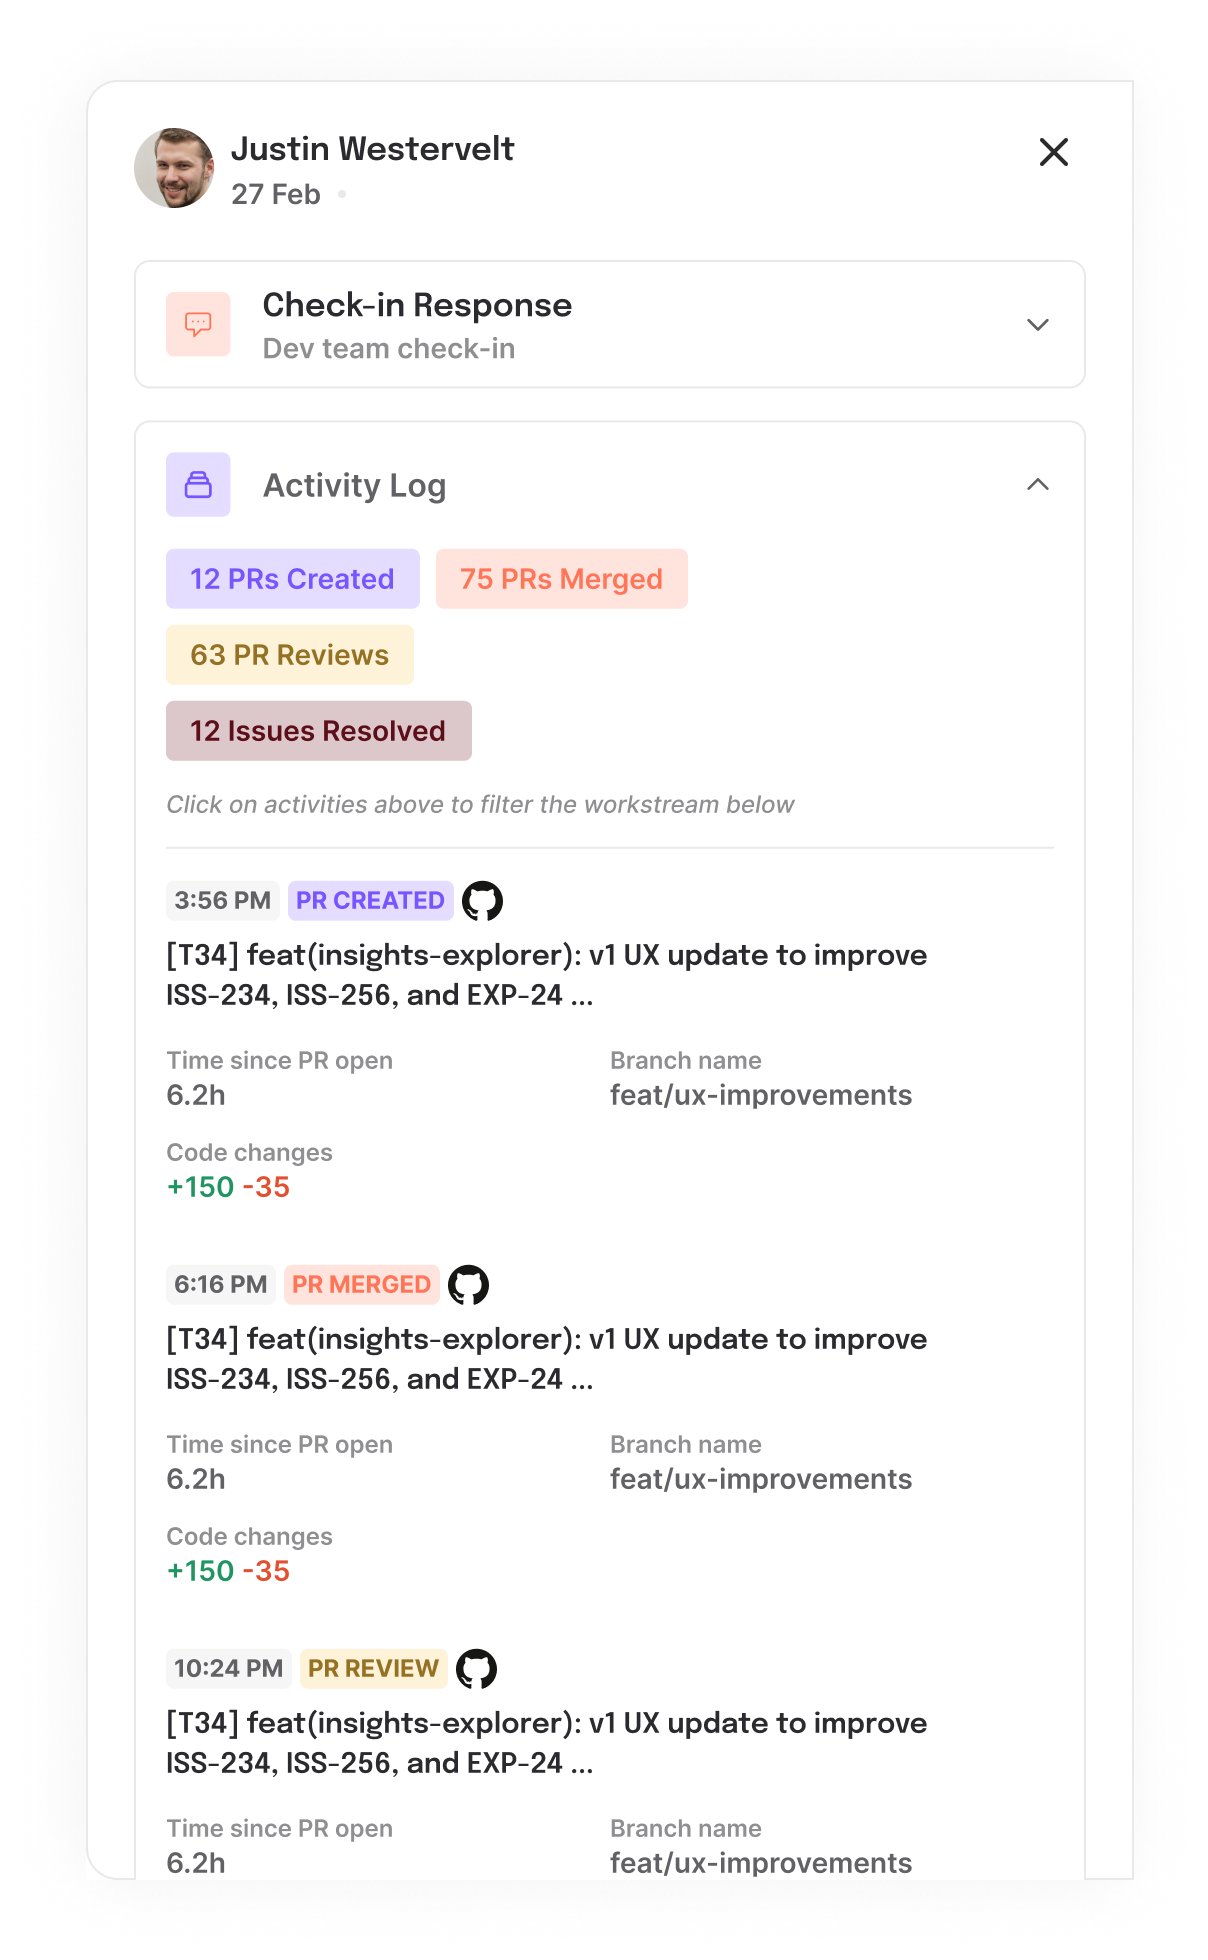
Bifurcation using colour and band size: Availability of colour coding to highlight the various work type and sub-work on specific days. For individuals with a lot of activity the cell would be packed with color-coded indicators and vice-versa empty for users with no activity.Summary: the 2nd column summarises the total number of activities by activity type for each individual across the selected date range. For engineers you should expect to see lot of Git activity whereas for tech leads you should expect to see more PR review activities.Day-level summaries: hover on the top right of a day cell & click on the Open button for a day-level summary for any individual member on the team. The fly-out panel displays all activities completed by the individual; the panel will also include the check-in summary submitted by the individual for the day - making it easier to understand what they reported as their plan for the day in the daily standup.
The Commit data only accounts for Remote commits; any commits done on Local Git branches are not included here. So if your team has a habit of doing all development on a local branch and pushing it to a remote branch after a period of time, you may not see any Commit activity.
It might be worthwhile looking into this if you have a practice of developers always using Local branches and pushing code to Remote only after dev completion.
Check-Ins
The Activity log for a day is auto-generated from the user’s actions across VCS & Project management tools. In addition, user responses to Check-Ins are also included in the Activity Log. The combined view is visible in the fly-out panel by clicking on the Open button inside a day cell.
Check-ins can be configured via the Check-In menu on the home page. Refer Check-Ins documentation for more information.
Use cases
- Views all work activity from a weekly point of view or extend the time filter to include the entire sprint.
- See checkins in context of the activity log to understand the work plans & work done at an individual level.
- Visualise unusual patterns in work activity to:
- Identify overwork, underwork, or imbalances in workload allocation
- People working on weekends
- Recurring pattern of high or low activity levels for specific individuals
- Identify patterns of decline in work activity which can be used as an additional sign for burnout
- Integrate with Check-ins to record individual-level plans for the day & the activities done for the day
- Helps drill down to the details of the problematic areas and work with your teams with a data driven approach.
- Helps prioritise work for the next week or next sprint
- For teams that on a 1 week sprints, it is normal to see a lot of Git activity in the first 3 days of the sprint with the last 2 days being more ‘deployment’ focus. There might be similar patterns in your engineering practices, view this data with that perspective to see which tasks or individuals might be at risk of slippage
Do not use this dashboard as a “Big Brother” tool to micro-manage individual level activities. As tempting as that might be, it is unhealthy & counter-productive for most engineering teams. That said, you should consider using this dashboard to help new team members get better at planning & improving their task completion rates.
Insights
Use this dashboard to get insights into how the team is operating & the team’s workload including:
- Are developers committing in small batches vs big chunks?
- Are the senior developers, Tech Leads doing PR reviews and also making individual contributions?
- What is the ebb-and-flow in activity levels across weeks for an individual or a team that is working on a big release?
- Is the activity level & activity type aligned with your sprint & shipping goals?
- When do PR merges happen - closer to end of the sprint or as-and-when the PR reviews finish?
- Are there hotspots on the team wrt activity levels? Are some individuals or teams busier than the others consistently?
- Do the PR merge and Issues resolution happen close together or are they farther apart?
FAQ
What is the source of this data?
- PR & code related data is sourced from the underlying VCS (Github, Bitbucket etc)
- Issues & sprint data is sourced from the underlying Project management system (Jira, Azure Boards etc.)
Can we include or exclude activities from the view?
Use the Activities filter to select which activities are displayed
Which types of Check-ins are included in the Activity log?
Check-ins created using the Stand-up template are automatically linked with the Daily Activity.
Why does the Activity Log show a higher count of PRs Reviewed than the number of unique pull requests reviewed?
The PRs Reviewed metric in the Activity Log may sometimes display a higher count than anticipated due to how activity is logged:
The Activity Log captures all instances of activity, including multiple reviews of the same pull request and each general PR comment (opens in a new tab) left on a pull request. So, if a user reviews the same pull request multiple times or adds several general PR comments, each instance is recorded as a separate activity.
This approach ensures that all user actions are captured comprehensively in the Activity Log, providing a detailed timeline of their engagement with pull requests over time.
Why are some PR comments counted as separate reviews?
GitHub offers two ways to comment on pull requests, each treated differently in the review count:
- General PR Comments: These are overall comments added directly to a pull request, often used for general feedback or discussions. Example (opens in a new tab).
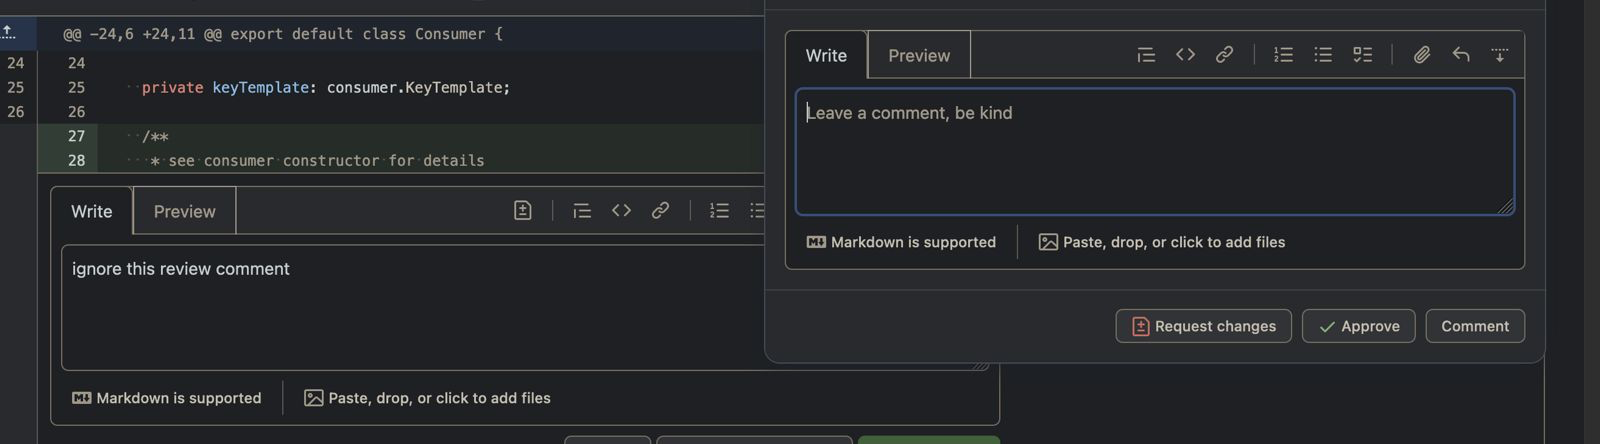
- Inline Comments: These are specific comments made on particular lines of code within a pull request as part of the "Start a review" process. Example (opens in a new tab).
- Commit Comments: These are comments left on individual commits within a repository, distinct from pull request comments. Example (opens in a new tab). Read more in this (opens in a new tab) GitHub Doc.
The review count includes each general comment and each review session with inline comments separately. This means that if you make multiple general comments on a pull request, each one is counted individually. Similarly, a review session with inline comments is counted as a single review.
Commit Comments are not included in the Activity Log metrics.
This distinction ensures that all types of feedback are accurately tracked, providing a detailed view of the review process and user interactions within the pull request.
Further Reading
- https://www.hatica.io/blog/sprint-planning/ (opens in a new tab)
- https://www.hatica.io/blog/fix-your-failing-sprint/ (opens in a new tab)
- https://www.hatica.io/blog/async-stand-ups/ (opens in a new tab)
- https://www.hatica.io/blog/8-tips-to-make-code-reviews-less-painful/ (opens in a new tab)
- https://www.hatica.io/blog/pull-request-tips/ (opens in a new tab)
- https://www.hatica.io/blog/git-repository-development-collaboration/ (opens in a new tab)